Tomer BurgPhD
All Archived Posts
Current Weather
Meteorology Analysis
Non-Weather Posts
PolarWx Update: Website is Functional Again!
Tomer Burg • 19 August 2022 • Non-Weather

Post Highlights
After an outage of just over a month, PolarWx is back online and functioning. This post serves to explain the cause of the prolonged outage, the current status of the website, and what changes are expected in the coming weeks and months to the website.
Prolonged Downtime for Server Upgrades
Consider the following famous quote from "What is a Good Forecast?" by Murphy (1993): "It should be understood that forecasts possess no intrinsic value. They acquire value through their ability to influence decisions made by users of the forecast." One possible interpretation of this is that an accurate forecast alone is insufficient, if not communicated well and implemented by the end users.

This concept can be applied even more broadly in meteorology. To make a good weather forecast, forecasters often need good tools, whether for observations or forecast model data. These tools can consist of the academic/research sector developing the methods, and computer programmers implementing them into user-friendly tools. In turn, the researchers and programmers need sufficient computing resources, especially if some of the analyses are computationally expensive. And maintenance is an important component as well – even the best server will need to be maintained to fix problems and upgrade to newer operating systems and packages.

The server that hosts this website – as well as PolarWx, and Steven Cavallo's website – is part of the Arctic and Antarctic Atmospheric Research Group (AAARG) research server. Our server had been scheduled for an upgrade, but unfortunately not every upgrade goes 100% smoothly on the technical side. Fortunately our department's IT has dedicated a lot of their time to get the server up and running again, and their efforts are greatly appreciated – PolarWx is now back online, with the underlying model plots running off of a brand new Python 3.10.5 environment.

This experience has been illustrative of the importance of IT in meteorology, especially given the computing needs whether for research or data visualization. This will be the subject of a future blog post; the rest of this post focuses on the current status of my website.
PolarWx Status: New Plots Available
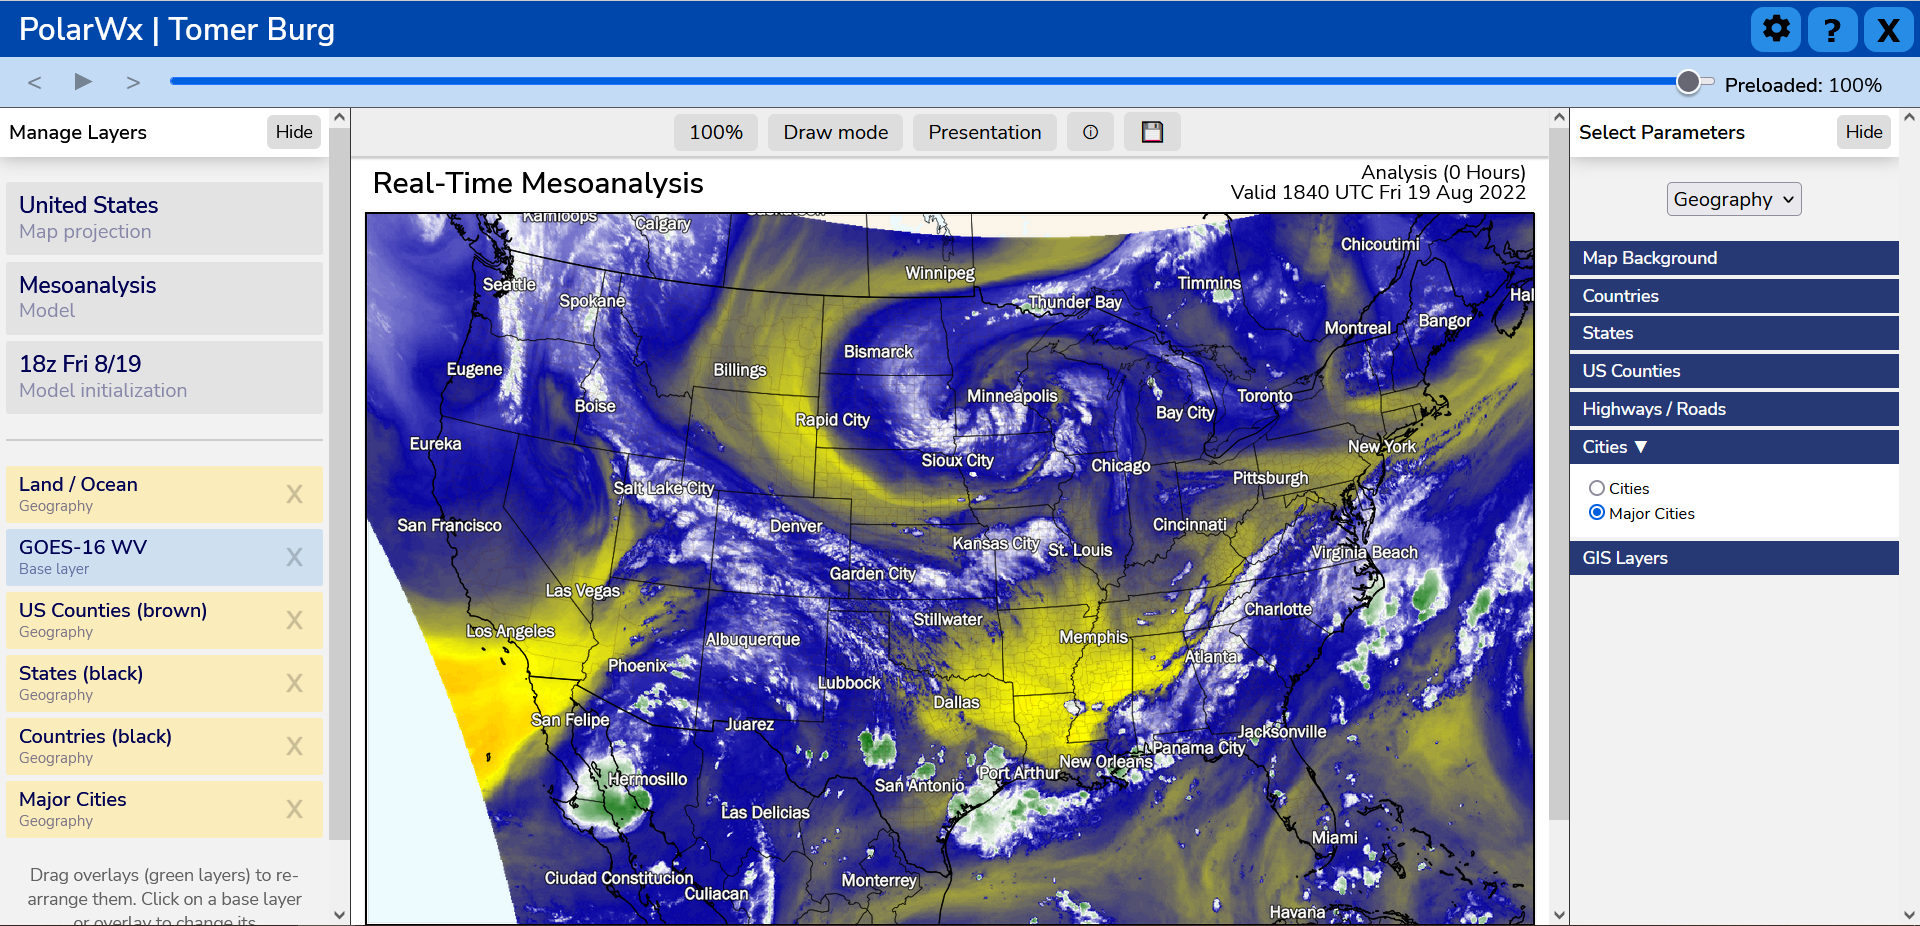
PolarWx preview of the newest addition of GOES-16 water vapor imagery.
Even though our server was restored on Tuesday, PolarWx is only now back to near full functionality. Part of the delay was in setting up a new Python environment, improving GFS plot production such that plots are produced much faster in real time than they were before, and changing the syntax of the underlying plot production to be consistent with MetPy v1.3.
  • What's New: New additions include (1) GOES-16 water vapor imagery, (2) fixed most observed METAR plots so that the stations displayed don't change every hour, (3) overhauling the GFS plot production to produce plots at almost the instant the model data is available, and (4) completely overhauled GEFS ensemble plot selection including more ensemble spaghetti plots, and ensemble spread plots as denoted by interquartile range (IQR) difference plot. IQR difference plots can be better for some applications than standard deviations, as they do not assume a gaussian ensemble distribution and are less sensitive to outliers.
  • What's Still Not Working: Most of the plots are fully functional again, but a few bugs will continue to be worked out over the coming days, including (1) some projections don't plot hour 0 GFS maps, (2) GOES-16 satellite plots have occasional gaps, and (3) forecast model station plots are very slow to generate.
  • What's Coming Next: Expanded resources on our server will allow for the addition of a new map projection for the GFS on PolarWx. Additionally, expect a variety of new GEFS ensemble maps over the coming weeks and months as we approach winter in the North Hemisphere.
Overall Website Status
Most of my website is fully functional again. This includes the following pages: The one part of my website I haven't been able to bring back is my COVID-19 data webpage. Due to the prolonged outage of our server, some of the data online is no longer accessible, and the amount of work to bring back the full page would be too time consuming. I may bring back limited plots (specifically for US counties and states) over the coming weeks.
Share this post: