Tropopause maps: Past 10 days - 10 day forecast
Dynamic tropopause (2 PVU surface) plots from 0.5 degree GFS analyses over the past 10 days, and 0.5 degree GFS forecasts over the next 10 days. Magenta `+' symbols denote locations of upper-air observations at any time since 1 January 2014.
|
| Tropopause Field |
Northern Hemis. |
Arctic zoom |
Southern Hemis. |
| Potential temperature
Colors with 1 K interval, sea level pressure with contour interval of 4 hPa up to 996 hPa (1004 hPa) in Northern Hemisphere (Southern Hemisphere)
|
X |
X |
X |
| Potential temperature anomalies
Standardized anomalies (colors, interval of 0.5 standard deviations) and sea level pressure (contours, 4 hPa interval up to 996 hPa). Anomalies are with respect to 1981-2010 climatological mean.
|
X |
|
|
| Potential temperature ensemble forecast
GEFS ensemble spread in tropopause potential temperature (colors, 0.1 K interval) and tropopause potential temperature of control (contours, 5 K interval) from latest 00/12 UTC forecast.
|
X |
|
|
| Sea ice, sea level pressure, 1000 hPa wind
Near-real-time DMSP SSM/I-SSMIS daily polar gridded sea ice concentration (colors, fraction between 0 and 1), GFS sea level pressure (gray contours, 4 hPa interval) and GFS 1000 hPa wind speed (red contours, 5 m s-1 interval)
|
|
X |
|
| Pressure
Colors, 10 hPa interval
|
X |
|
|
| Jet stream
Wind magnitude (colors, 1 m s-1 interval)
|
X |
|
|
Related diagnostics. Past 7 days - 7 day forecast
Plots from 0.5 degree GFS analyses over the past 7 days, and 0.5 degree GFS forecasts over the next 7 days.
|
| 1000-500 hPa thickness, 500 hPa absolute vorticity
Absolute vertical vorticity (color interval of 1 x 10⁻⁵ s-1), 1000-500 hPa thickness (contour interval 60 m)
|
X |
|
|
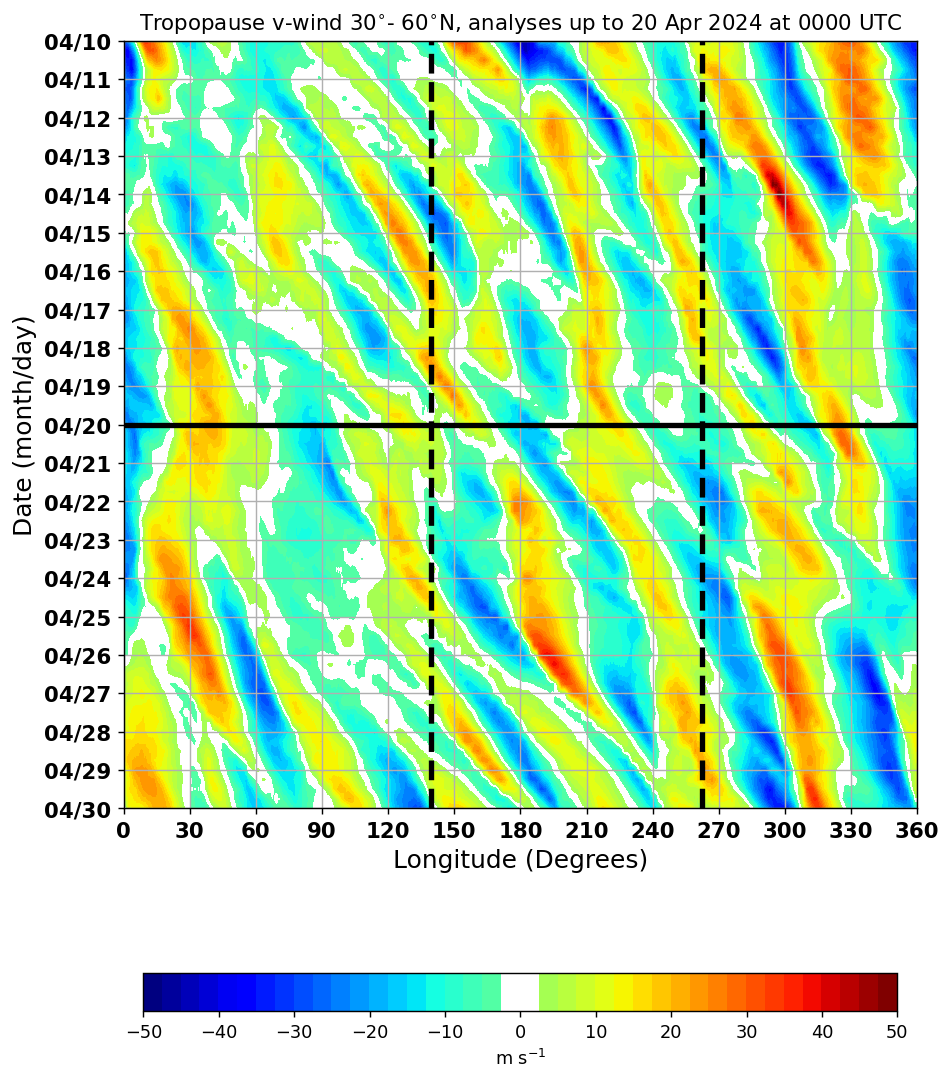
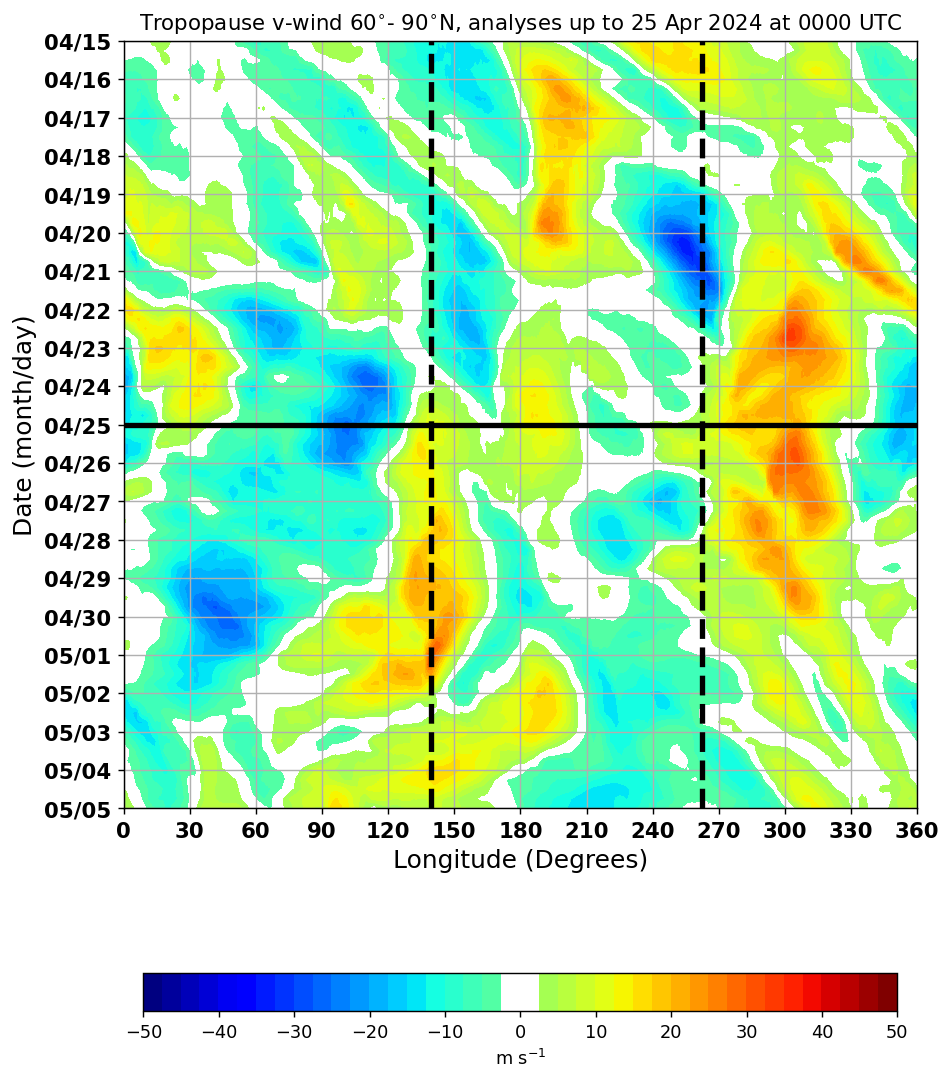
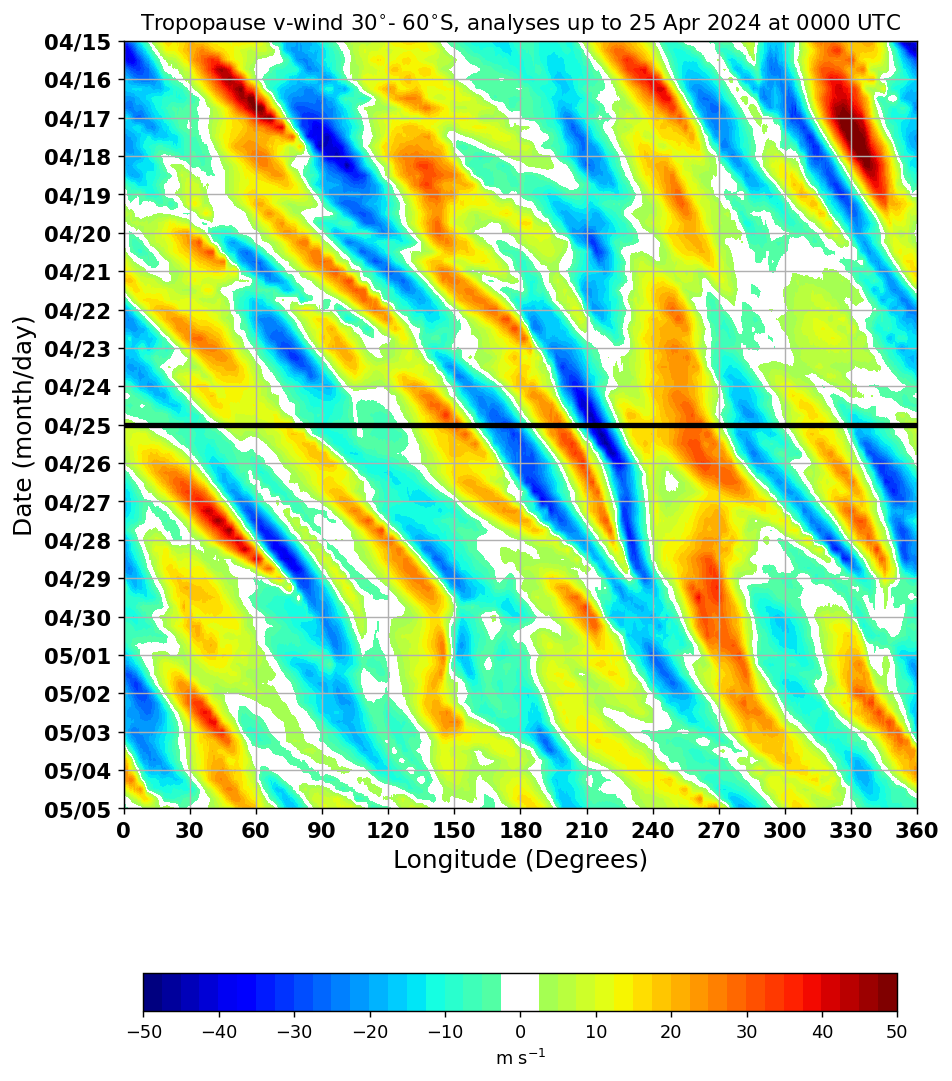
| Hovmoller
Meridional wind on tropopause, averaged from 30-60 degrees N latitude for Northern Hemisphere option, 60-90 degrees N latitude for Arctic zoom option, and 30-60 degrees S latitude for Southern Hemisphere option.
|
X |
X |
X |
Forecast evaluation (GFS, 0.5 degree)
Forecast minus analysis differences with respect to latest analysis.
|
| d[Potential temperature forecast]/dt
0-7 day forecast trends valid at analysis time and various forecast times. Colors with 1 K interval, sea level pressure with contour interval of 4 hPa up to 996 hPa (1004 hPa) in Northern Hemisphere (Southern Hemisphere)
|
V/0h
V/24h
V/48h
V/72h
V/96h
V/120h
V/144h
V/168h
|
|
V/0h
V/24h
V/48h
V/72h
V/96h
V/120h
V/144h
V/168h
|
| Tropopause Potential temperature forecast trends
1-7 day forecast minus analysis (V000) or 2-7 day forecast minus most recent forecasts (V024, V048, V072). Colors are differences with interval of 1 K, contours are tropopause potential temperature at verification time with interval of 5 K.
|
V/0h
V/24h
V/48h
V/72h
|
|
|
| Sea level pressure forecast trends
1-7 day forecast minus analysis (V000) or 2-7 day forecast minus most recent forecasts (V024, V048, V072). Colors are differences with interval of 1 hPa, contours are sea level pressure at verification time with interval of 4 hPa.
|
V/0h
V/24h
V/48h
V/72h
|
|
|
| Hovmoller 5-day forecast differences
Meridional wind on tropopause, averaged from 30-60 degrees N latitude for Northern Hemisphere option,
60-90 degrees N latitude for Arctic zoom option, and 30-60 degrees S latitude for Southern Hemisphere option. [Colors] (Contours) through latest analysis time
are [5-day forecast minus analysis differences] (analysis field) . [Colors] (contours) after analysis time are [5-day forecast trends ] (most recent forecast field)).
Forecast drift is the 5-day forecast minus the latest forecast valid at the time on the y-axis.
|
X |
X |
X |