Post-Tropical Cyclone Flossie
Latest Update
•
2100 UTC 03 July 2025
Active Tropical Cyclones
Active Invests
Forecast Graphic
Forecast Statistics
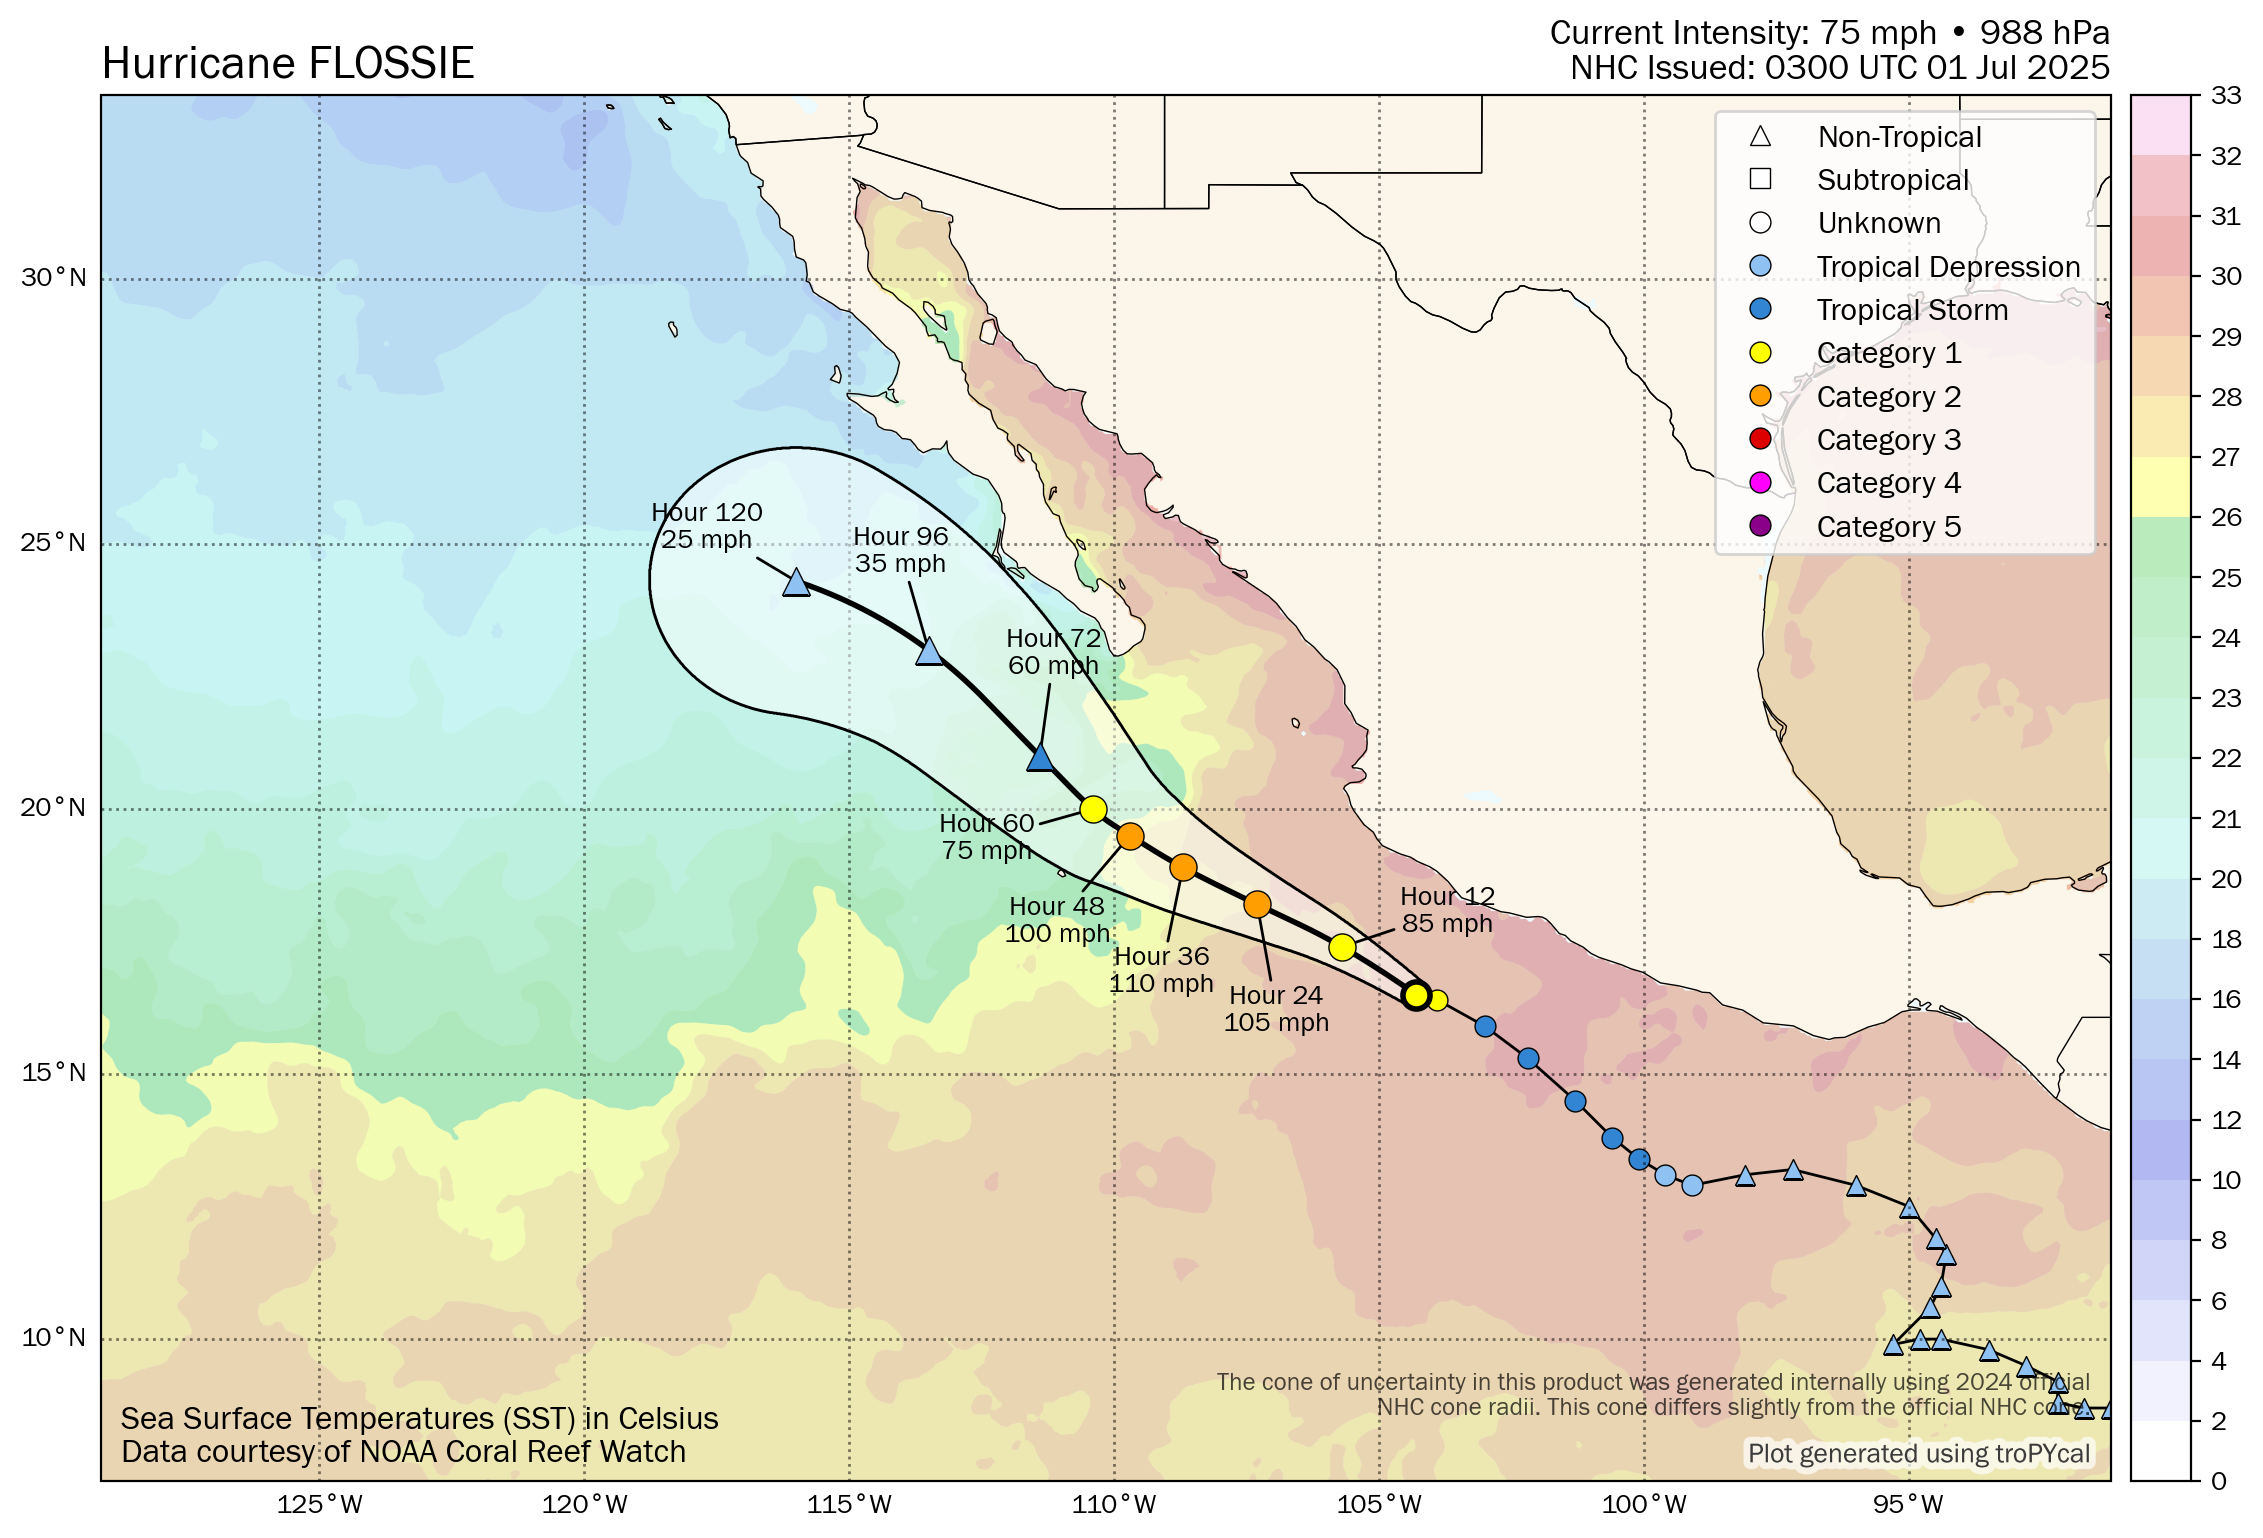
| Hours | Change | Percentile Rank |
|---|---|---|
| 0–24 hr | –10 kt | ≤ 25th Percentile |
| 12–36 hr | –10 kt | ≤ 25th Percentile |
| 24–48 hr | –5 kt | Normal Range |
| Time (UTC) | Lat | Lon | Wind (mph) | Pressure | Storm Type | Category |
|---|---|---|---|---|---|---|
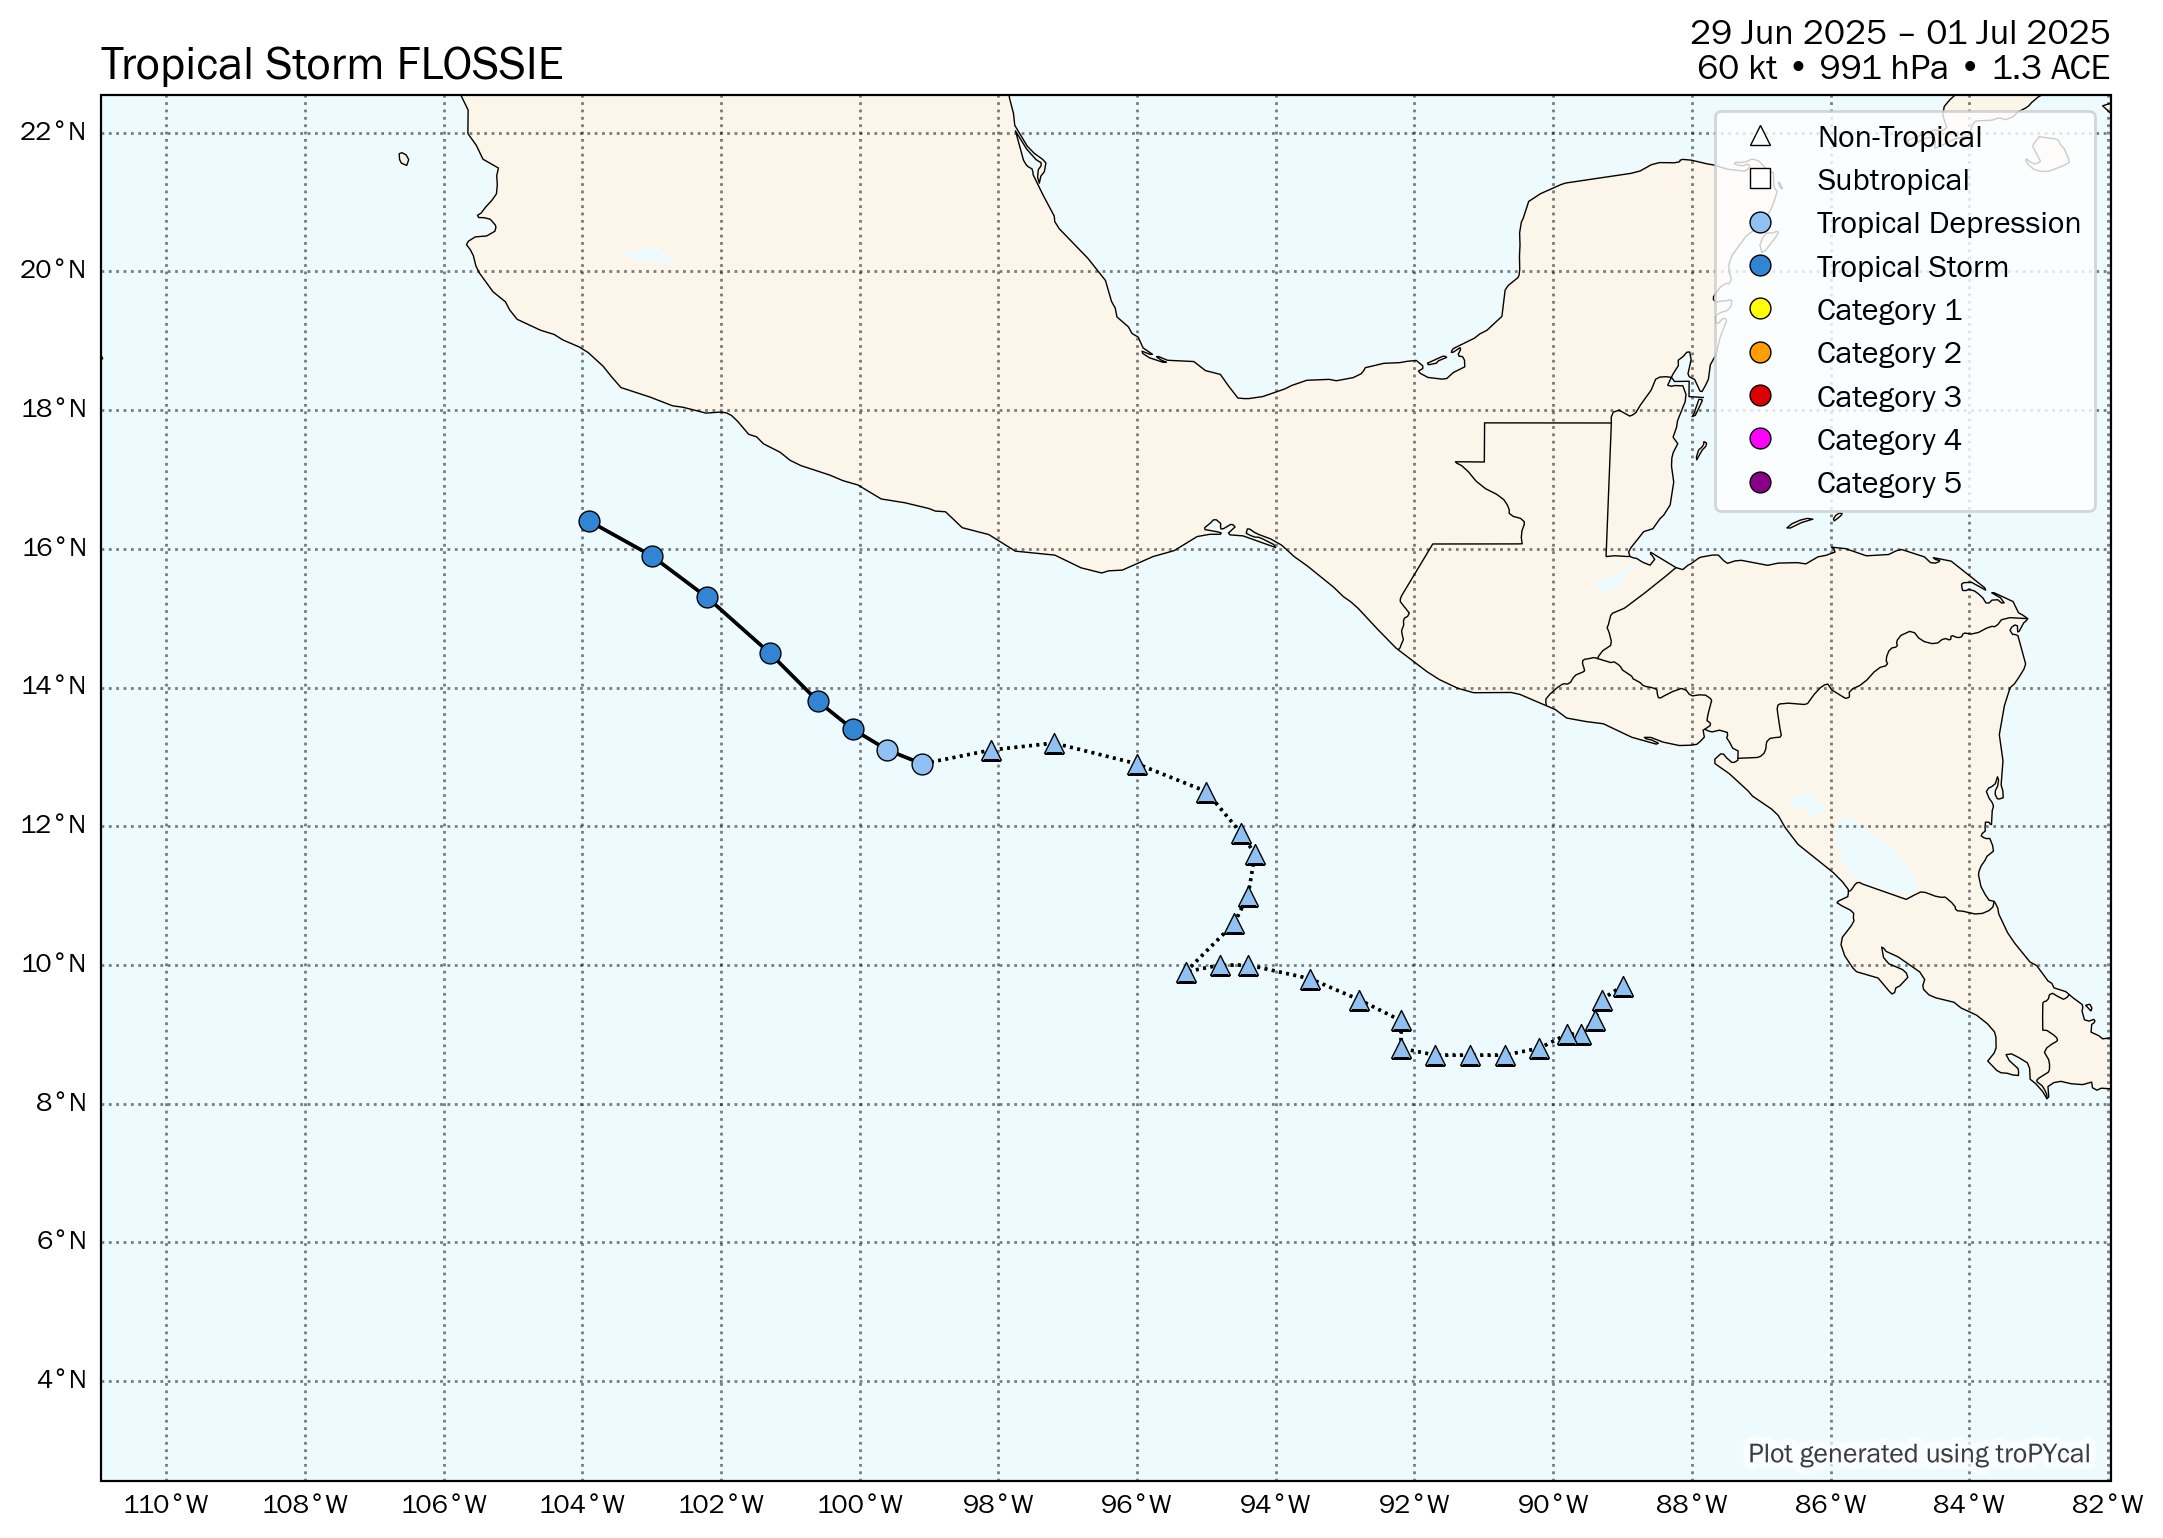
| 0600 UTC 23 Jun | 9.7 | -89.0 | 25 | N/A | Disturbance | - |
| 1200 UTC 23 Jun | 9.5 | -89.3 | 25 | N/A | Disturbance | - |
| 1800 UTC 23 Jun | 9.2 | -89.4 | 25 | N/A | Disturbance | - |
| 0000 UTC 24 Jun | 9.0 | -89.6 | 30 | N/A | Disturbance | - |
| 0600 UTC 24 Jun | 9.0 | -89.8 | 35 | 1009 | Disturbance | - |
| 1200 UTC 24 Jun | 8.8 | -90.2 | 35 | 1008 | Disturbance | - |
| 1800 UTC 24 Jun | 8.7 | -90.7 | 35 | 1008 | Disturbance | - |
| 0000 UTC 25 Jun | 8.7 | -91.2 | 35 | 1007 | Disturbance | - |
| 0600 UTC 25 Jun | 8.7 | -91.7 | 35 | 1007 | Disturbance | - |
| 1200 UTC 25 Jun | 8.8 | -92.2 | 30 | 1007 | Disturbance | - |
| 1800 UTC 25 Jun | 9.2 | -92.2 | 30 | 1007 | Disturbance | - |
| 0000 UTC 26 Jun | 9.5 | -92.8 | 30 | 1007 | Disturbance | - |
| 0600 UTC 26 Jun | 9.8 | -93.5 | 30 | 1007 | Disturbance | - |
| 1200 UTC 26 Jun | 10.0 | -94.4 | 30 | 1007 | Disturbance | - |
| 1800 UTC 26 Jun | 10.0 | -94.8 | 30 | 1007 | Disturbance | - |
| 0000 UTC 27 Jun | 9.9 | -95.3 | 30 | 1007 | Disturbance | - |
| 0600 UTC 27 Jun | 10.6 | -94.6 | 30 | 1007 | Disturbance | - |
| 1200 UTC 27 Jun | 11.0 | -94.4 | 30 | 1008 | Disturbance | - |
| 1800 UTC 27 Jun | 11.6 | -94.3 | 30 | 1009 | Disturbance | - |
| 0000 UTC 28 Jun | 11.9 | -94.5 | 30 | 1008 | Disturbance | - |
| 0600 UTC 28 Jun | 12.5 | -95.0 | 30 | 1008 | Disturbance | - |
| 1200 UTC 28 Jun | 12.9 | -96.0 | 30 | 1009 | Disturbance | - |
| 1800 UTC 28 Jun | 13.2 | -97.2 | 30 | 1009 | Disturbance | - |
| 0000 UTC 29 Jun | 13.1 | -98.1 | 30 | 1008 | Disturbance | - |
| 0600 UTC 29 Jun | 12.9 | -99.1 | 30 | 1008 | Tropical Depression | - |
| 1200 UTC 29 Jun | 13.1 | -99.6 | 35 | 1006 | Tropical Depression | - |
| 1800 UTC 29 Jun | 13.4 | -100.1 | 40 | 1005 | Tropical Storm | - |
| 0000 UTC 30 Jun | 13.8 | -100.6 | 40 | 1005 | Tropical Storm | - |
| 0600 UTC 30 Jun | 14.5 | -101.3 | 45 | 1004 | Tropical Storm | - |
| 1200 UTC 30 Jun | 15.3 | -102.1 | 50 | 999 | Tropical Storm | - |
| 1800 UTC 30 Jun | 15.9 | -103.0 | 65 | 996 | Tropical Storm | - |
| 0000 UTC 01 Jul | 16.4 | -103.9 | 75 | 988 | Hurricane | 1 |
| 0600 UTC 01 Jul | 16.8 | -104.7 | 80 | 984 | Hurricane | 1 |
| 1200 UTC 01 Jul | 17.2 | -105.5 | 90 | 978 | Hurricane | 1 |
| 1800 UTC 01 Jul | 17.6 | -106.3 | 110 | 966 | Hurricane | 2 |
| 0000 UTC 02 Jul | 18.0 | -107.1 | 115 | 962 | Hurricane | 3 |
| 0600 UTC 02 Jul | 18.4 | -107.9 | 115 | 962 | Hurricane | 3 |
| 1200 UTC 02 Jul | 18.8 | -108.7 | 110 | 967 | Hurricane | 2 |
| 1800 UTC 02 Jul | 19.3 | -109.4 | 100 | 974 | Hurricane | 2 |
| 0000 UTC 03 Jul | 19.6 | -109.9 | 80 | 983 | Hurricane | 1 |
| 0600 UTC 03 Jul | 19.9 | -110.5 | 65 | 994 | Tropical Storm | - |
| 1200 UTC 03 Jul | 20.3 | -111.3 | 50 | 999 | Tropical Storm | - |
| 1800 UTC 03 Jul | 20.9 | -112.0 | 40 | 1003 | Tropical Storm | - |
| Time (UTC) | Lat | Lon | Wind (mph) | Pressure | Storm Type | Category |
|---|---|---|---|---|---|---|
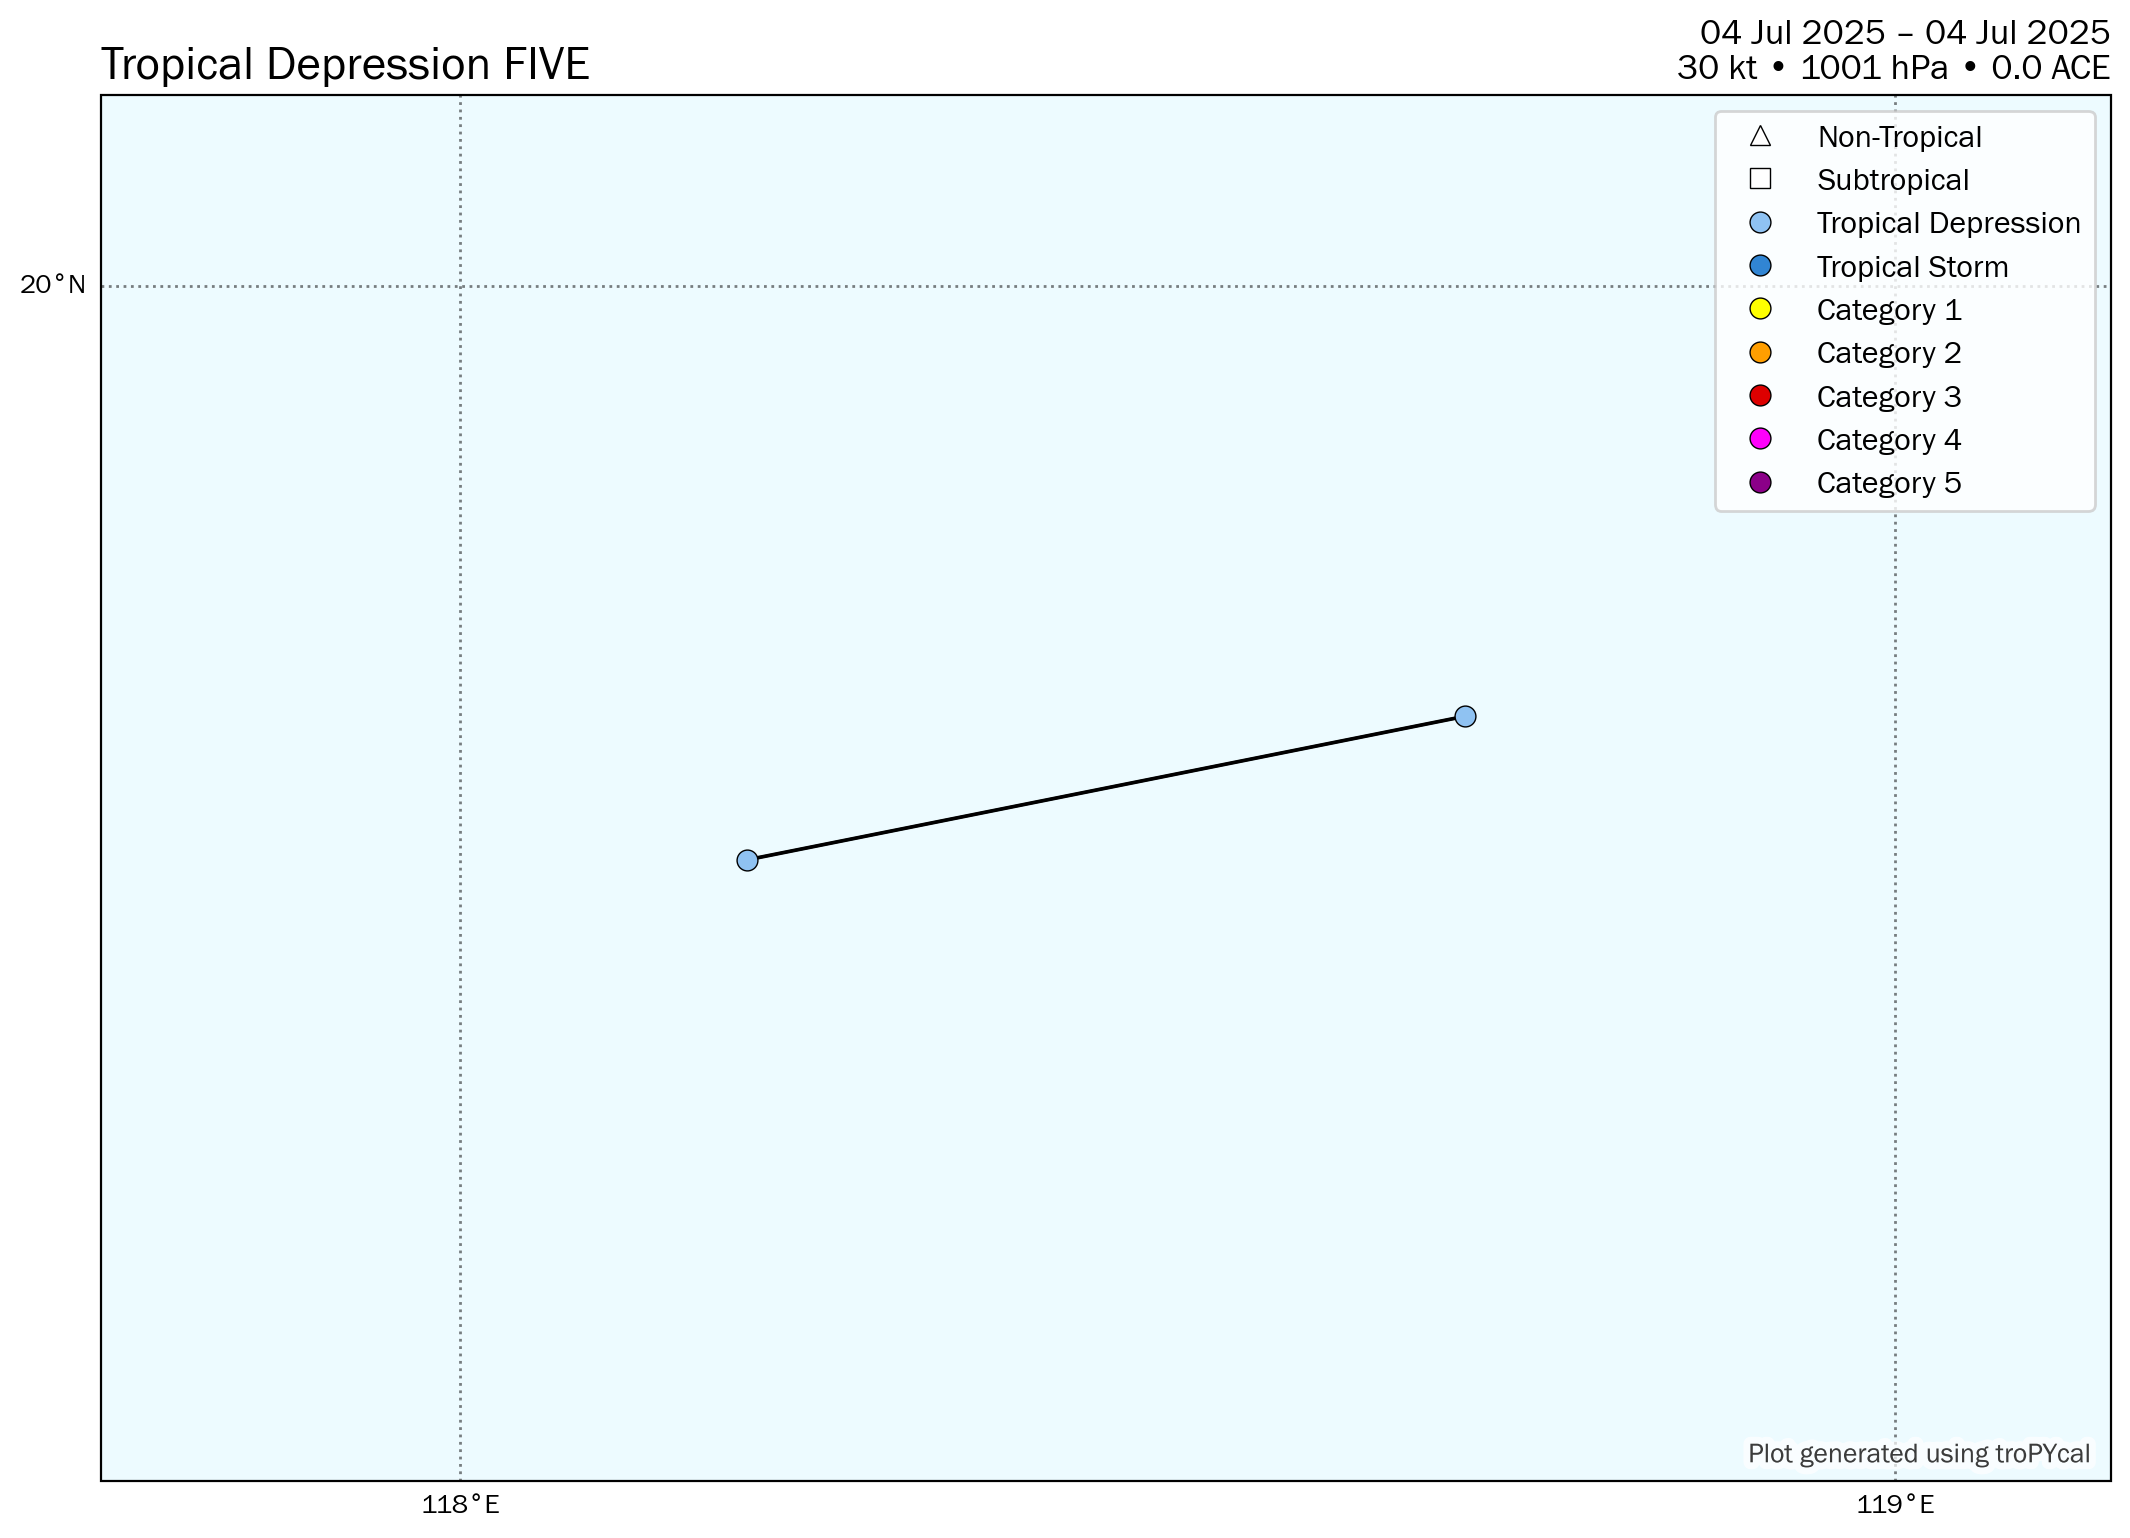
| 0000 UTC 04 Jul | 19.7 | 118.7 | 30 | 1001 | Tropical Depression | - |
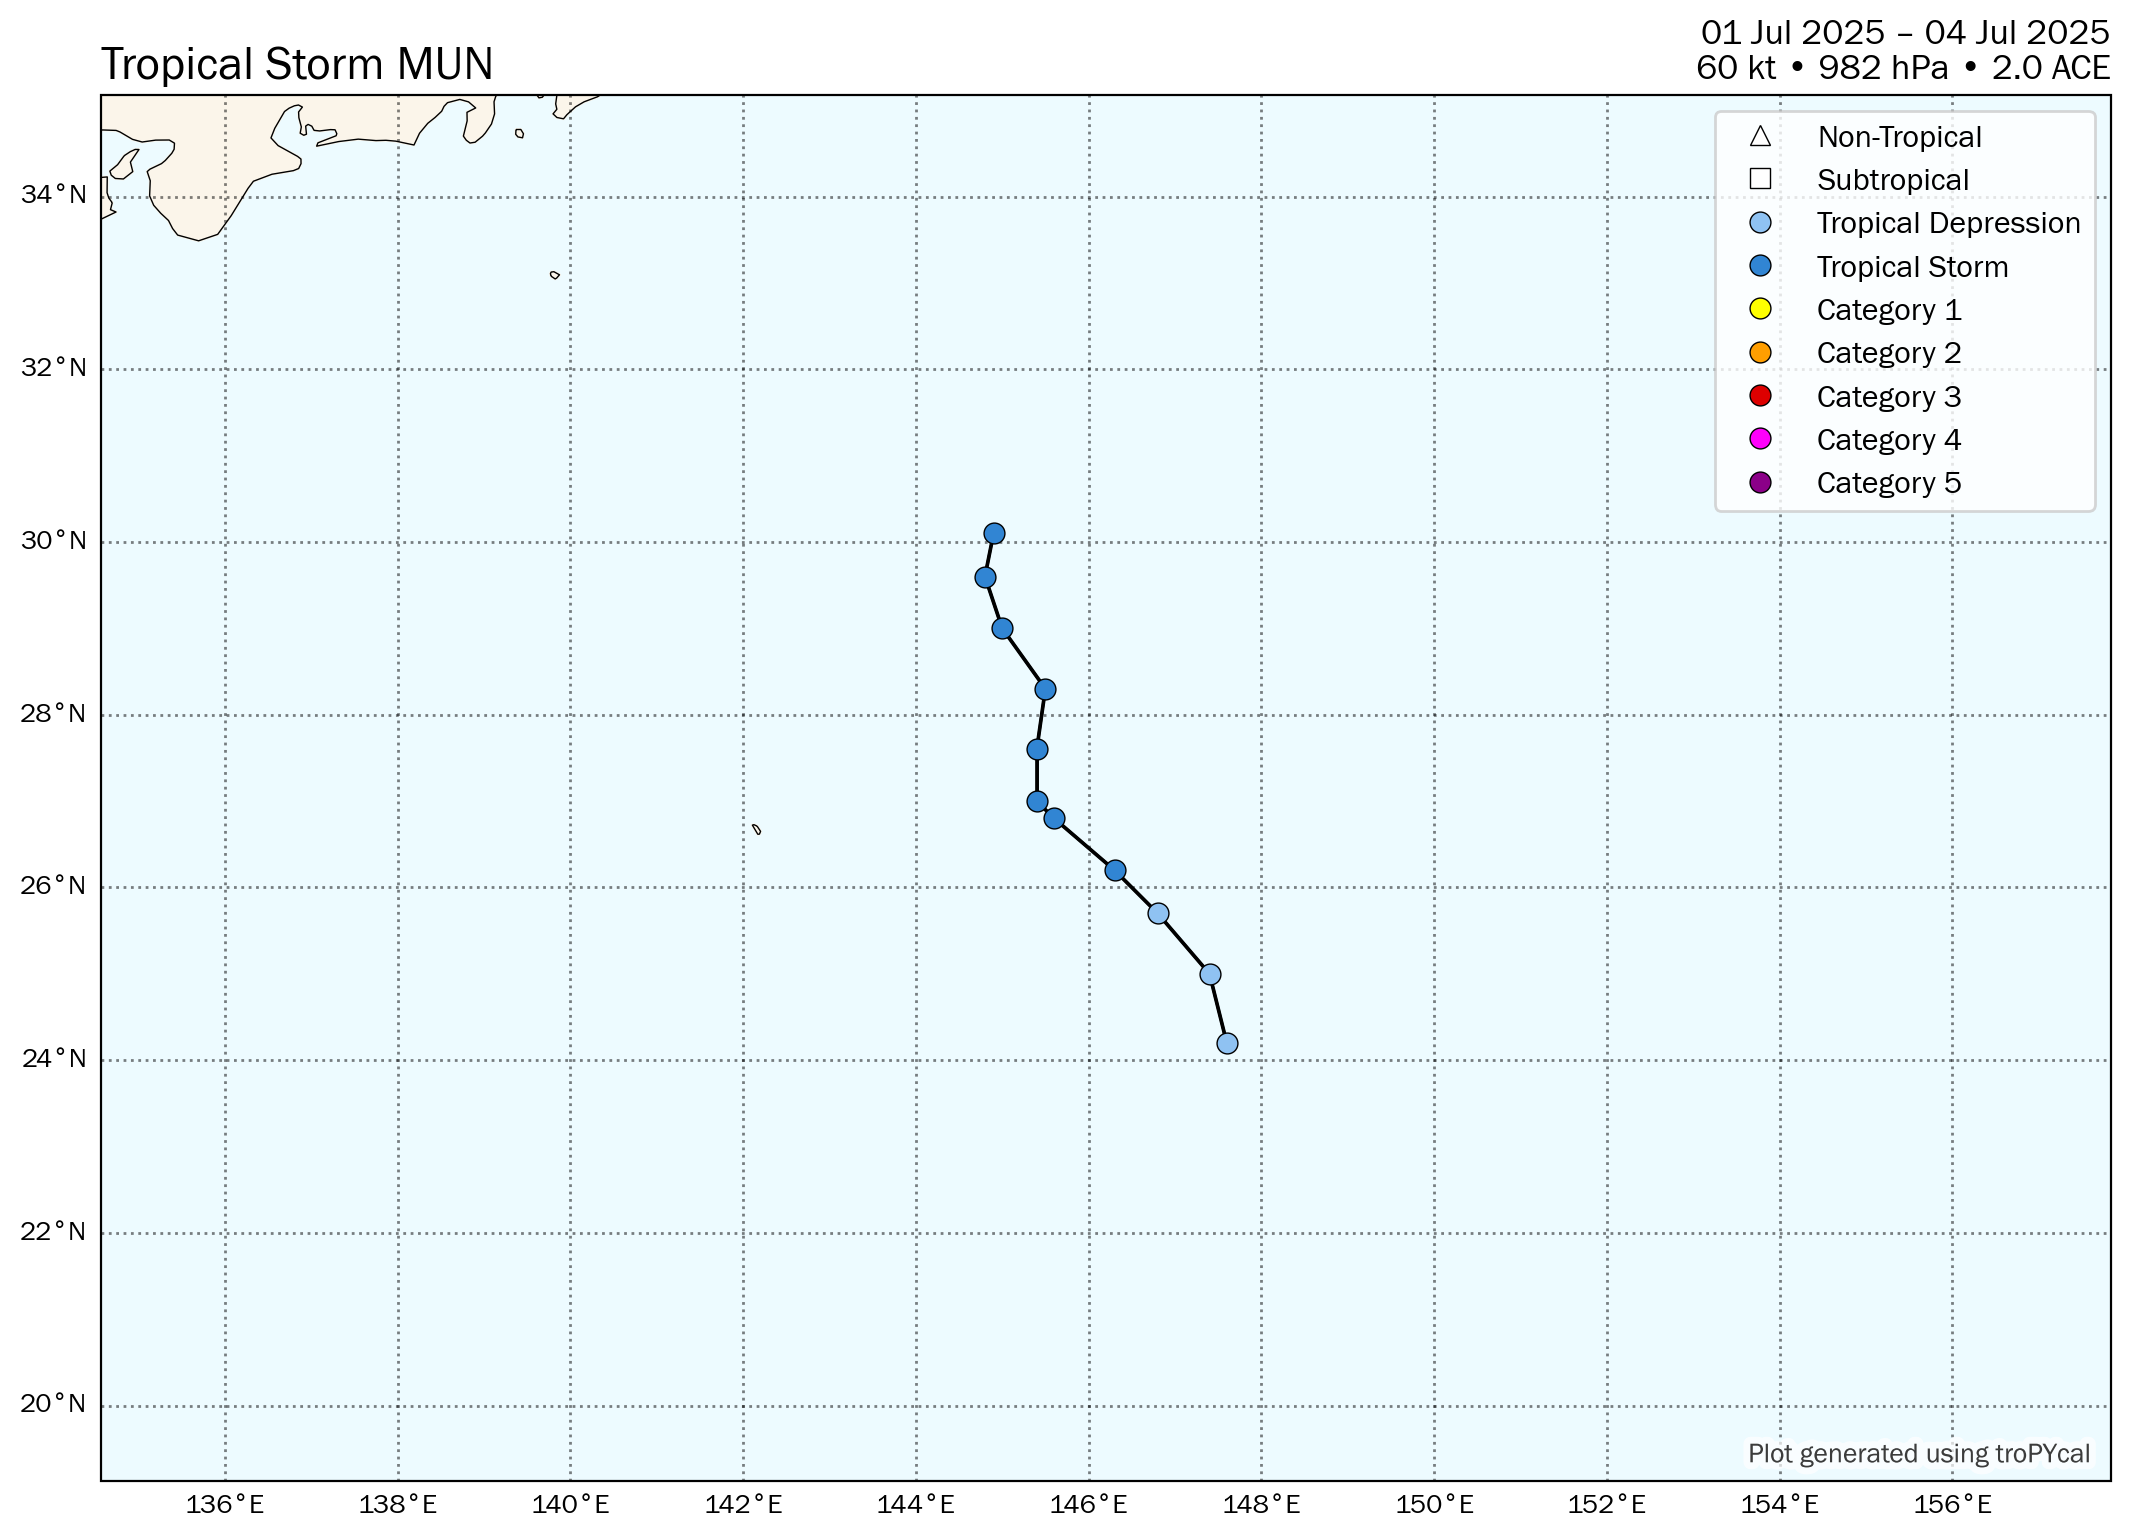
| Time (UTC) | Lat | Lon | Wind (mph) | Pressure | Storm Type | Category |
|---|---|---|---|---|---|---|
| 1800 UTC 01 Jul | 24.2 | 147.6 | 35 | 1003 | Tropical Depression | - |
| 0000 UTC 02 Jul | 25.0 | 147.4 | 35 | 1002 | Tropical Depression | - |
| 0600 UTC 02 Jul | 25.7 | 146.8 | 35 | 1001 | Tropical Depression | - |
| 1200 UTC 02 Jul | 26.2 | 146.3 | 40 | 1002 | Tropical Storm | - |
| 1800 UTC 02 Jul | 26.8 | 145.6 | 40 | 1000 | Tropical Storm | - |
| 0000 UTC 03 Jul | 27.0 | 145.4 | 45 | 995 | Tropical Storm | - |
| 0600 UTC 03 Jul | 27.6 | 145.4 | 60 | 989 | Tropical Storm | - |
| 1200 UTC 03 Jul | 28.3 | 145.5 | 70 | 982 | Tropical Storm | - |
| 1800 UTC 03 Jul | 29.0 | 145.0 | 70 | 982 | Tropical Storm | - |
| 0000 UTC 04 Jul | 29.6 | 144.8 | 65 | 982 | Tropical Storm | - |

| Time (UTC) | Lat | Lon | Wind (mph) | Pressure | Storm Type | Category |
|---|---|---|---|---|---|---|
| 1800 UTC 01 Jul | 16.9 | 124.0 | 25 | 1005 | Tropical Depression | - |
| 0000 UTC 02 Jul | 17.3 | 123.7 | 25 | 1006 | Tropical Depression | - |
| 0600 UTC 02 Jul | 17.6 | 123.8 | 25 | 1006 | Tropical Depression | - |
| 1200 UTC 02 Jul | 17.9 | 123.4 | 20 | 1006 | Tropical Depression | - |
| 1800 UTC 02 Jul | 18.9 | 122.5 | 25 | 1004 | Tropical Depression | - |
| 0000 UTC 03 Jul | 19.6 | 122.4 | 25 | 1005 | Tropical Depression | - |
| 0600 UTC 03 Jul | 20.4 | 121.7 | 25 | 1005 | Tropical Depression | - |
| 1200 UTC 03 Jul | 20.3 | 120.5 | 25 | 1005 | Tropical Depression | - |
| 1800 UTC 03 Jul | 19.5 | 119.5 | 25 | 1004 | Tropical Depression | - |