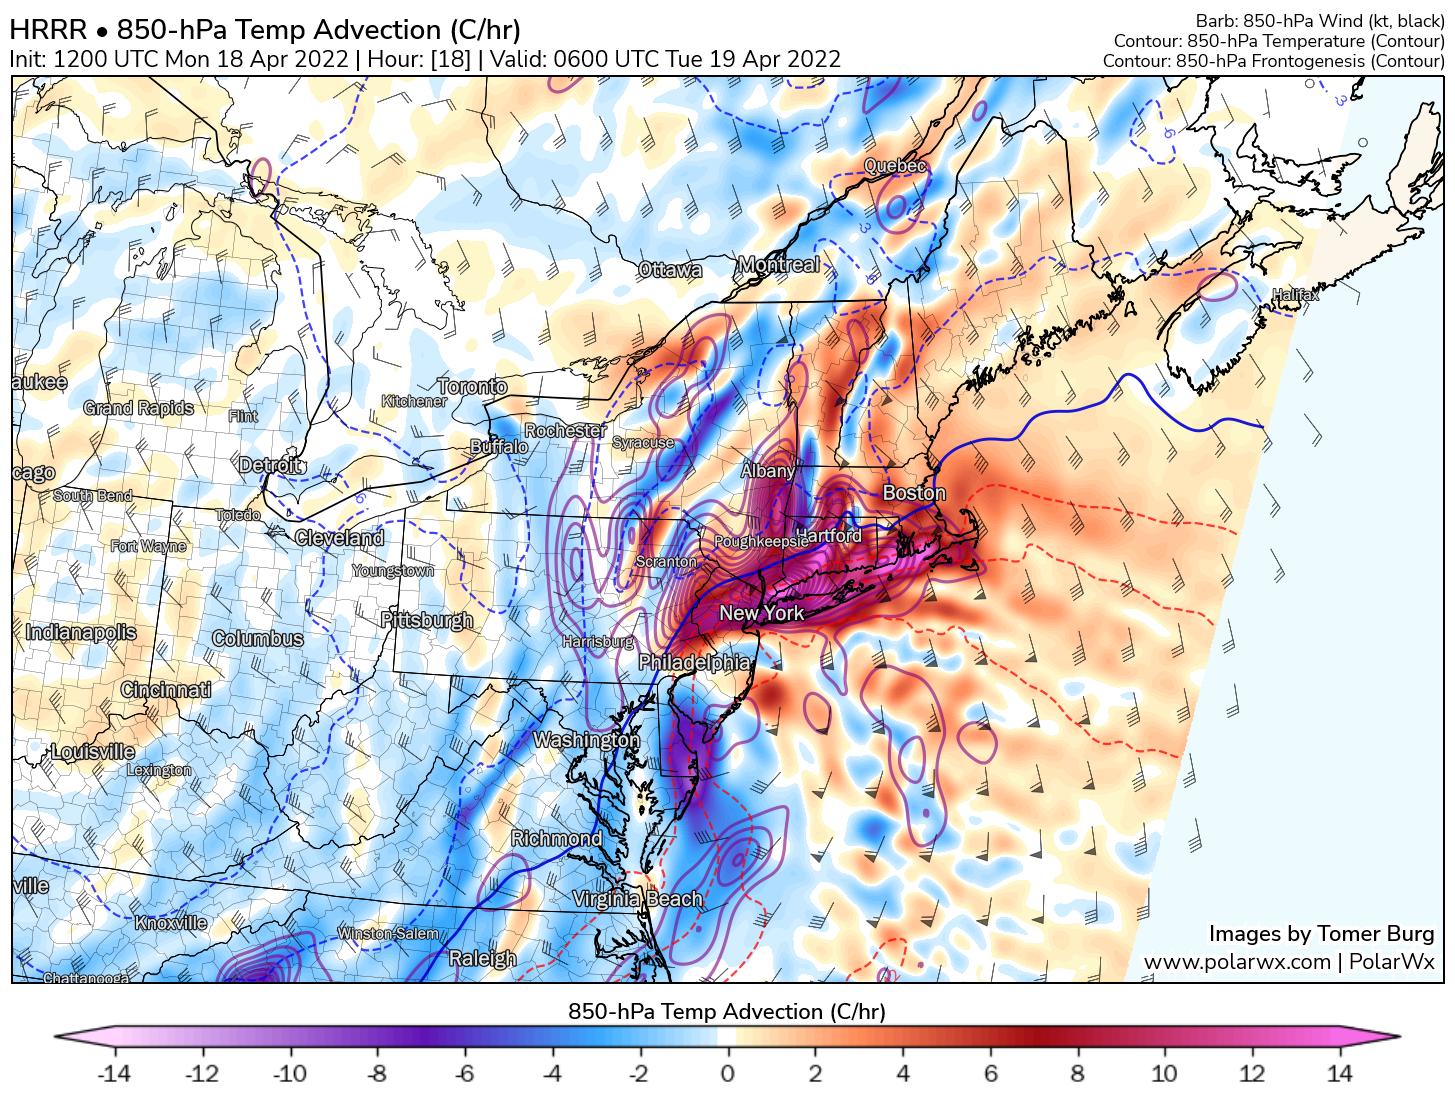
HRRR 850-hPa temperature advection (C/3hr, shading), temperature (dashed contours), wind (barbs, knots), and frontogenesis (purple contours), valid at 2:00am EDT Tuesday.
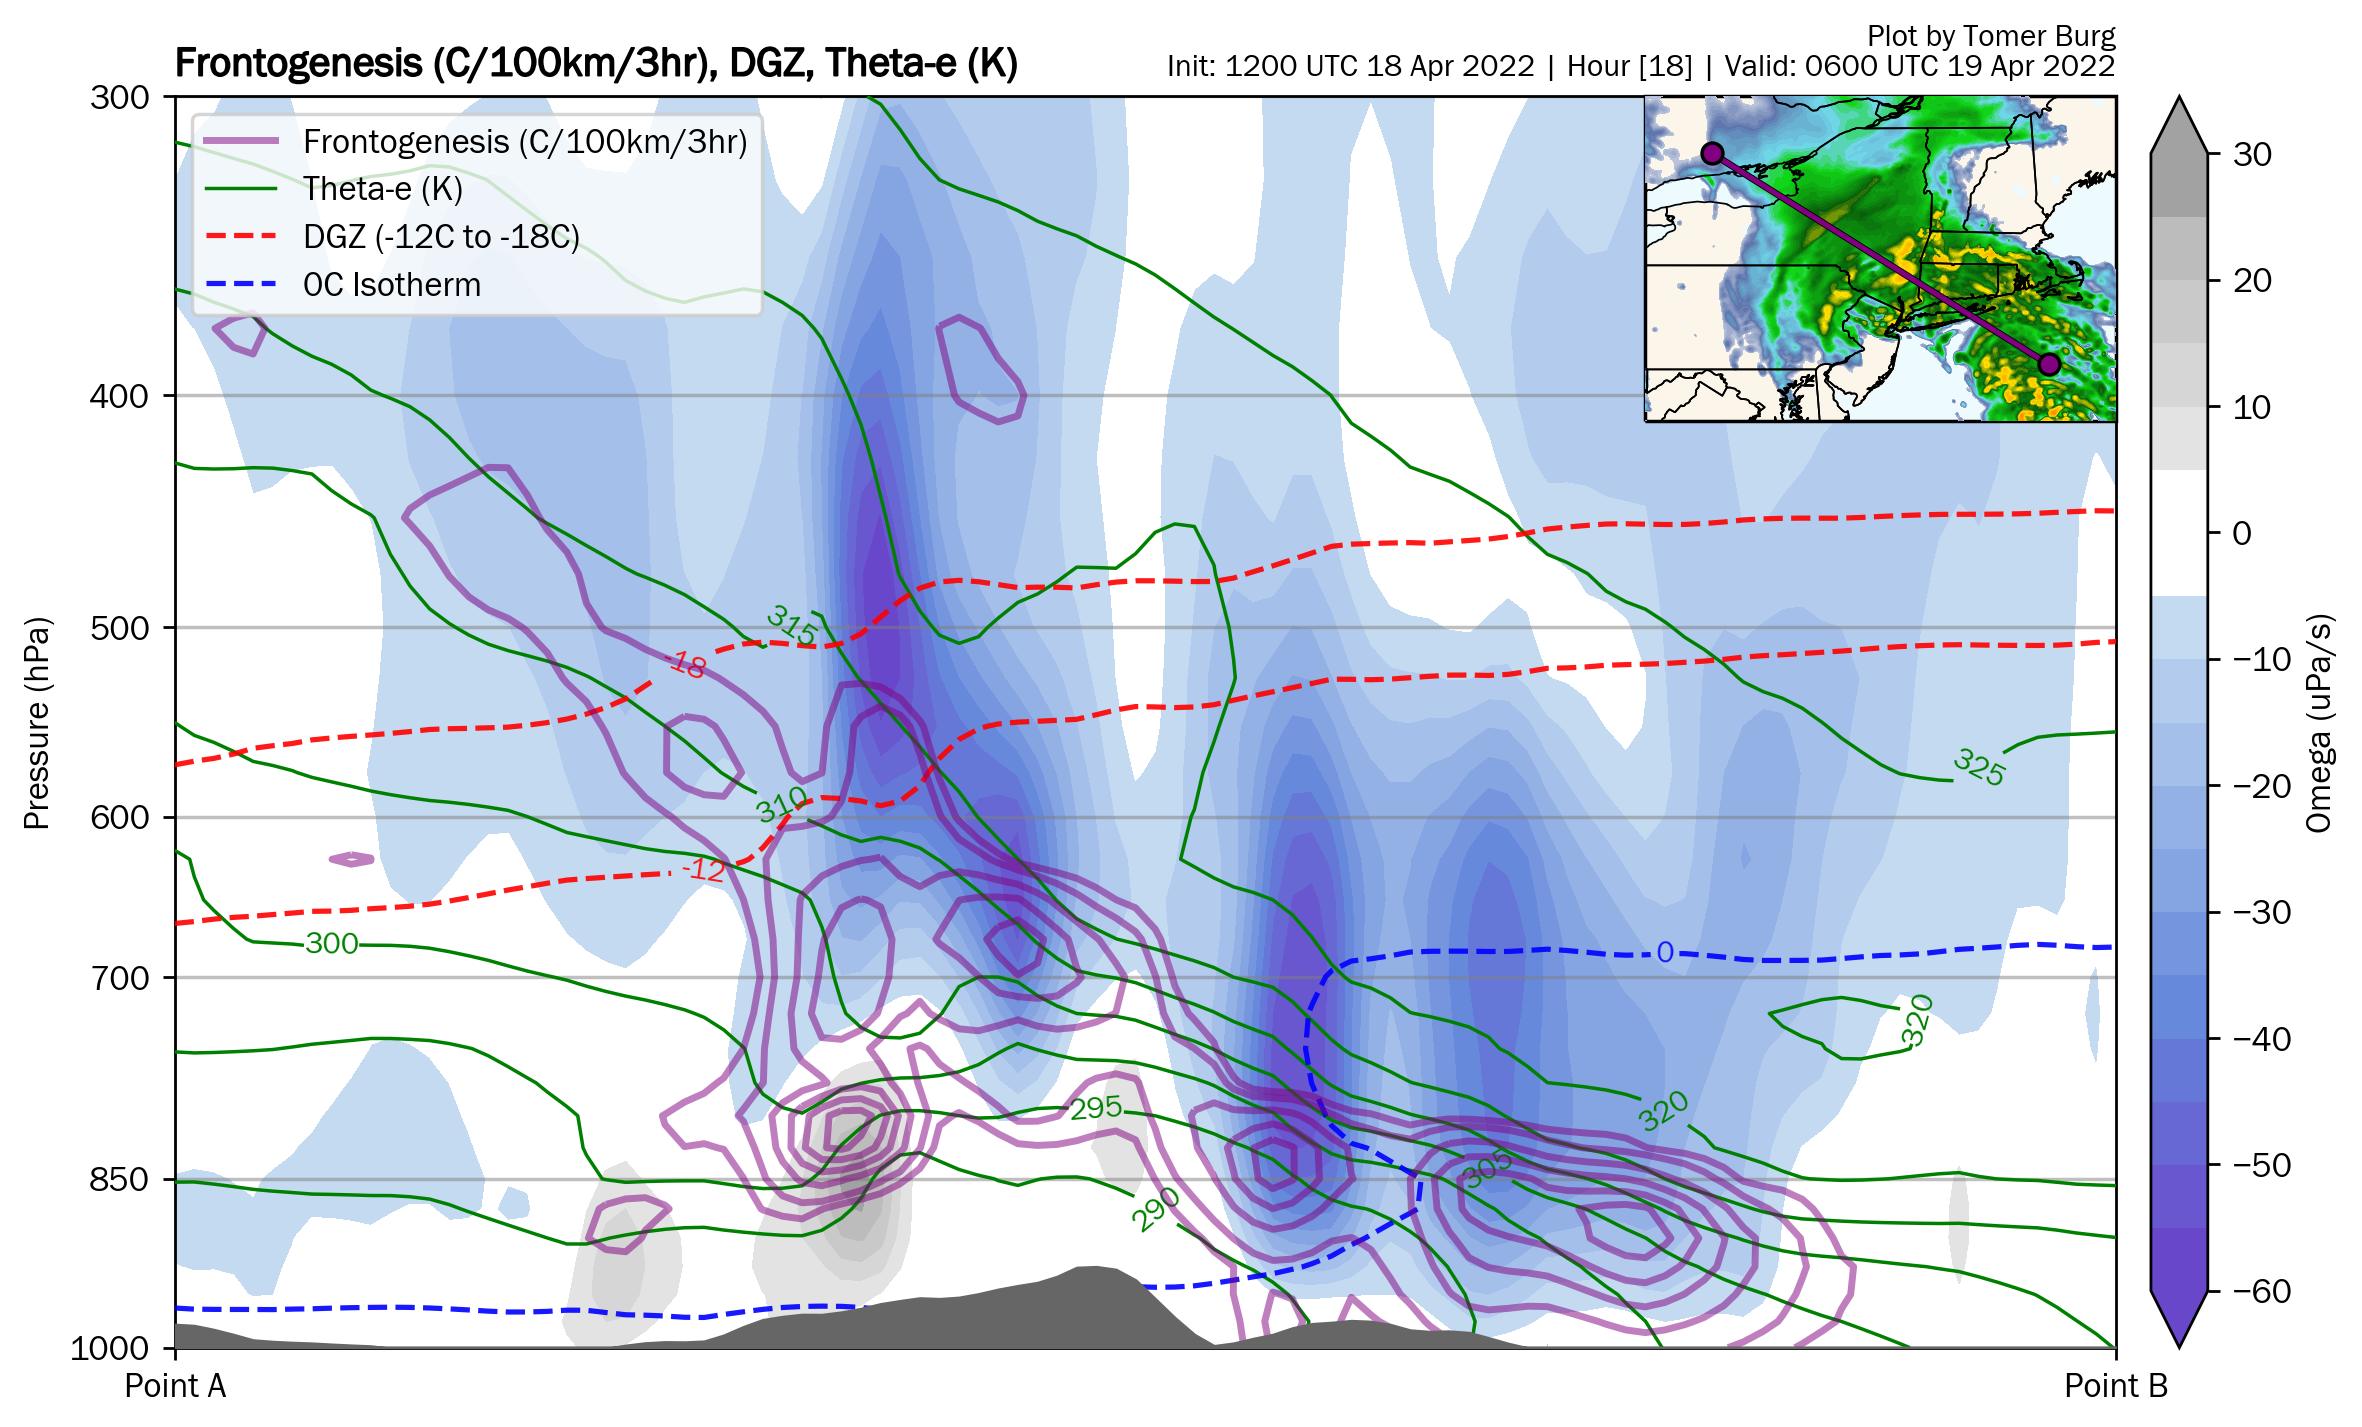
HRRR cross-section through the snow band, valid at 2:00am EDT Tuesday.
To get a sense of the type of snow expected with this band, notice that the ascent is maximized above the frontogenesis maximum, in between the two dashed red contours denoting the temperature range between -12C and -18C. This region denotes the dendritic growth zone (DGZ), which when collocated with strong ascent and high saturation (not shown) favors the growth of dendrites, which are lower in density and generally favor higher snow to liquid ratios (i.e., above the standard 10:1) when not disrupted by other factors such as wind. In this case, however, marginally cool surface temperatures near freezing may lead to aggregation and alongside relatively warm ground temperatures result in lower snow to liquid ratios than would've otherwise been the case had this occurred earlier in the winter.
Notice that just west of the band a region of subsidence exists in the lower levels, as denoted by gray shading indicating positive omega. While heavy preciptiation bands are associated with strong ascent, this is often offset by strong subsidence (descent) inland of the band, resulting in poor snow growth with lower ratios and lighter snow rates. This accordingly enhances the horizontal gradient in snow accumulations between the band and locations just inland of it.
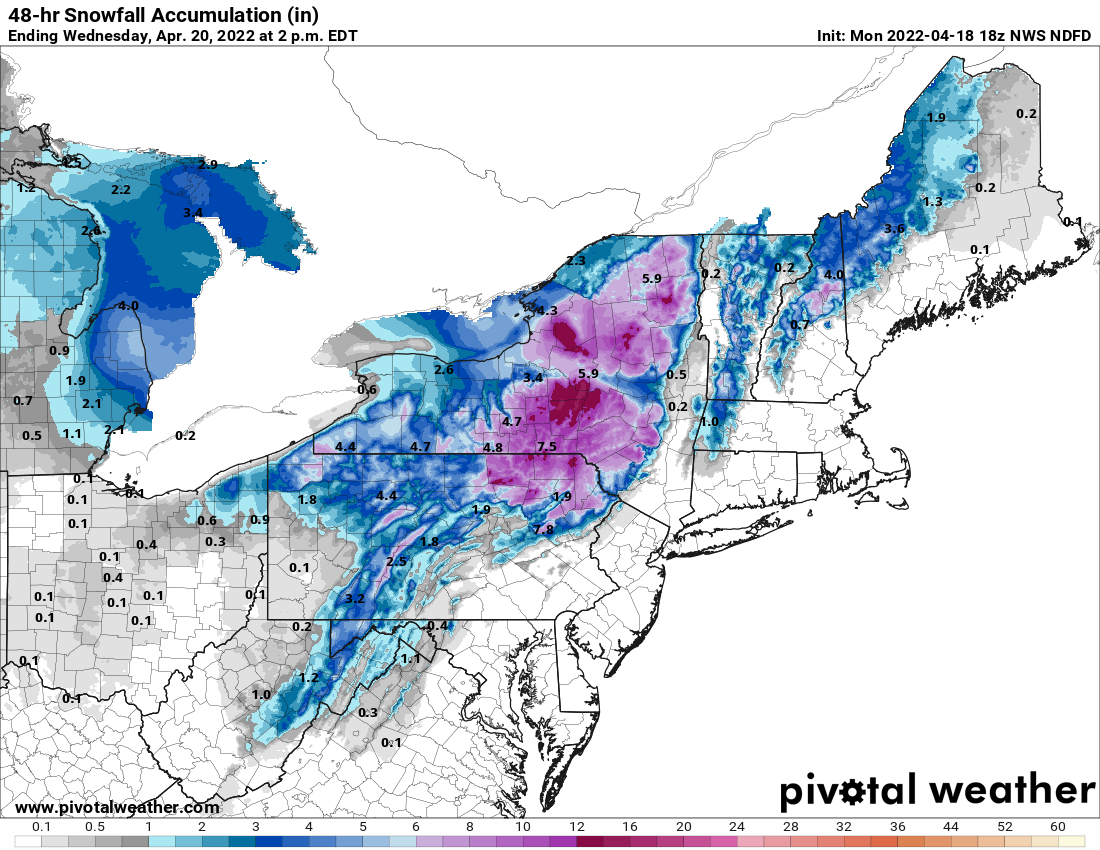 Official NWS snow accumulation forecast (inch), valid as of this afternoon.
 GFS 500-hPa cyclonic vorticity in shading, 500-hPa height in thick black contours, 500-hPa wind in barbs, MSLP in gray contours, and simulated reflectivity in green shading.
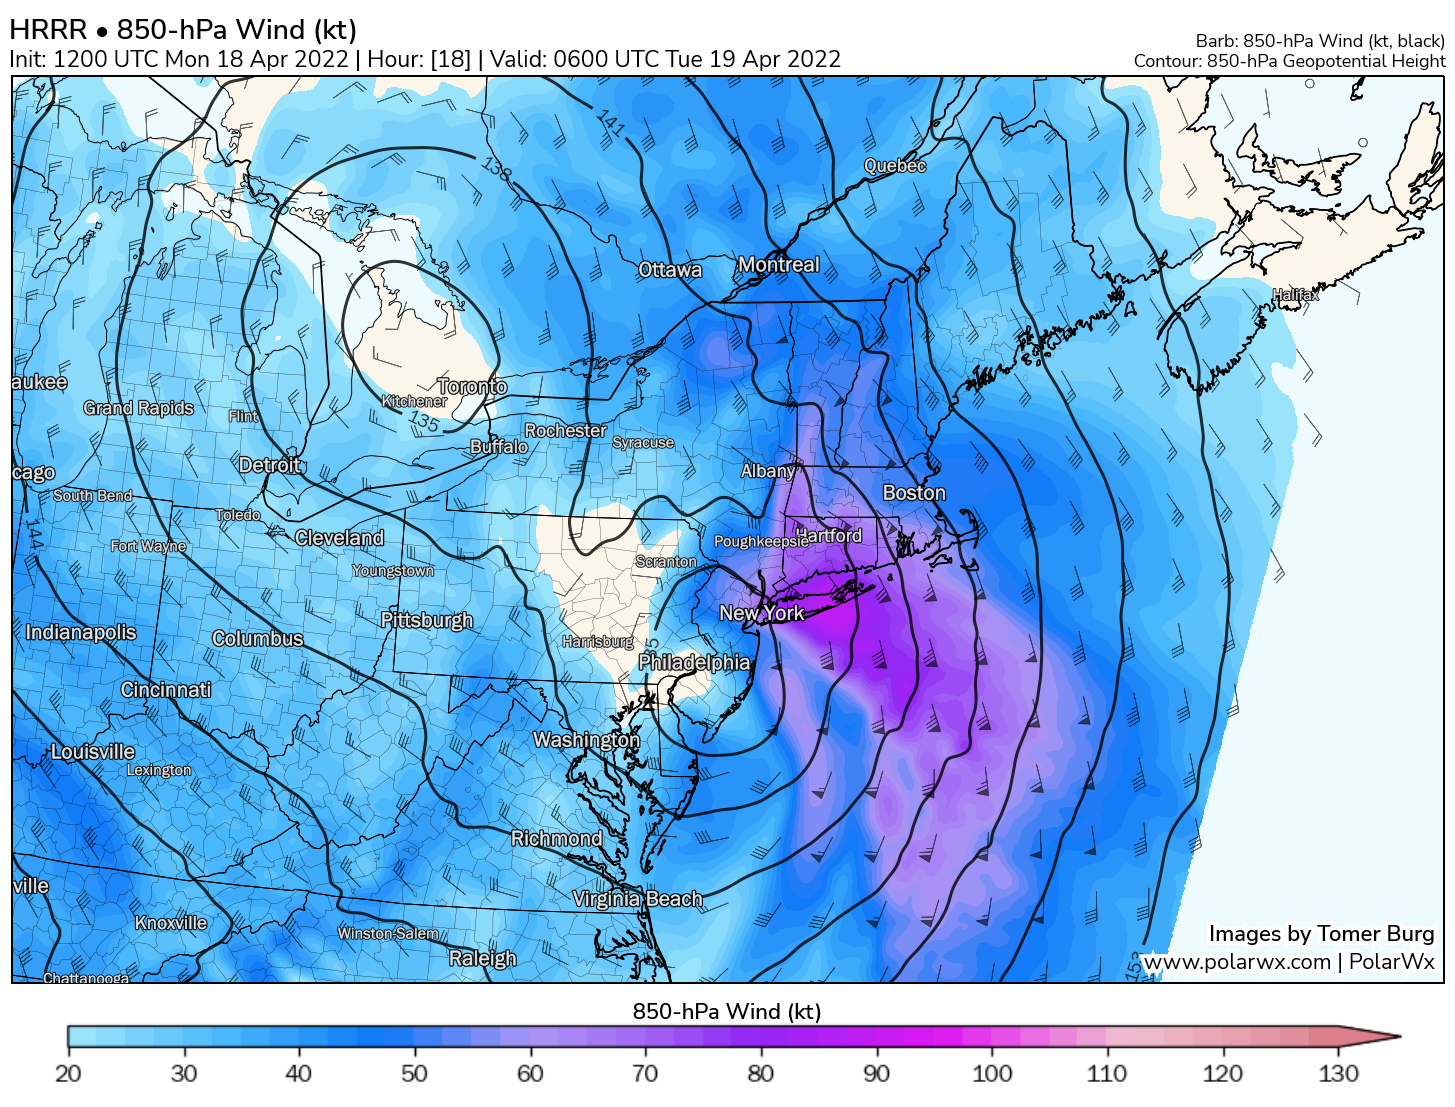 HRRR 850-hPa wind (kt) and geopotential height (dam), valid at 2:00am EDT Tuesday.
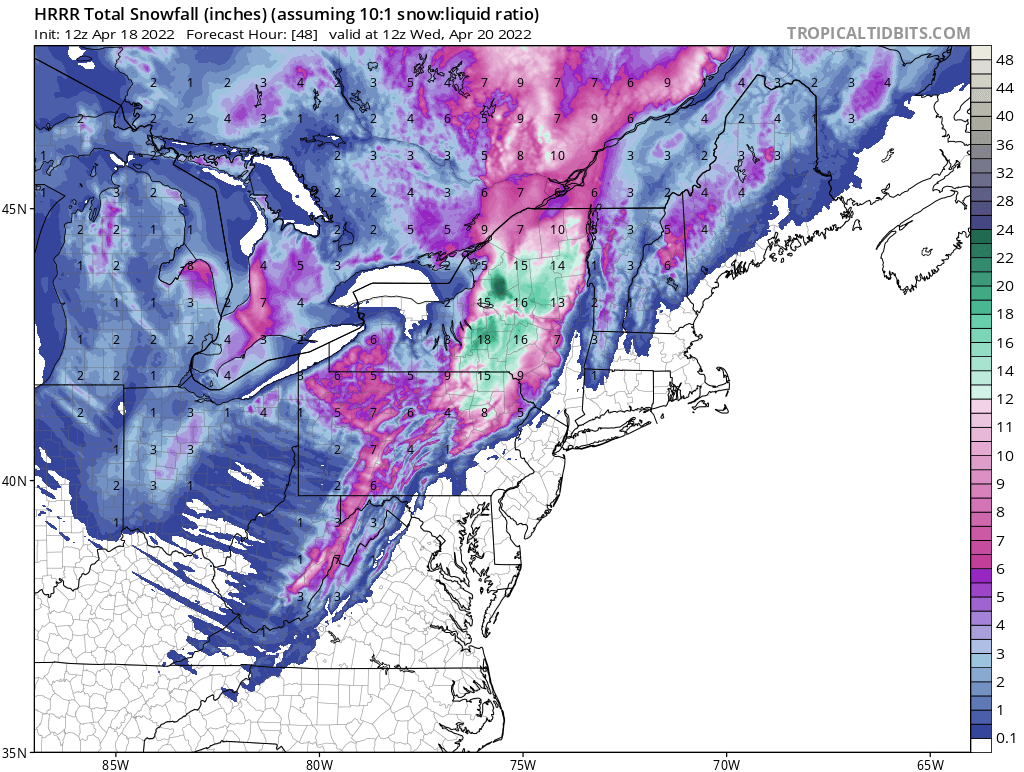 HRRR modeled 10:1 snow to liquid ratio snowfall (inch).
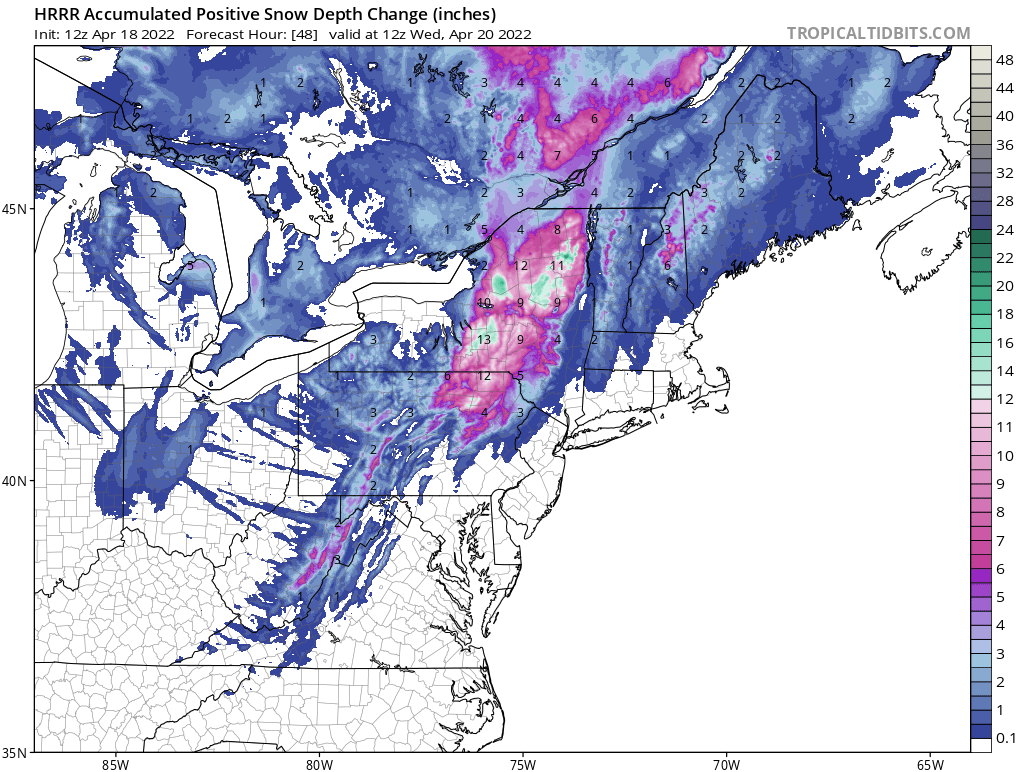 HRRR modeled positive snow depth change (inch).
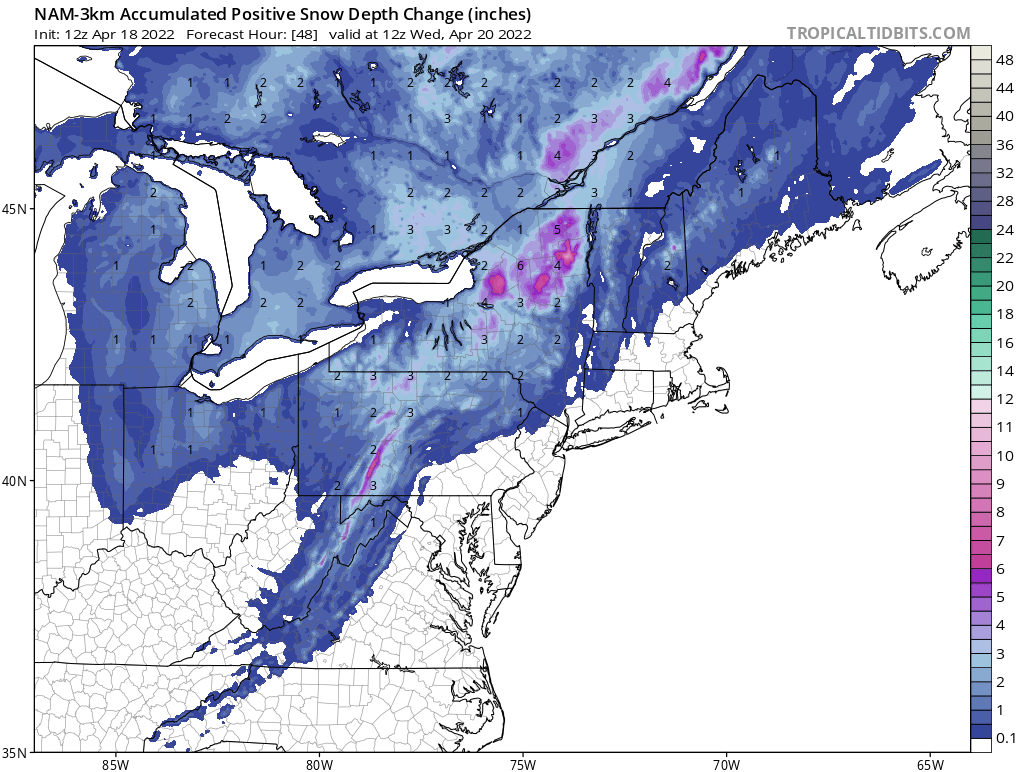 3km NAM nest modeled positive snow depth change (inch).