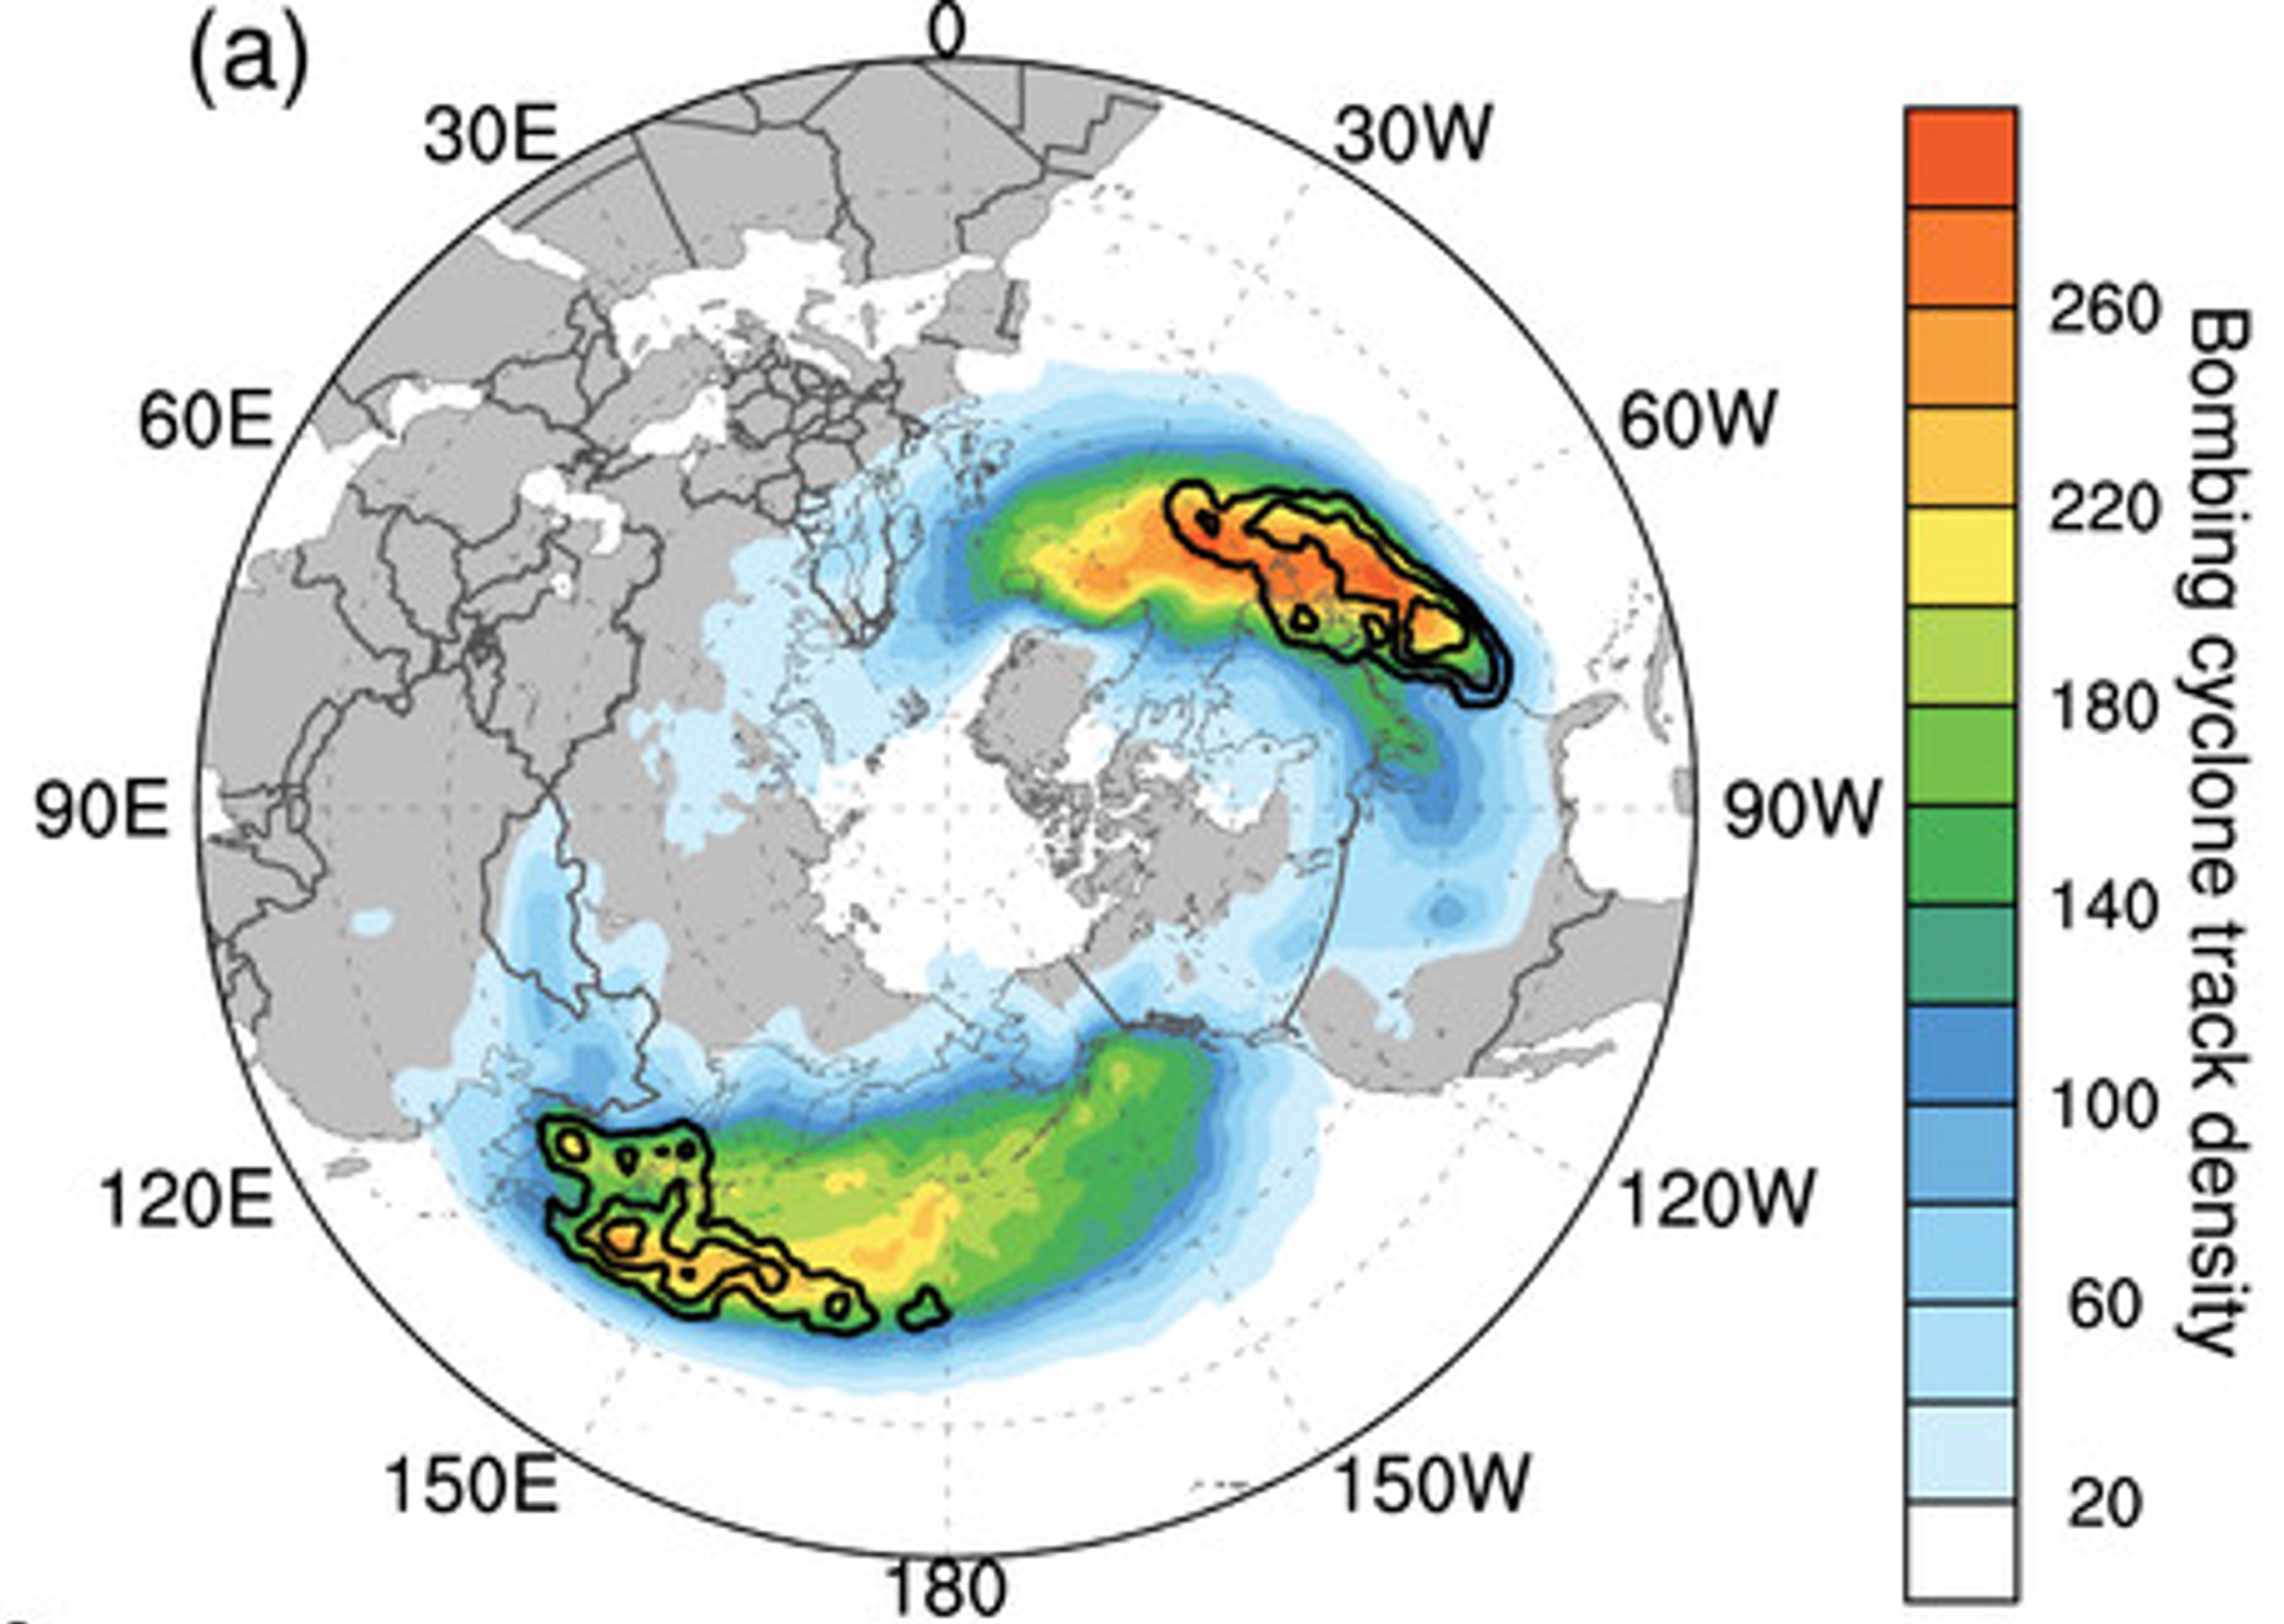
Bomb Cyclone climatology from Attard and Lang (2019).
There's numerous reasons why bomb cyclones are most common in these two regions, which will be the subject of a future blog post. But the takeaway point is that bomb cyclone frequency actually decreases in higher latitudes the further north one goes! This suggests that there is room for opportunity for improving the definition of anomalous cyclone deepening.
At the time of Sanders and Gyakum (1980), the recent addition of global satellite data and the relative infancy of numerical analyses and modeling made for challenges in creating high-quality, long-term cyclone climatologies. Nowadays with much higher resolution reanalyses such as the ERA-5 and much more advanced cyclone tracking techniques and computational abilities, we are able to analyze much more data than in the past.
How can we use these improvements to optimize the definition of a bomb cyclone? I'm not sure there is a single right answer to this question, and there could easily be multiple approaches. One such potential would be to create a gridpoint based climatology of cyclone deepening rates, and derive the percentile rank of a cyclone's deepening rate relative to all historical cyclones within a neighboring radius and within a surrounding time frame to account for seasonality differences in cyclone intensity climatology.
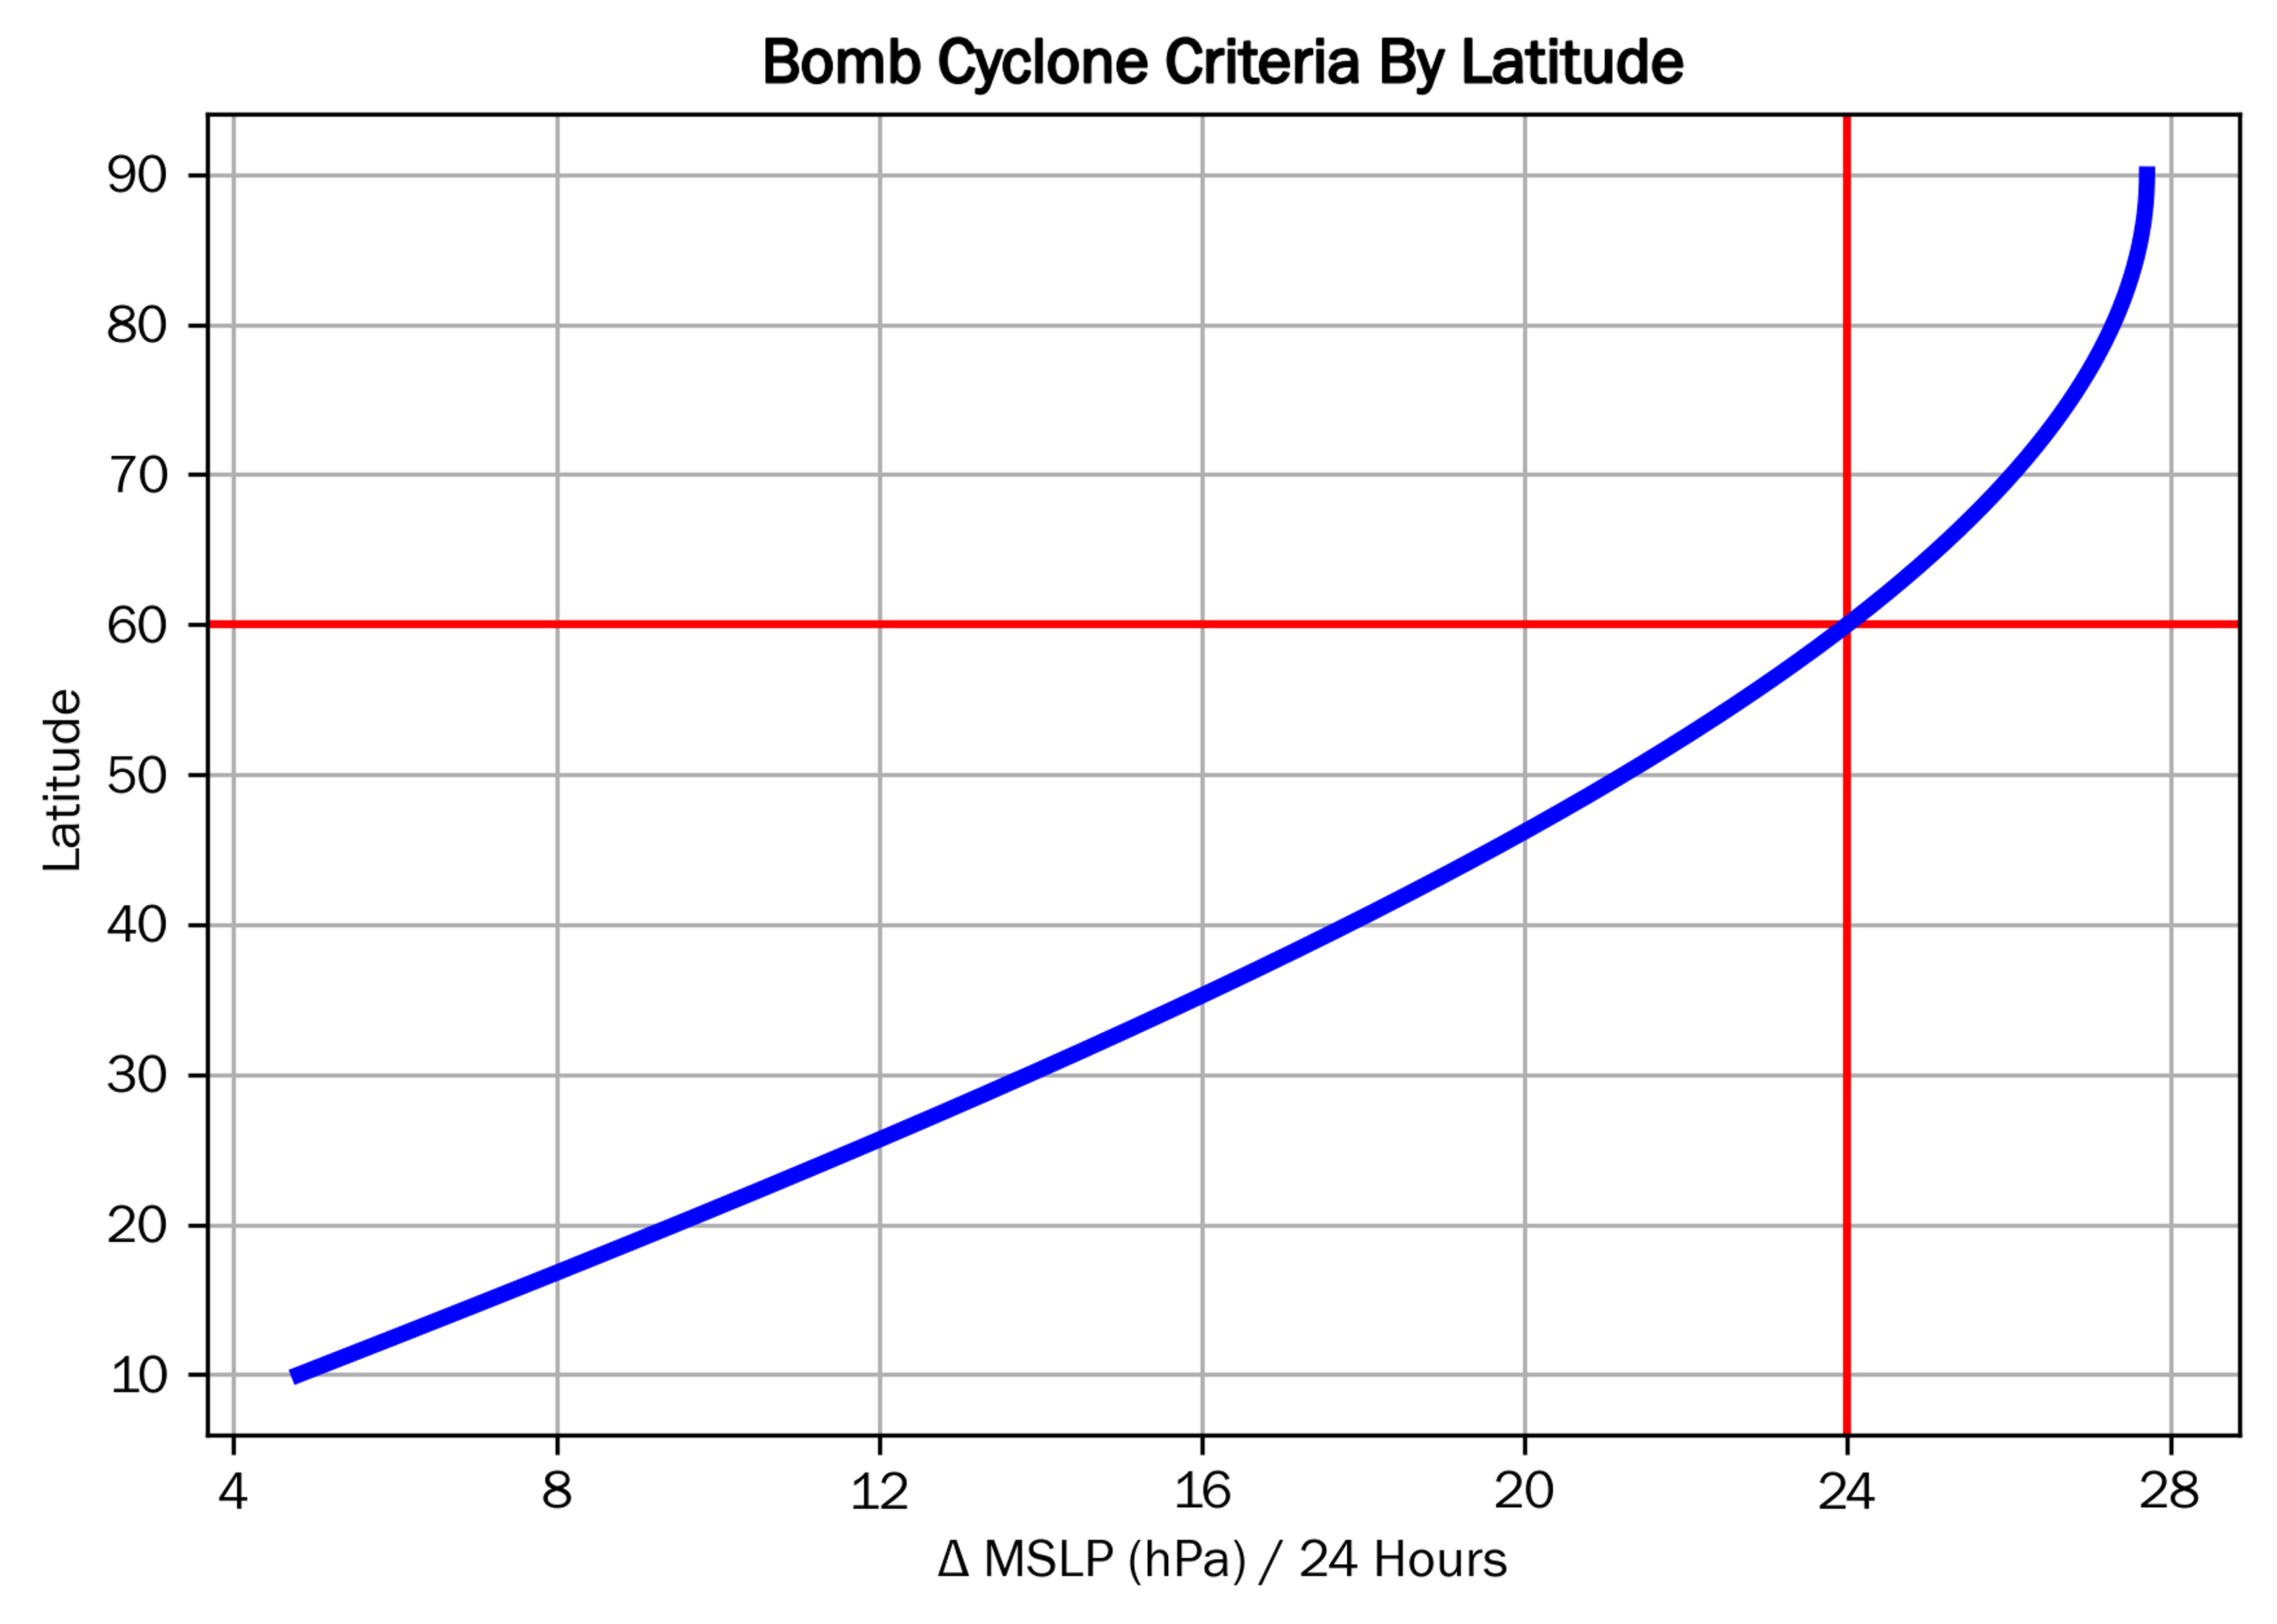
It may not be as simple to calculate and remember as 24 hPa / 24 hours, but it may ultimately yield a more accurate answer for just how unusual a cyclone is relative to climatology.
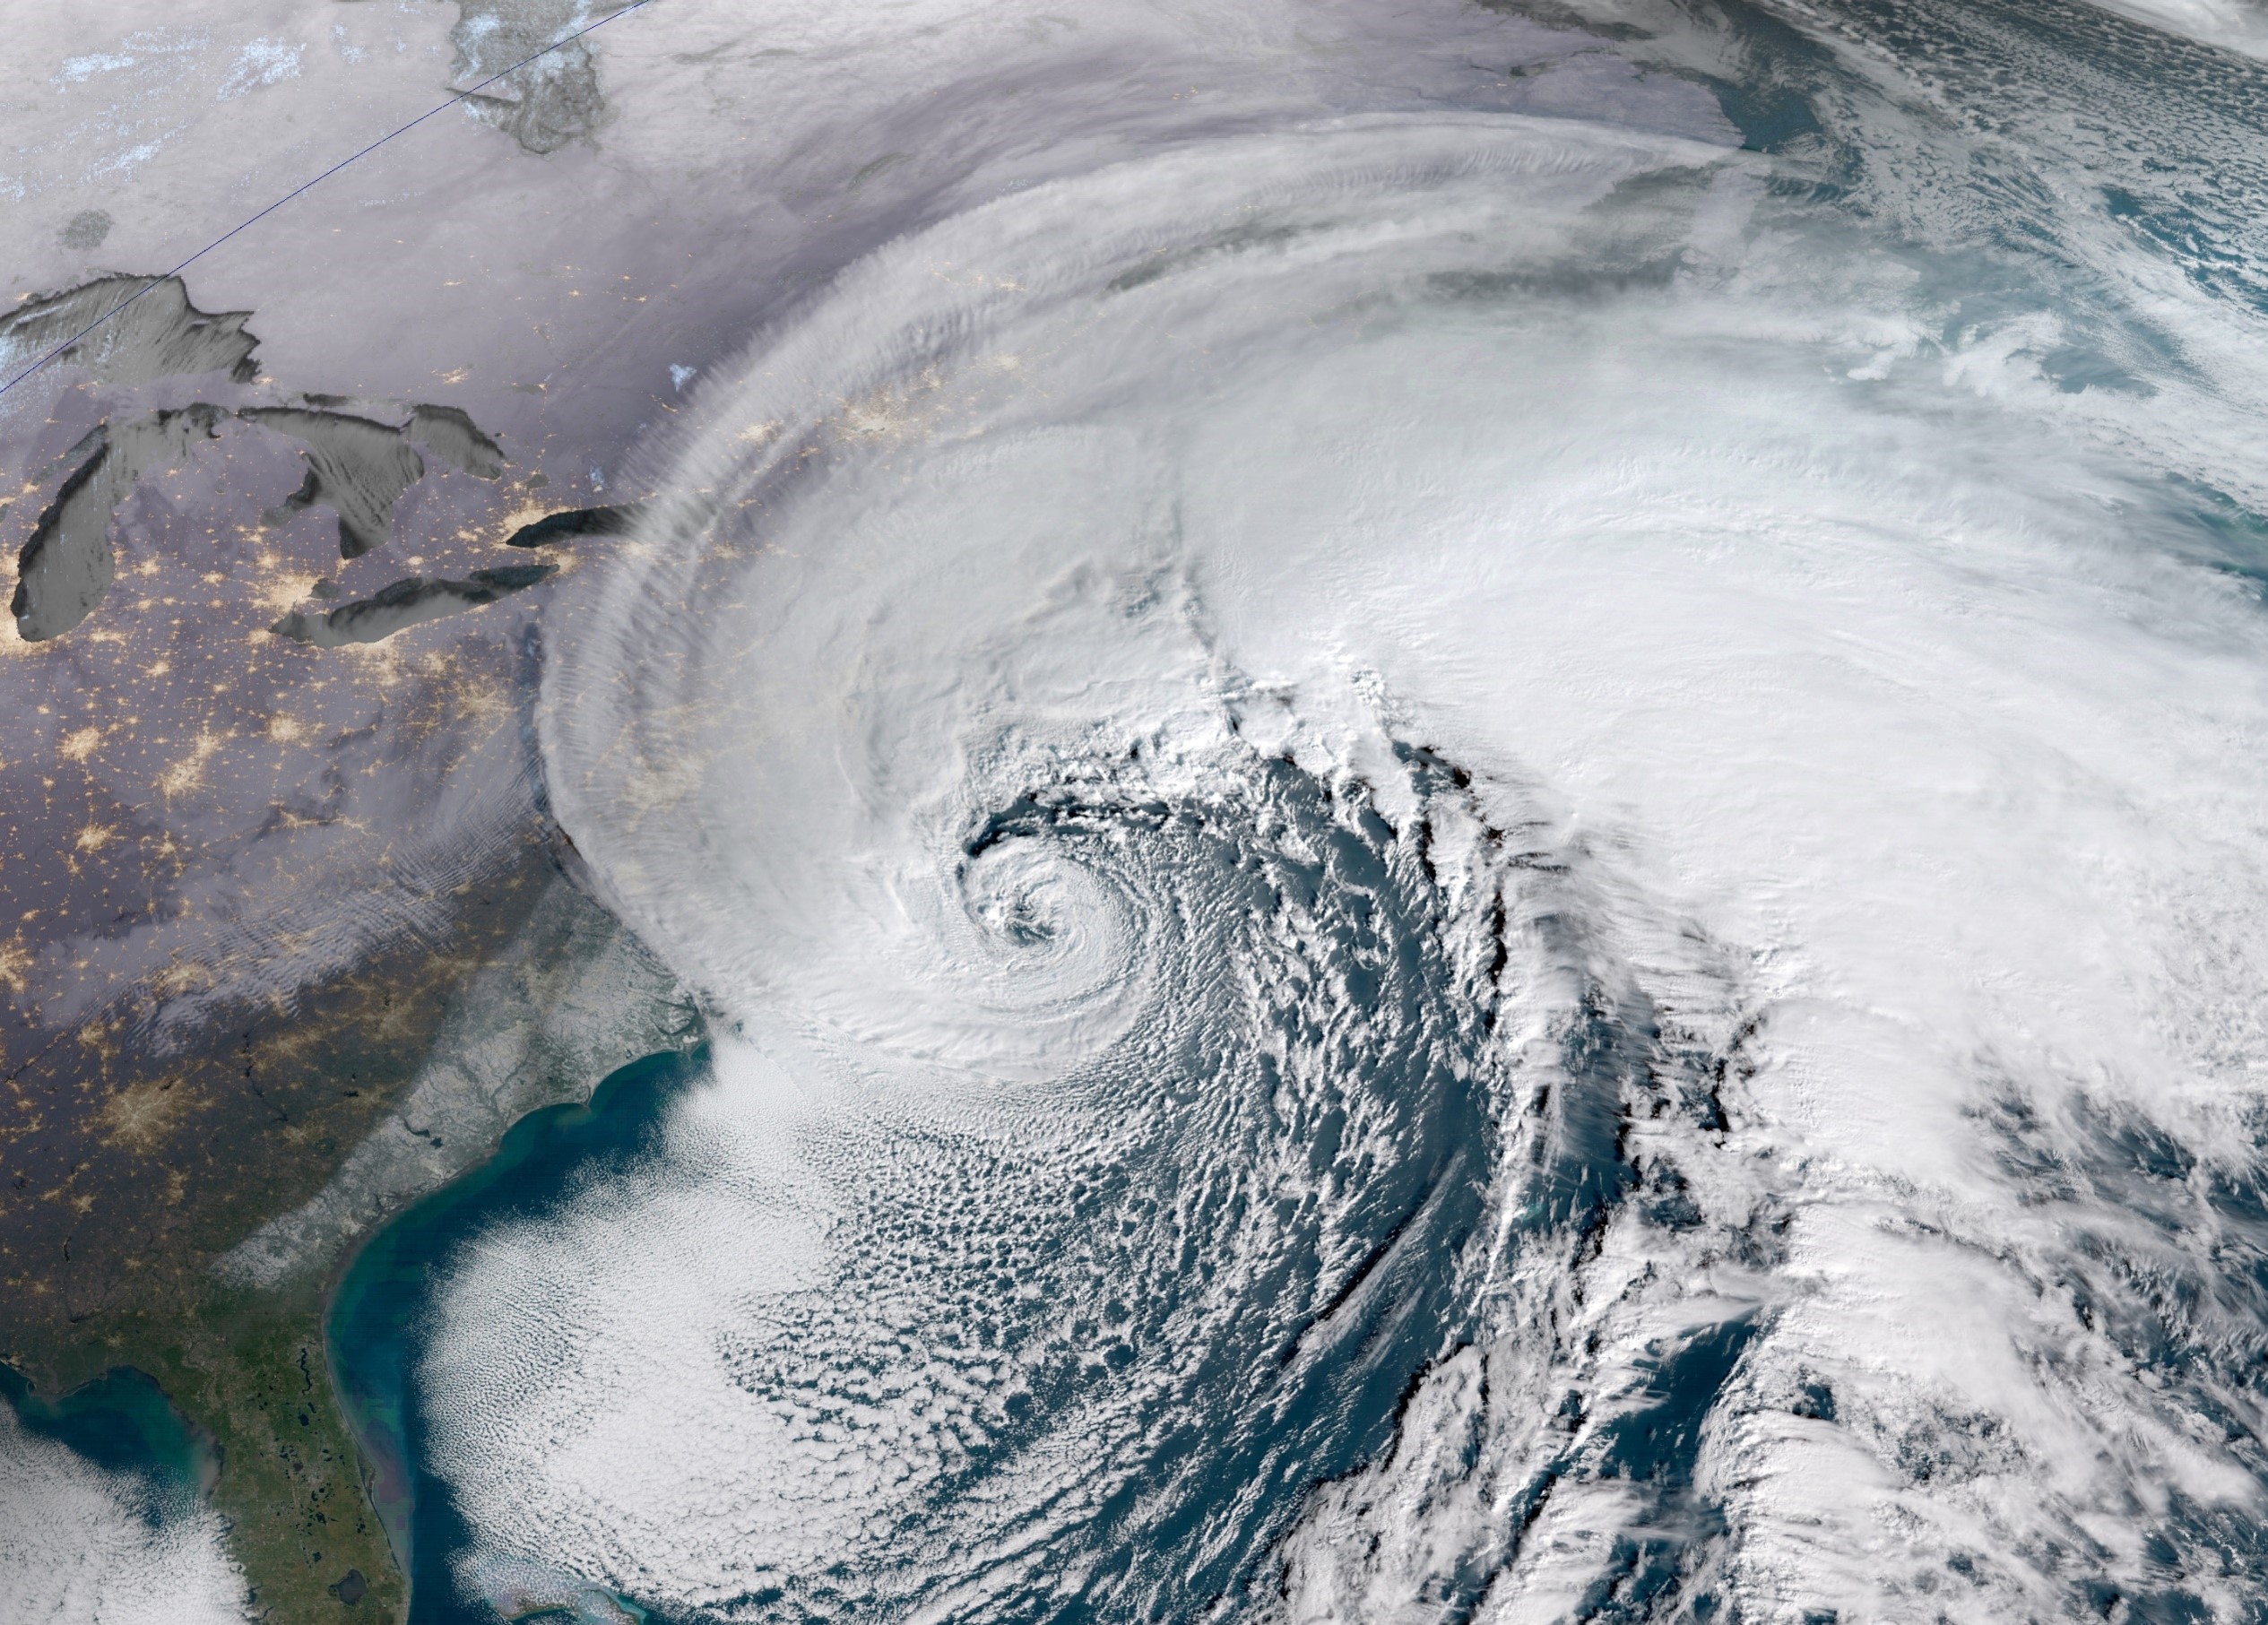 2018 Bomb Cyclone satellite image, courtesy NOAA.