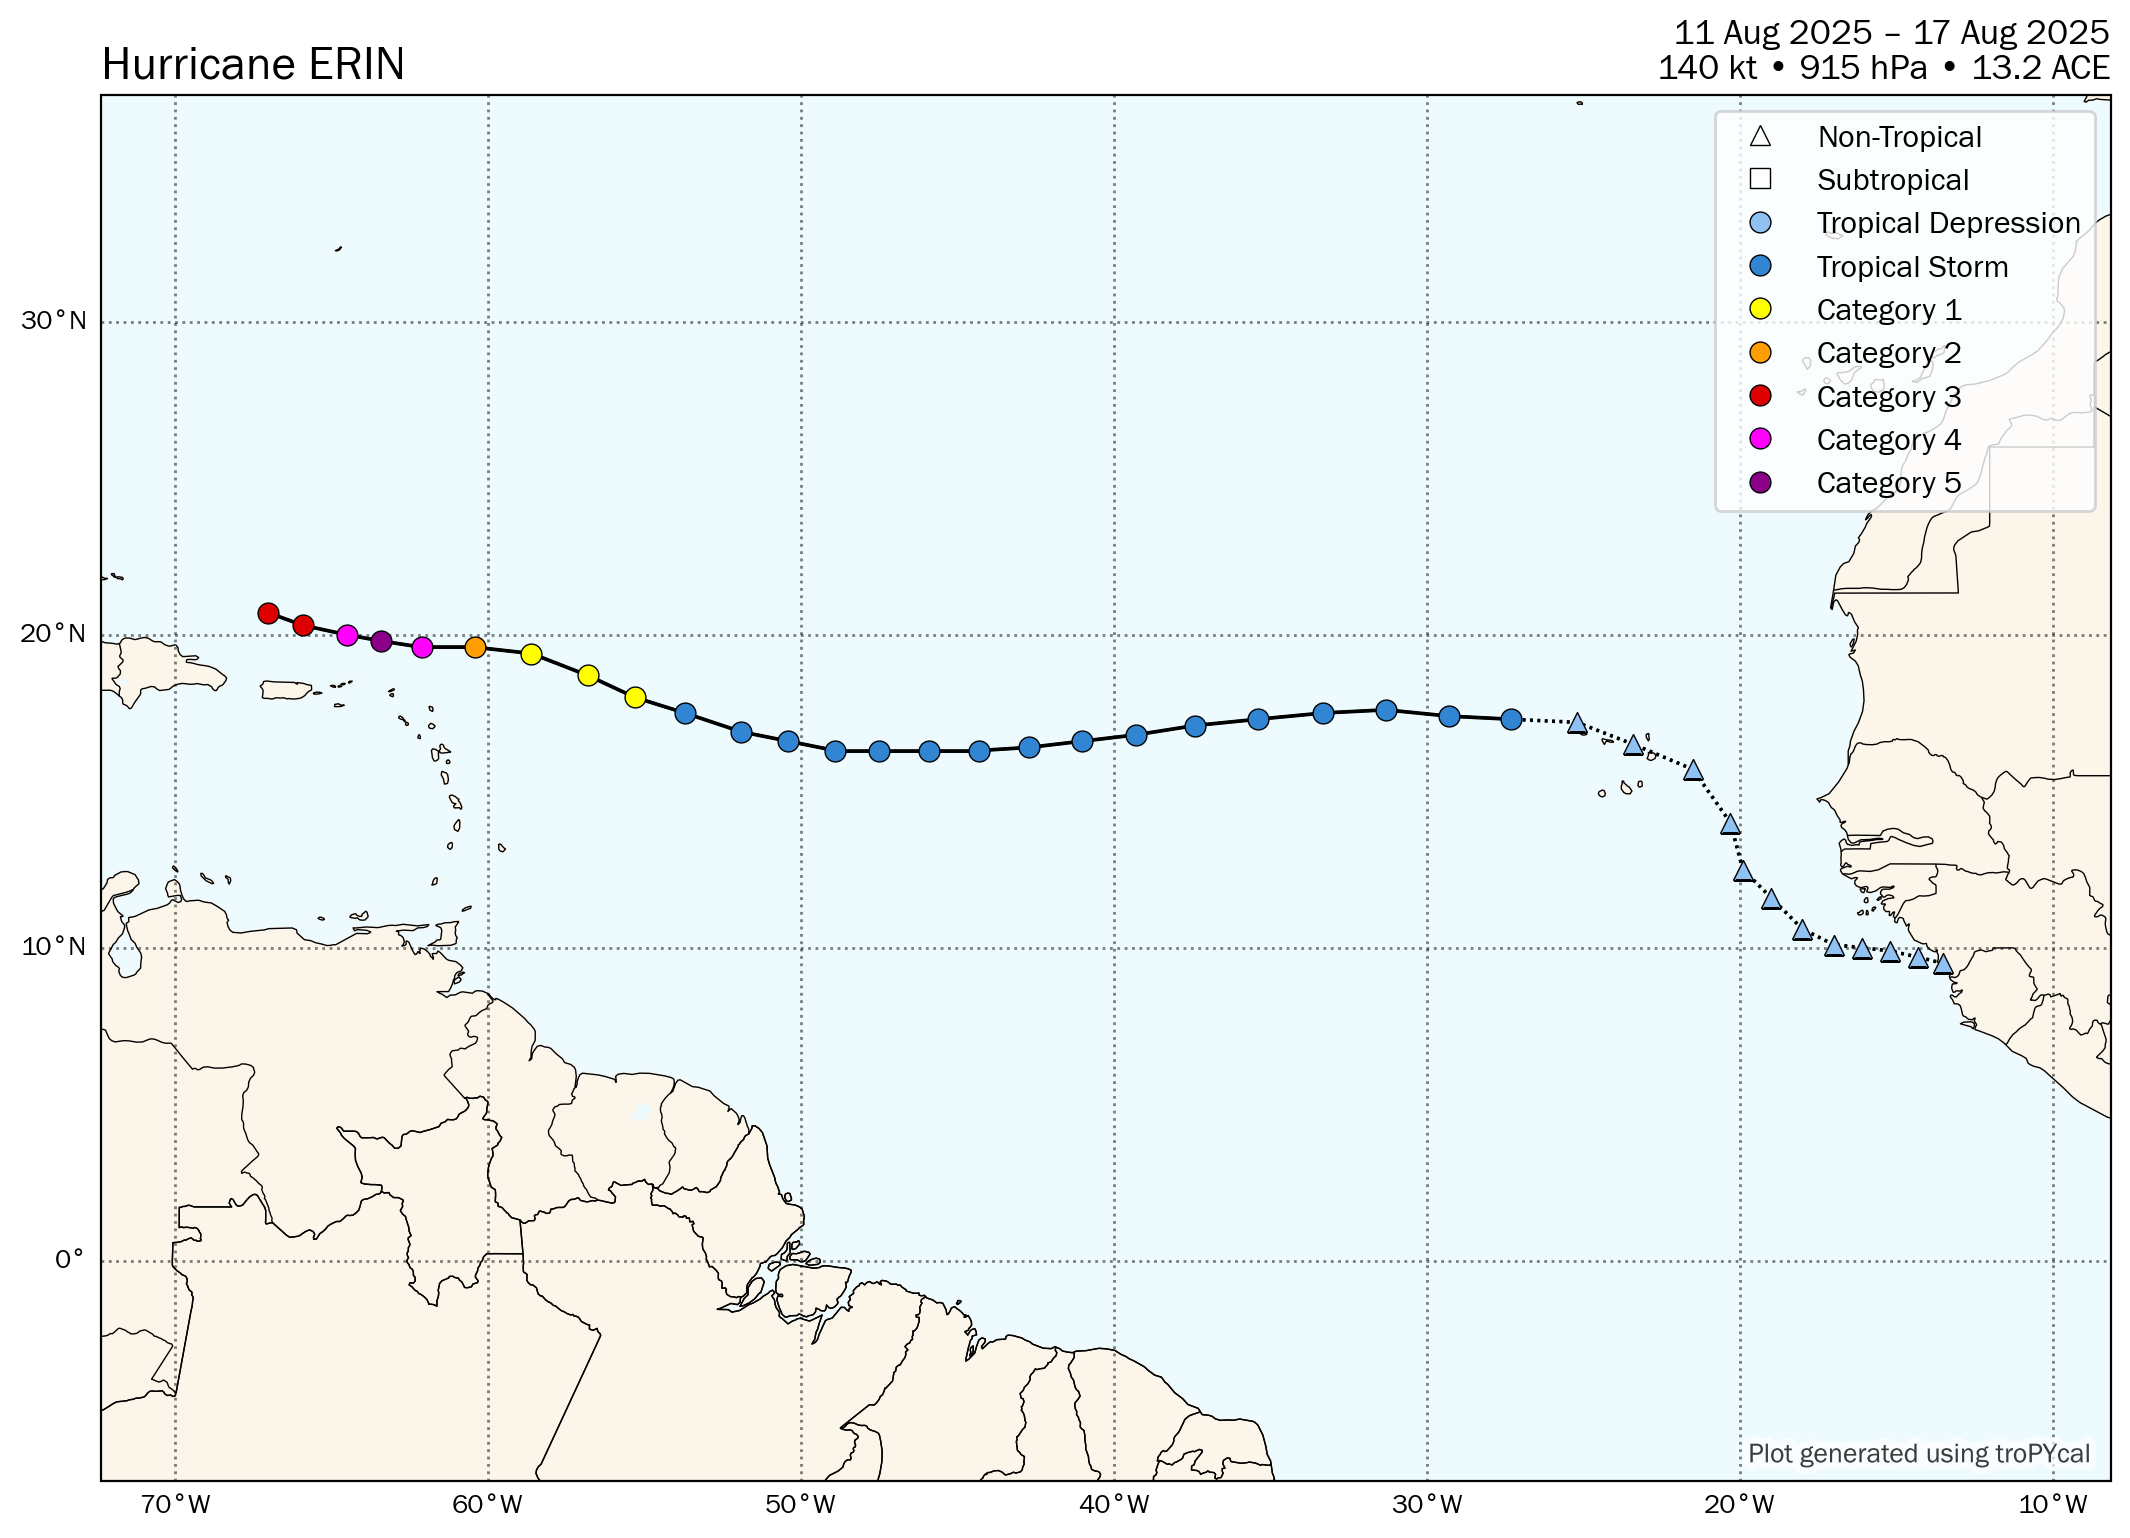
Hurricane Erin
Latest Update
•
0300 UTC 22 August 2025
Active Tropical Cyclones
Active Invests
Forecast Graphic

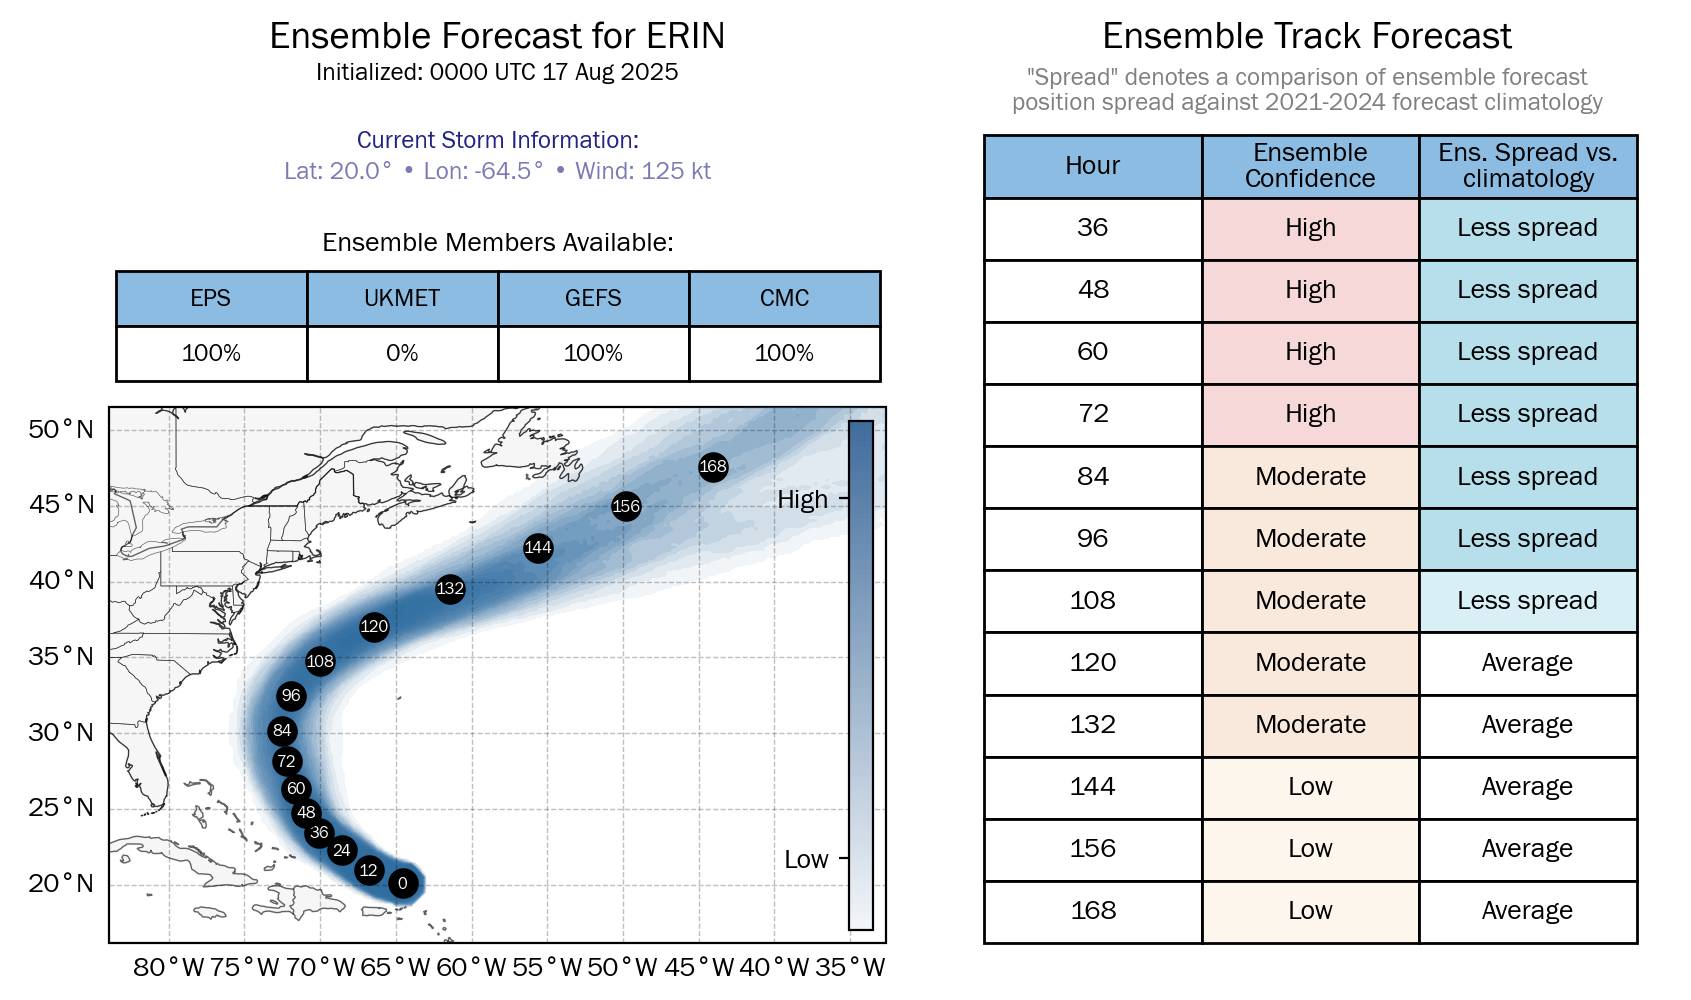
Forecast Statistics
| Hours | Change | Percentile Rank |
|---|---|---|
| 0–24 hr | –5 kt | ≤ 25th Percentile |
| 12–36 hr | –5 kt | Normal Range |
| 24–48 hr | –10 kt | ≤ 25th Percentile |
| 48–72 hr | –5 kt | Normal Range |
| 72–96 hr | –15 kt | ≤ 10th Percentile |
| 96–120 hr | –5 kt | Normal Range |
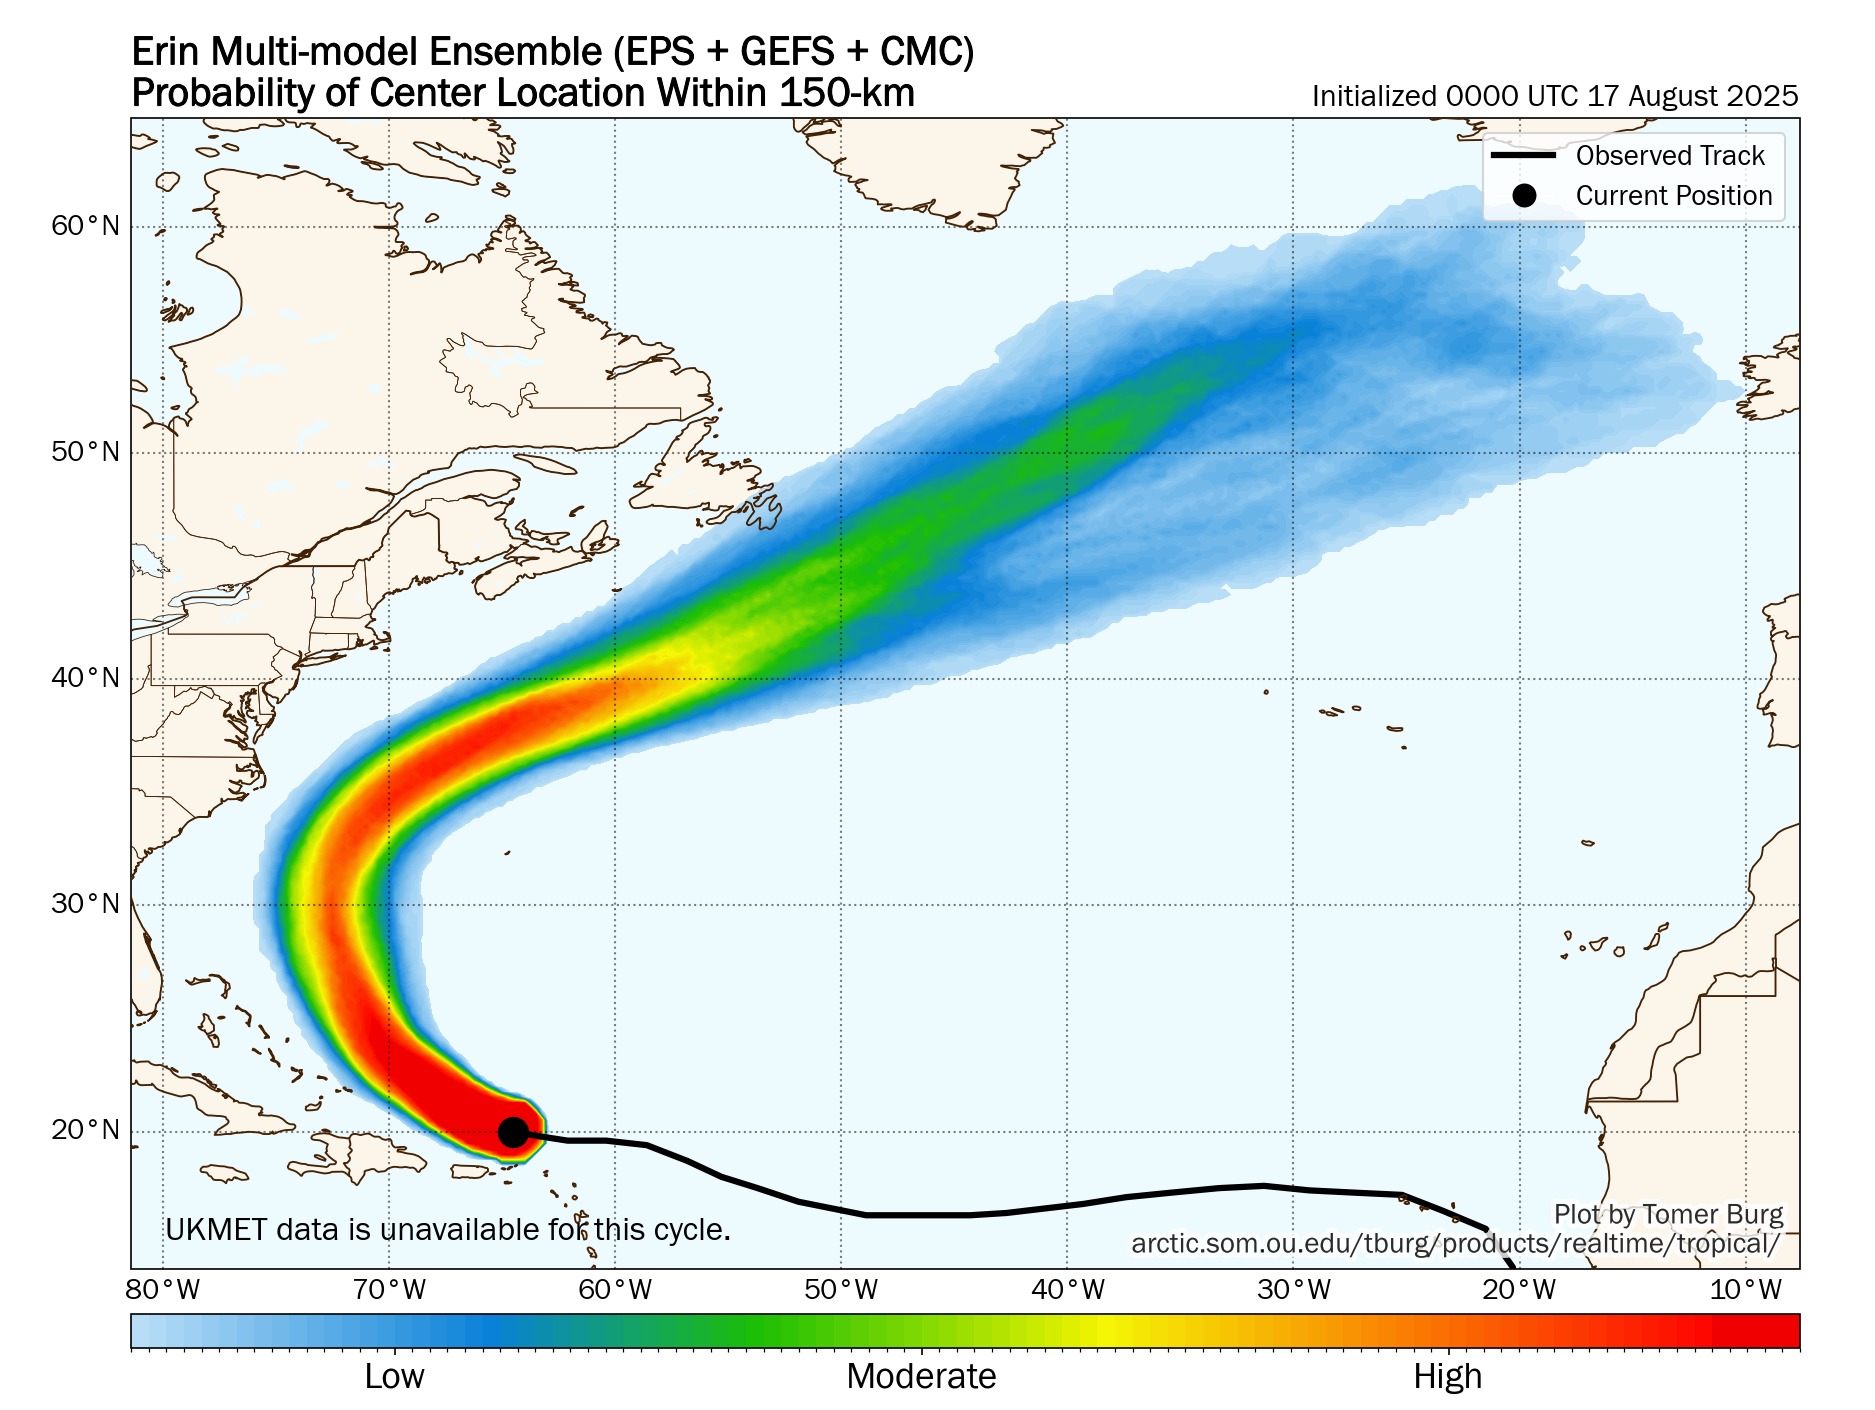
Ensemble Viewer (Click image for loop)
Summary Plot
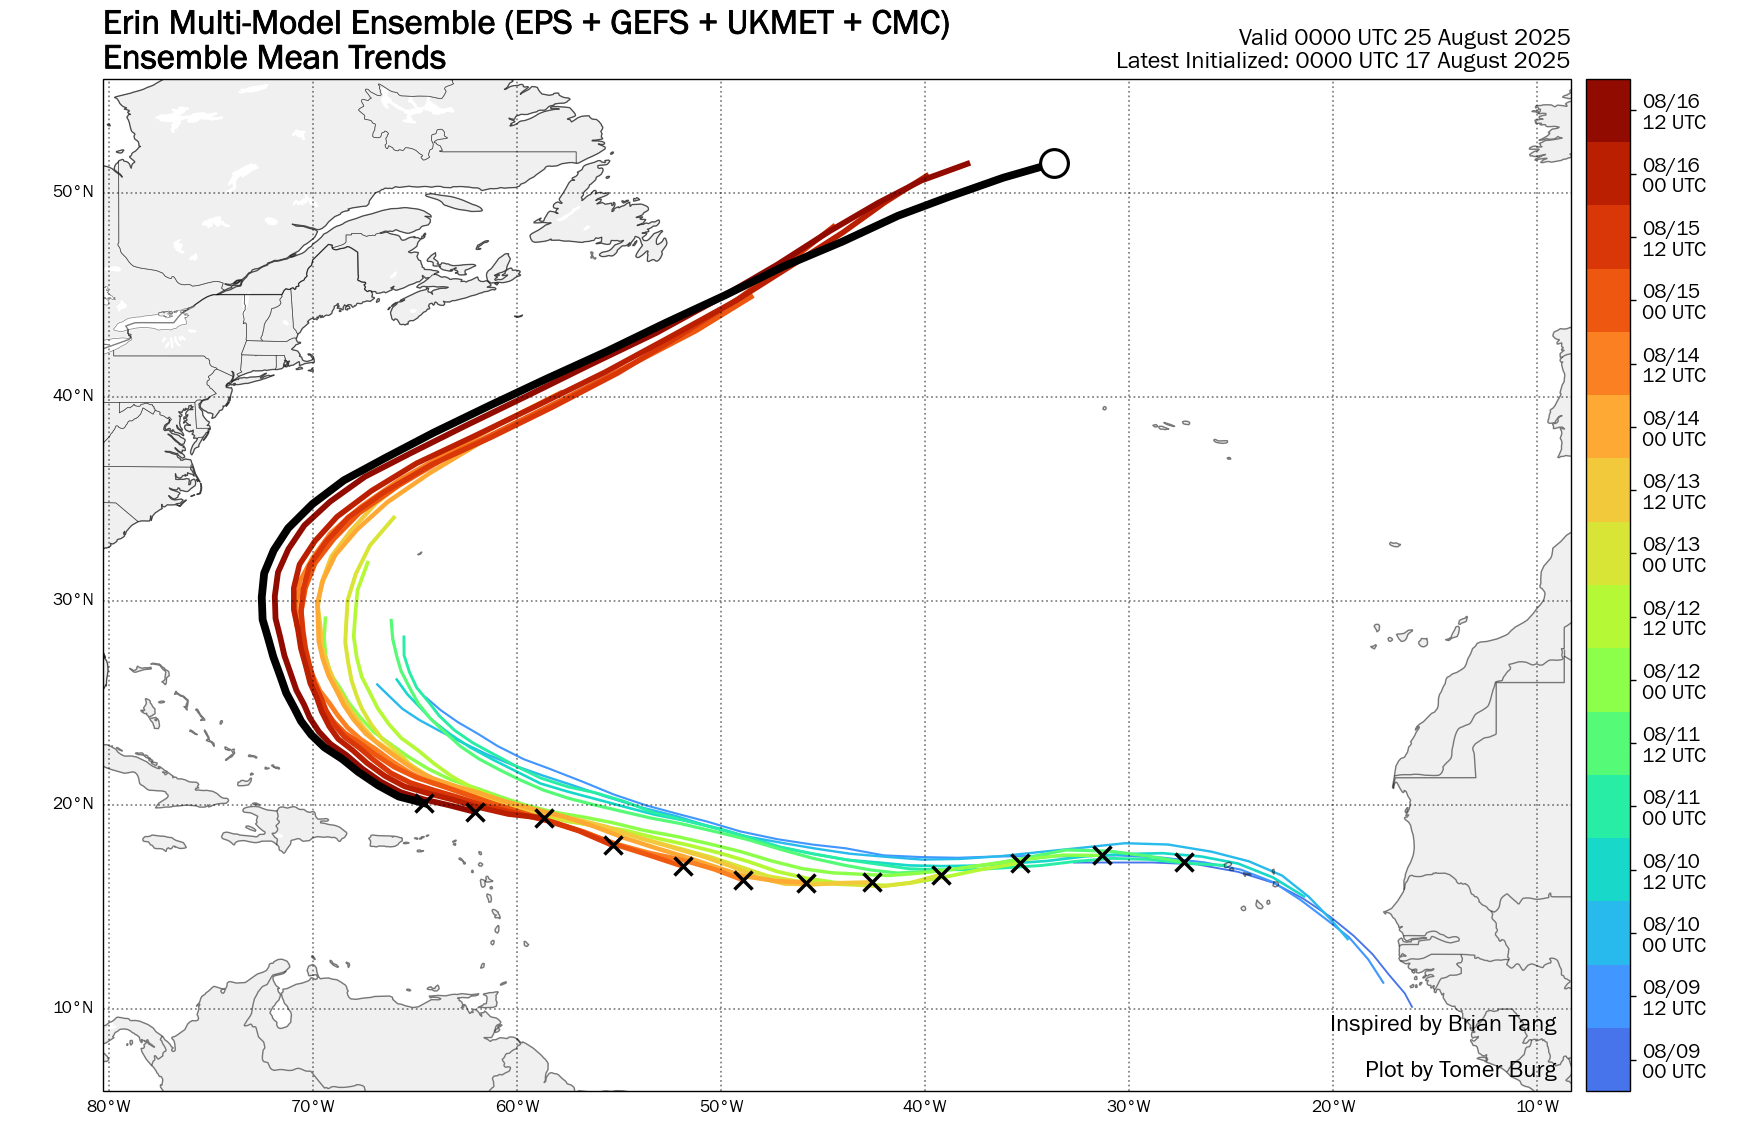
Ensemble Mean Trends
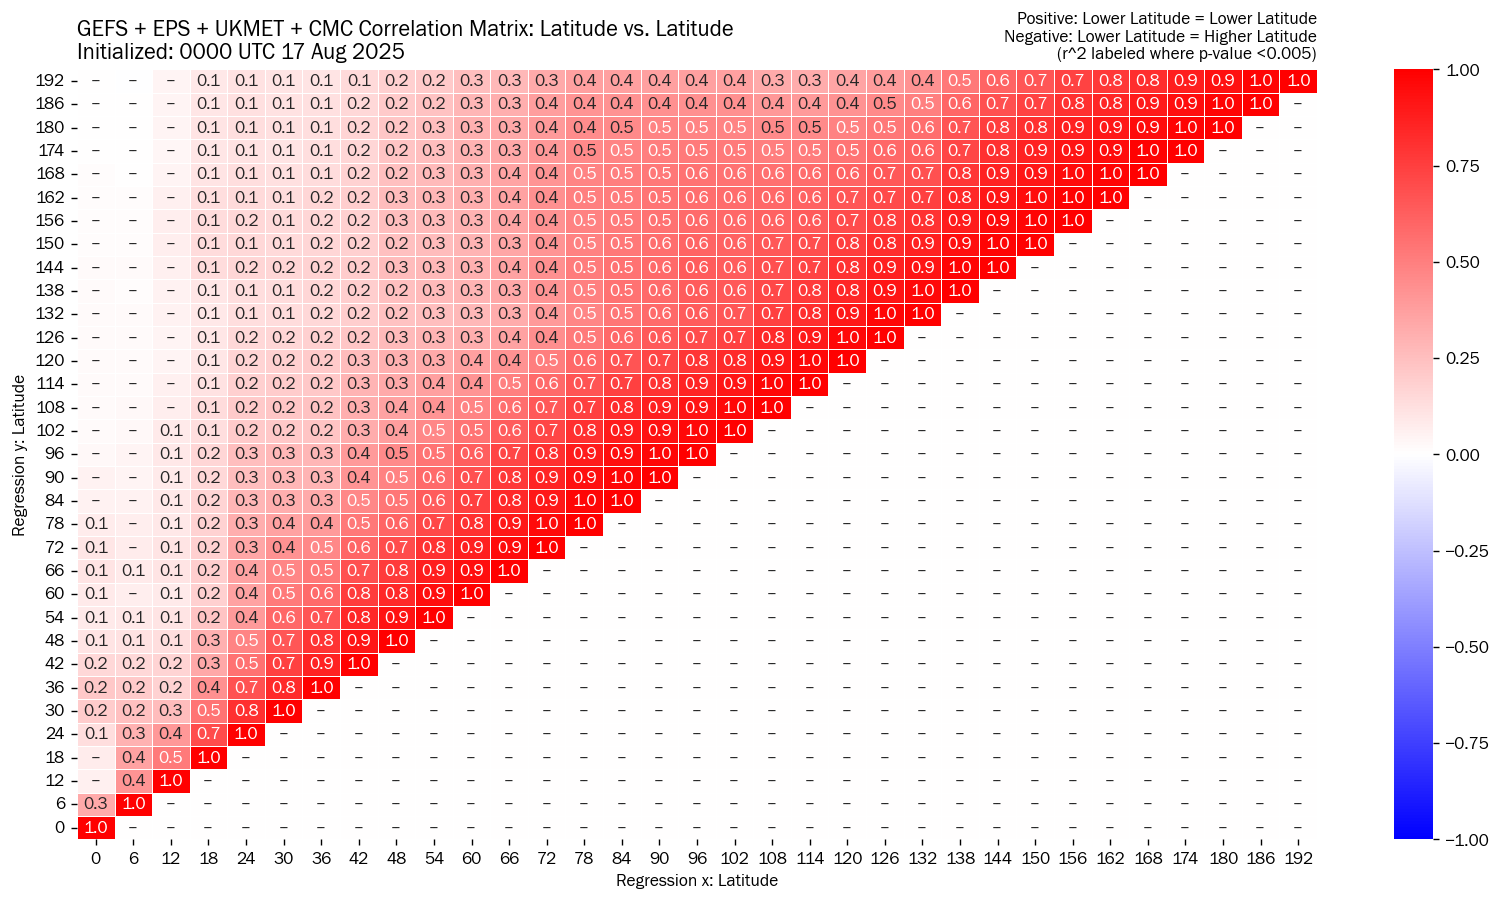
Correlation Matrix (Click image for more)
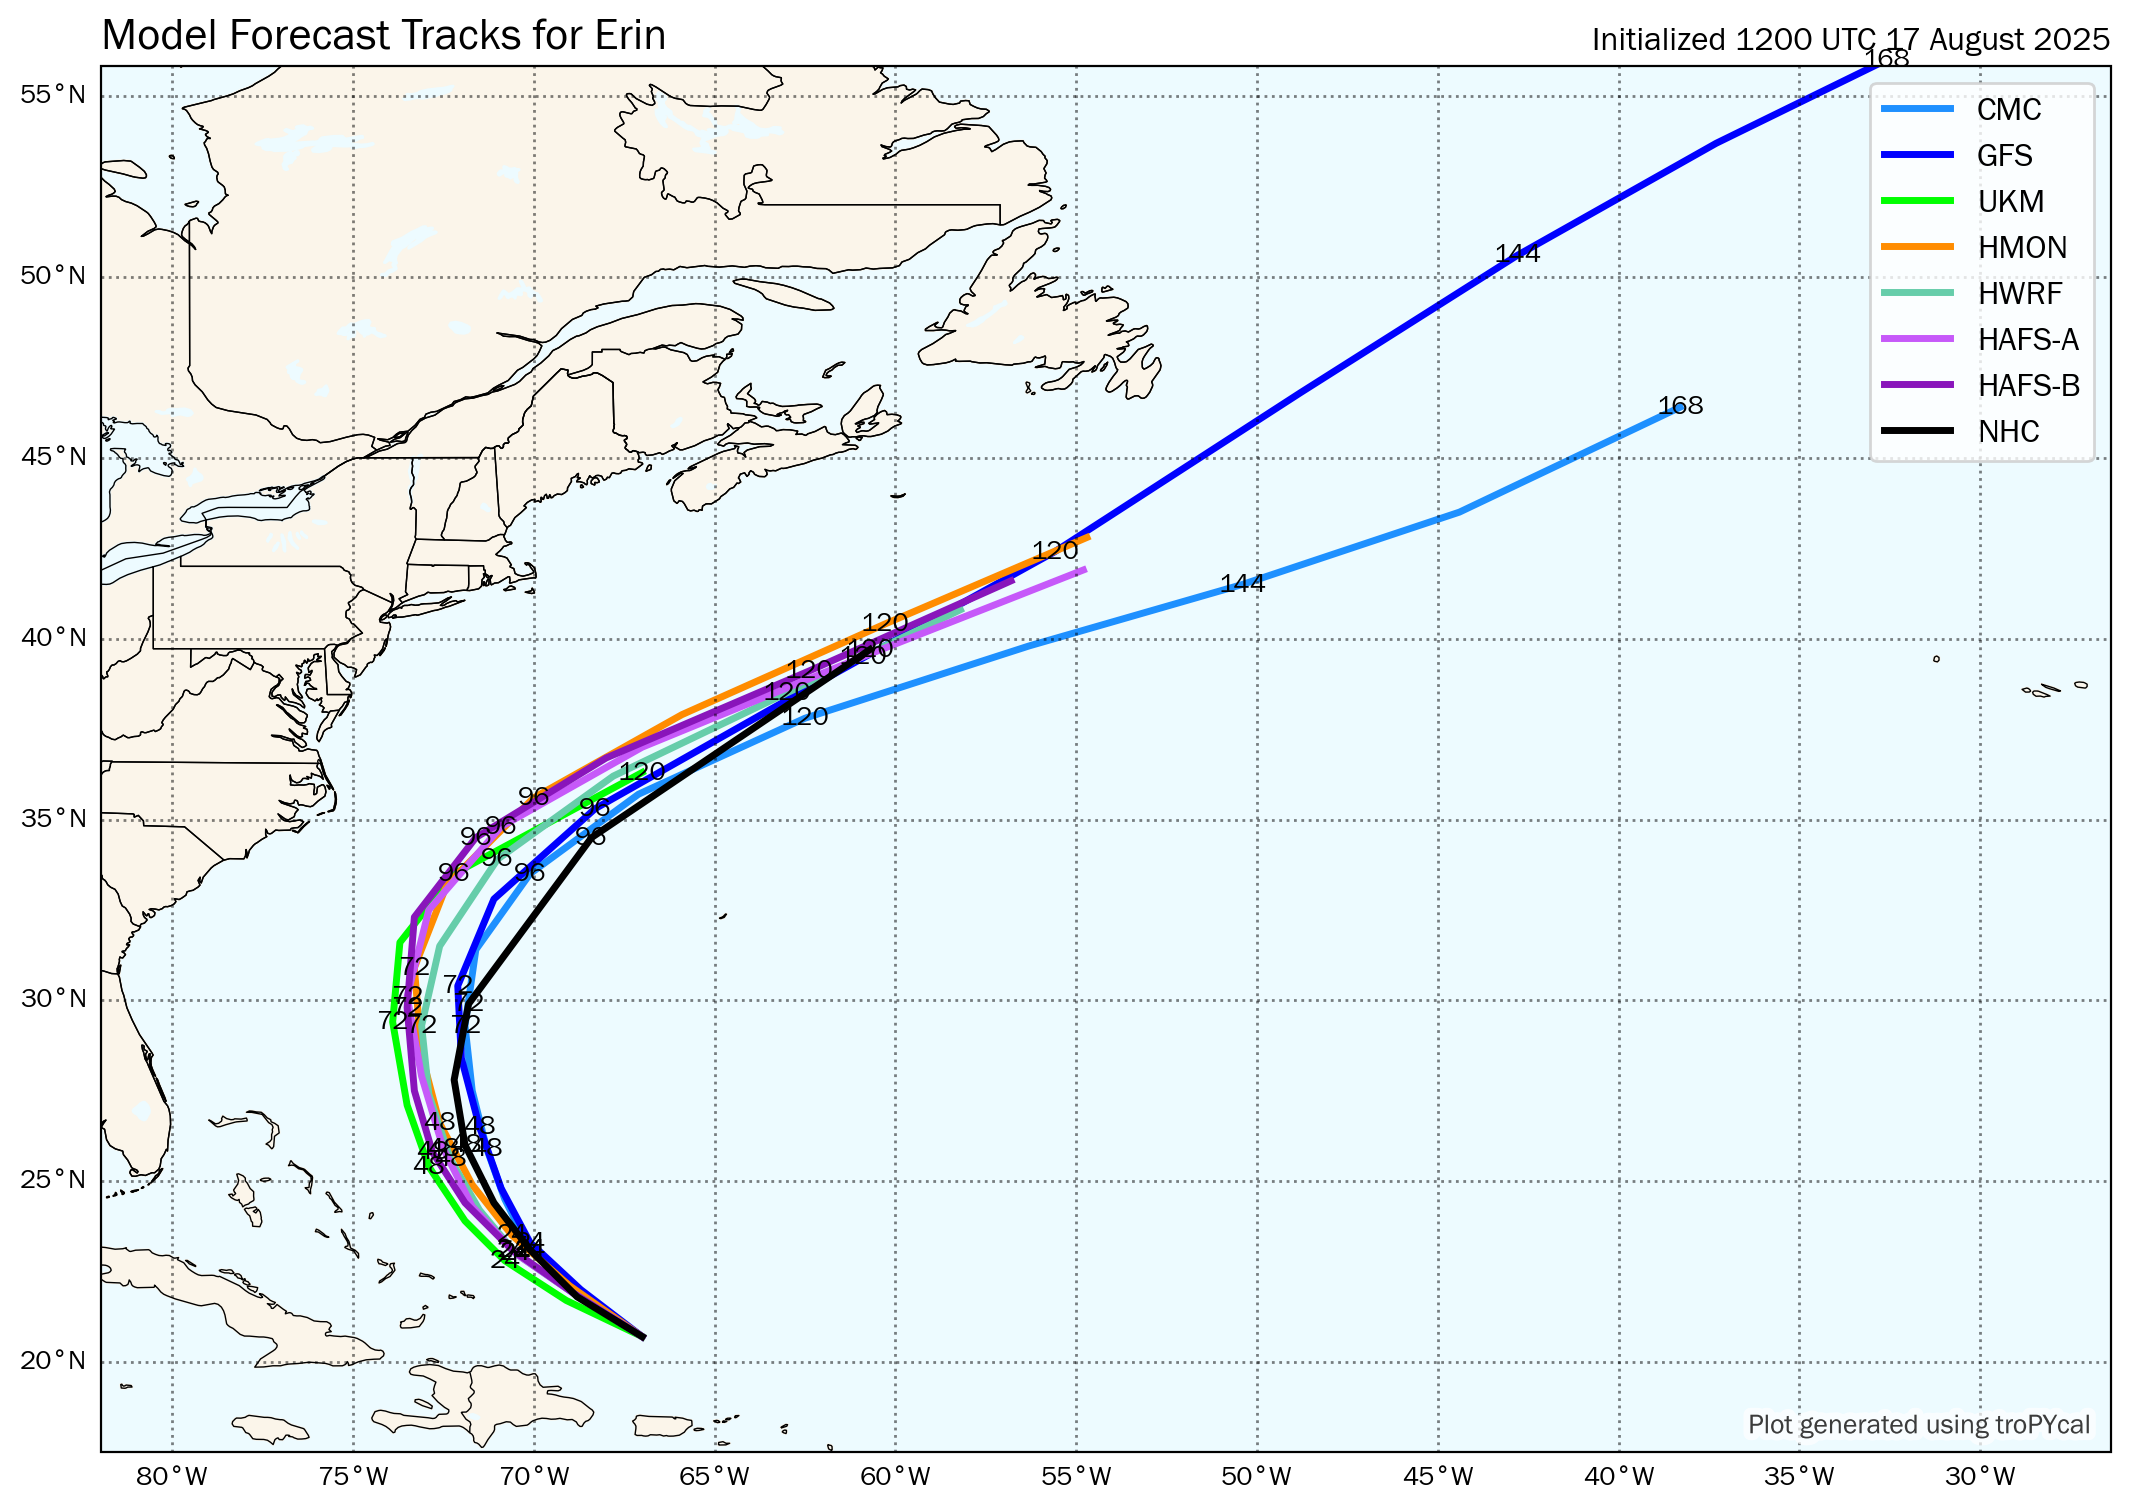
Model Tracks
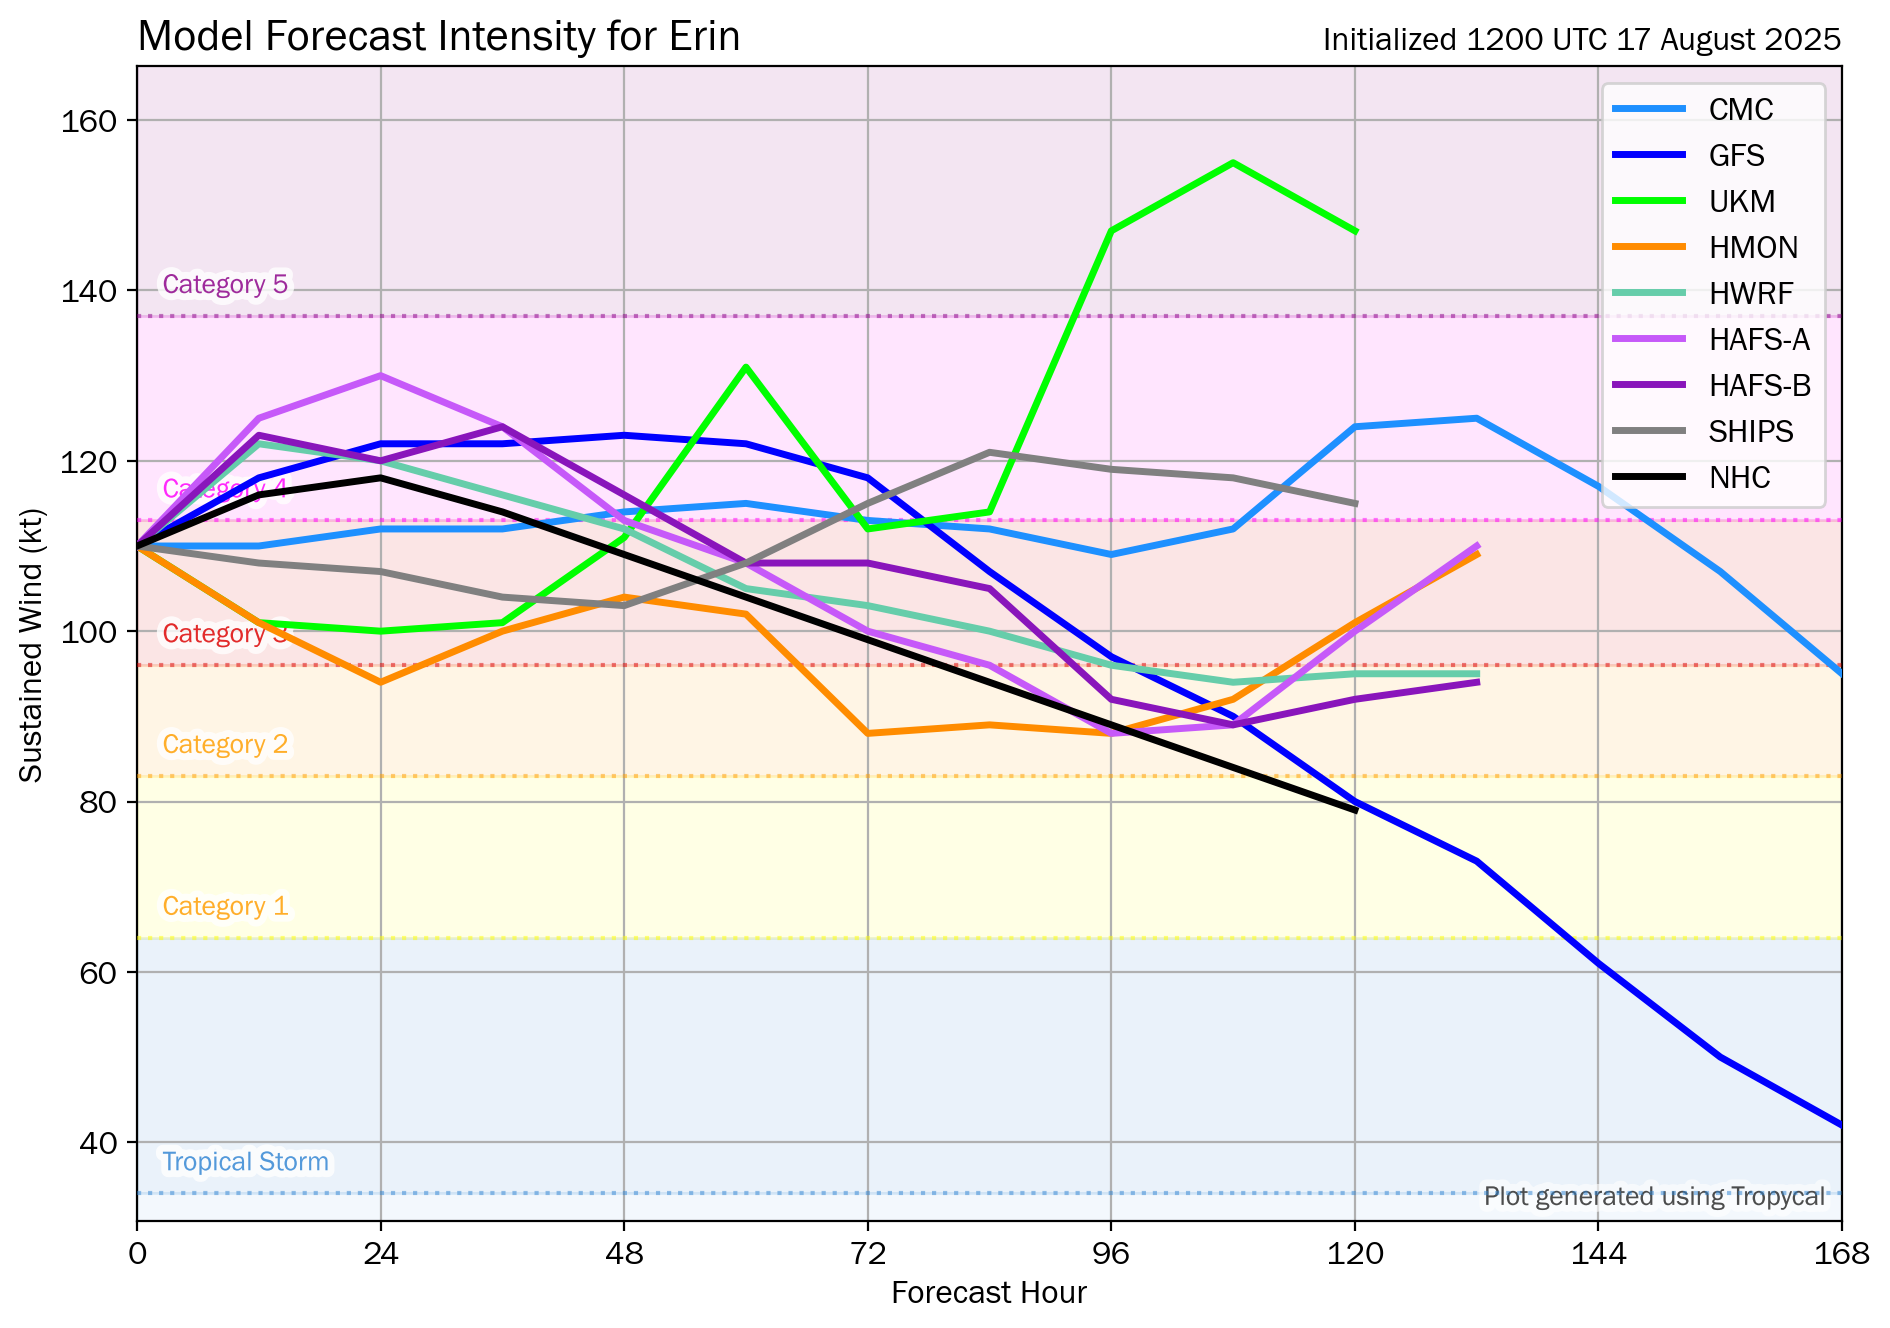
Model Intensity
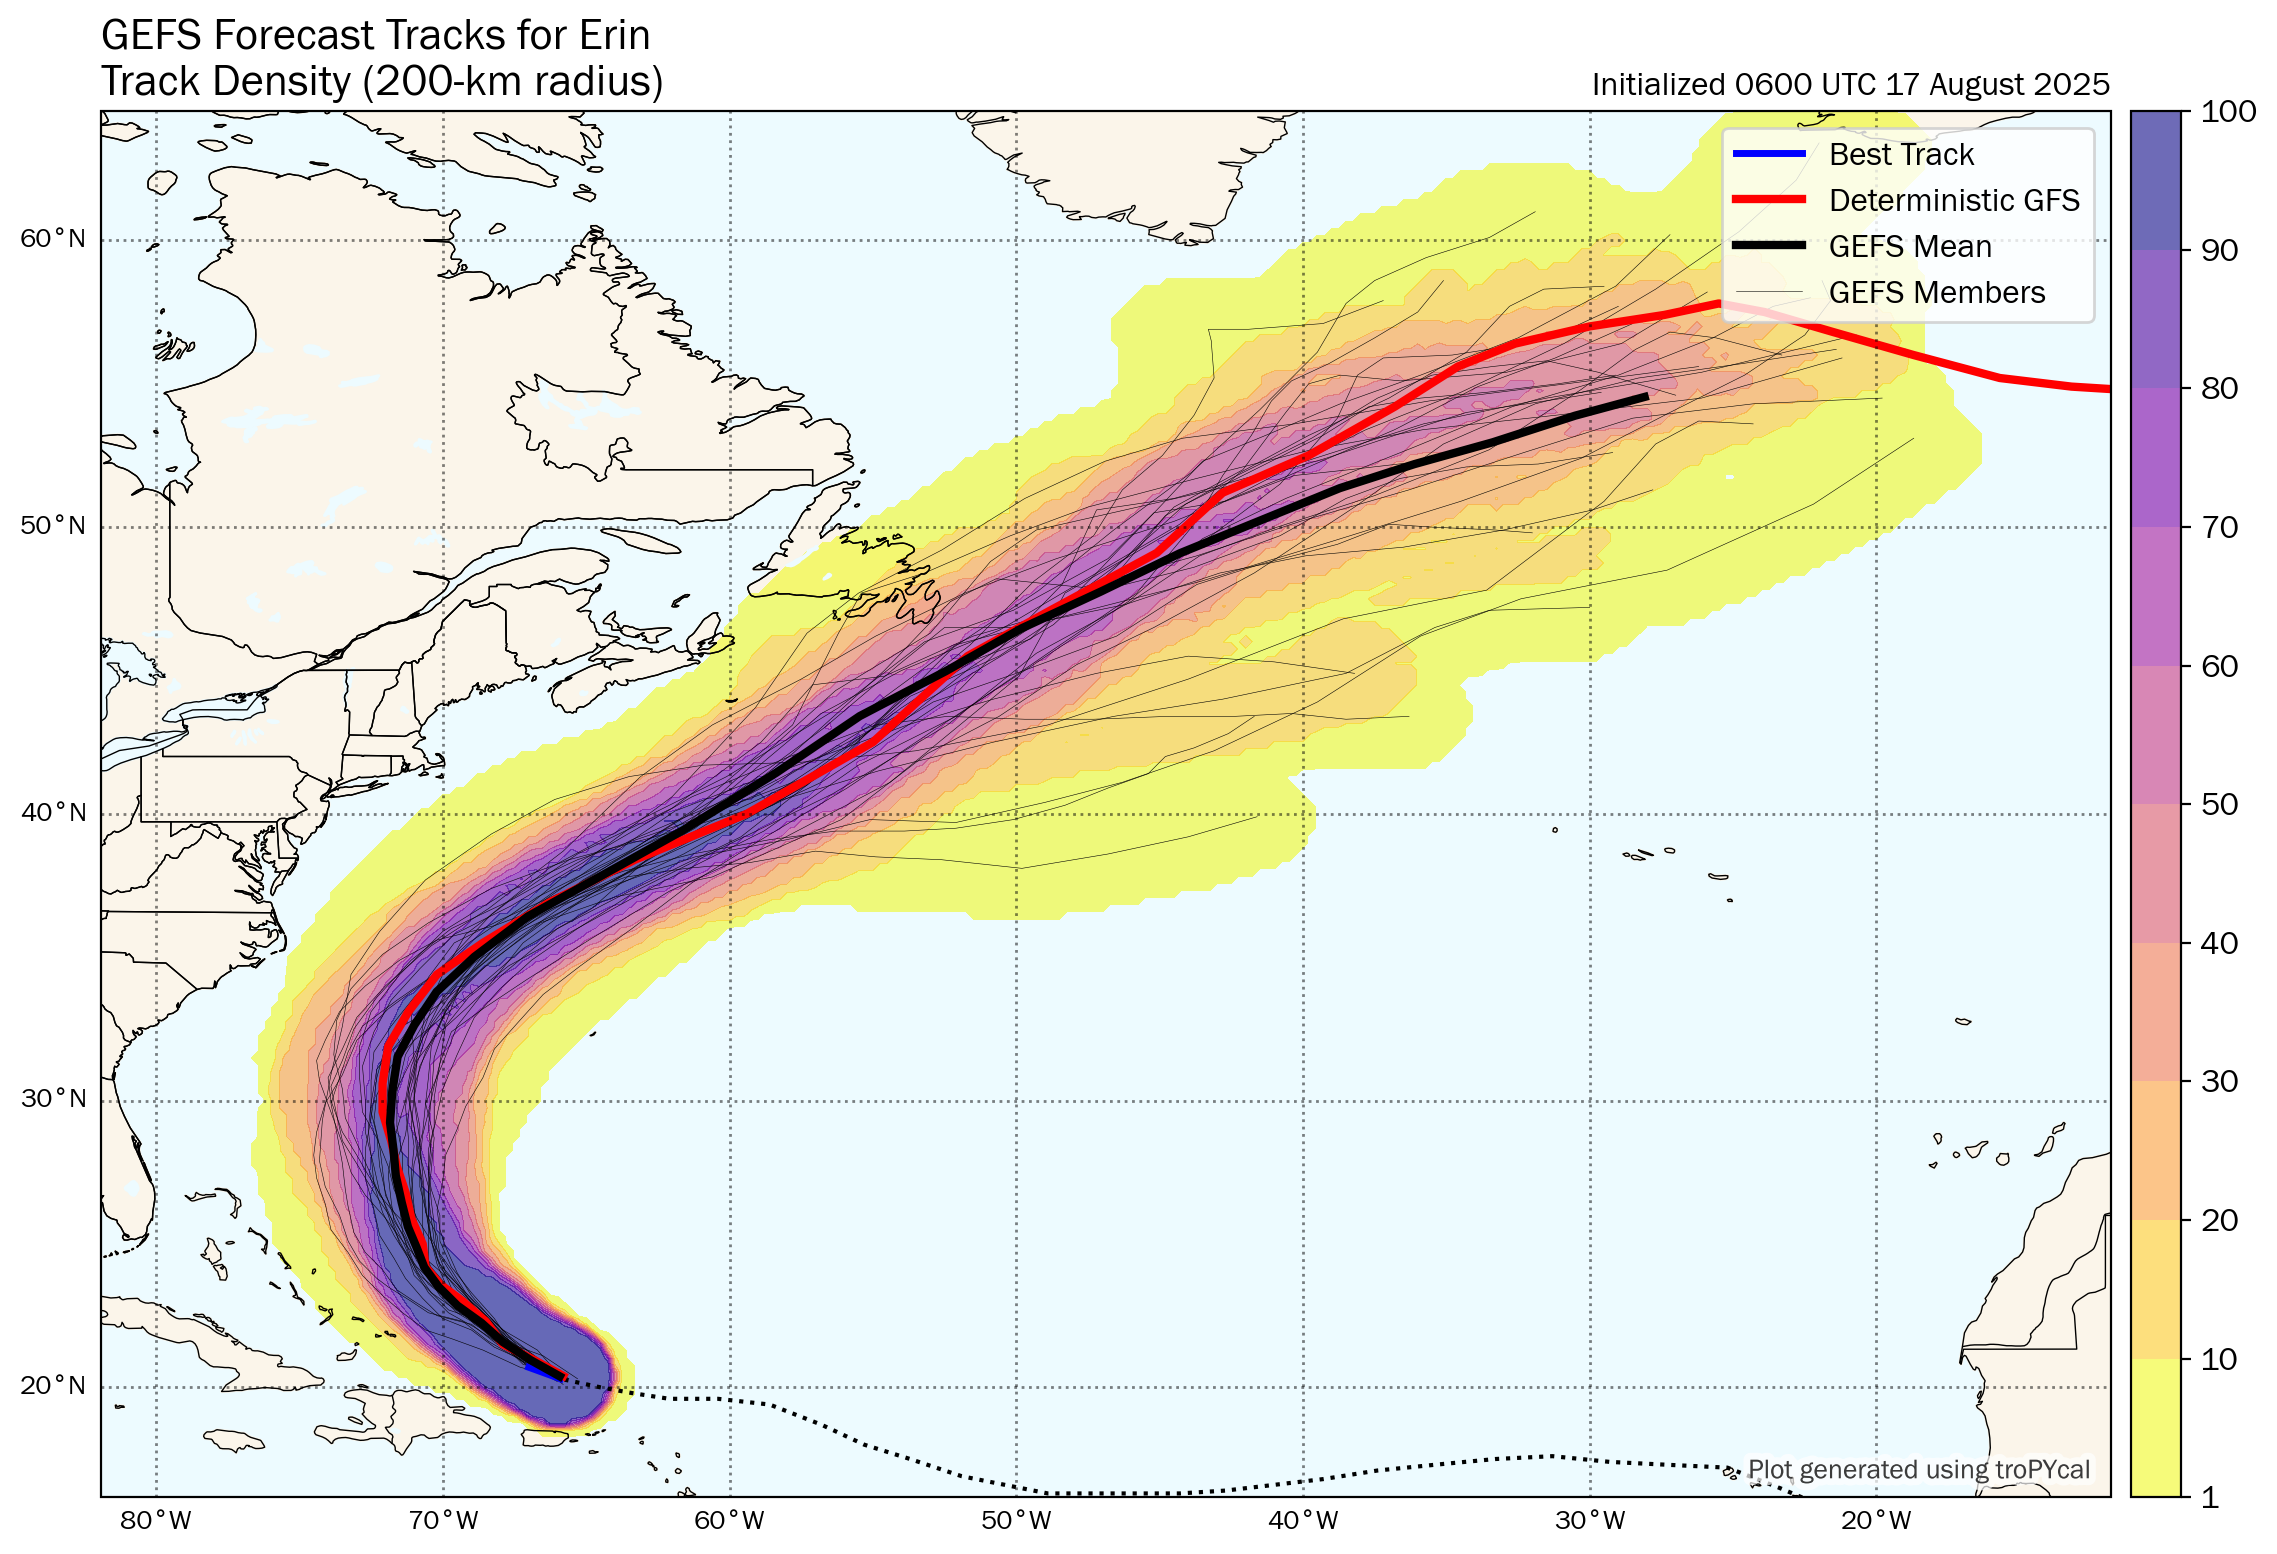
GEFS Track Density
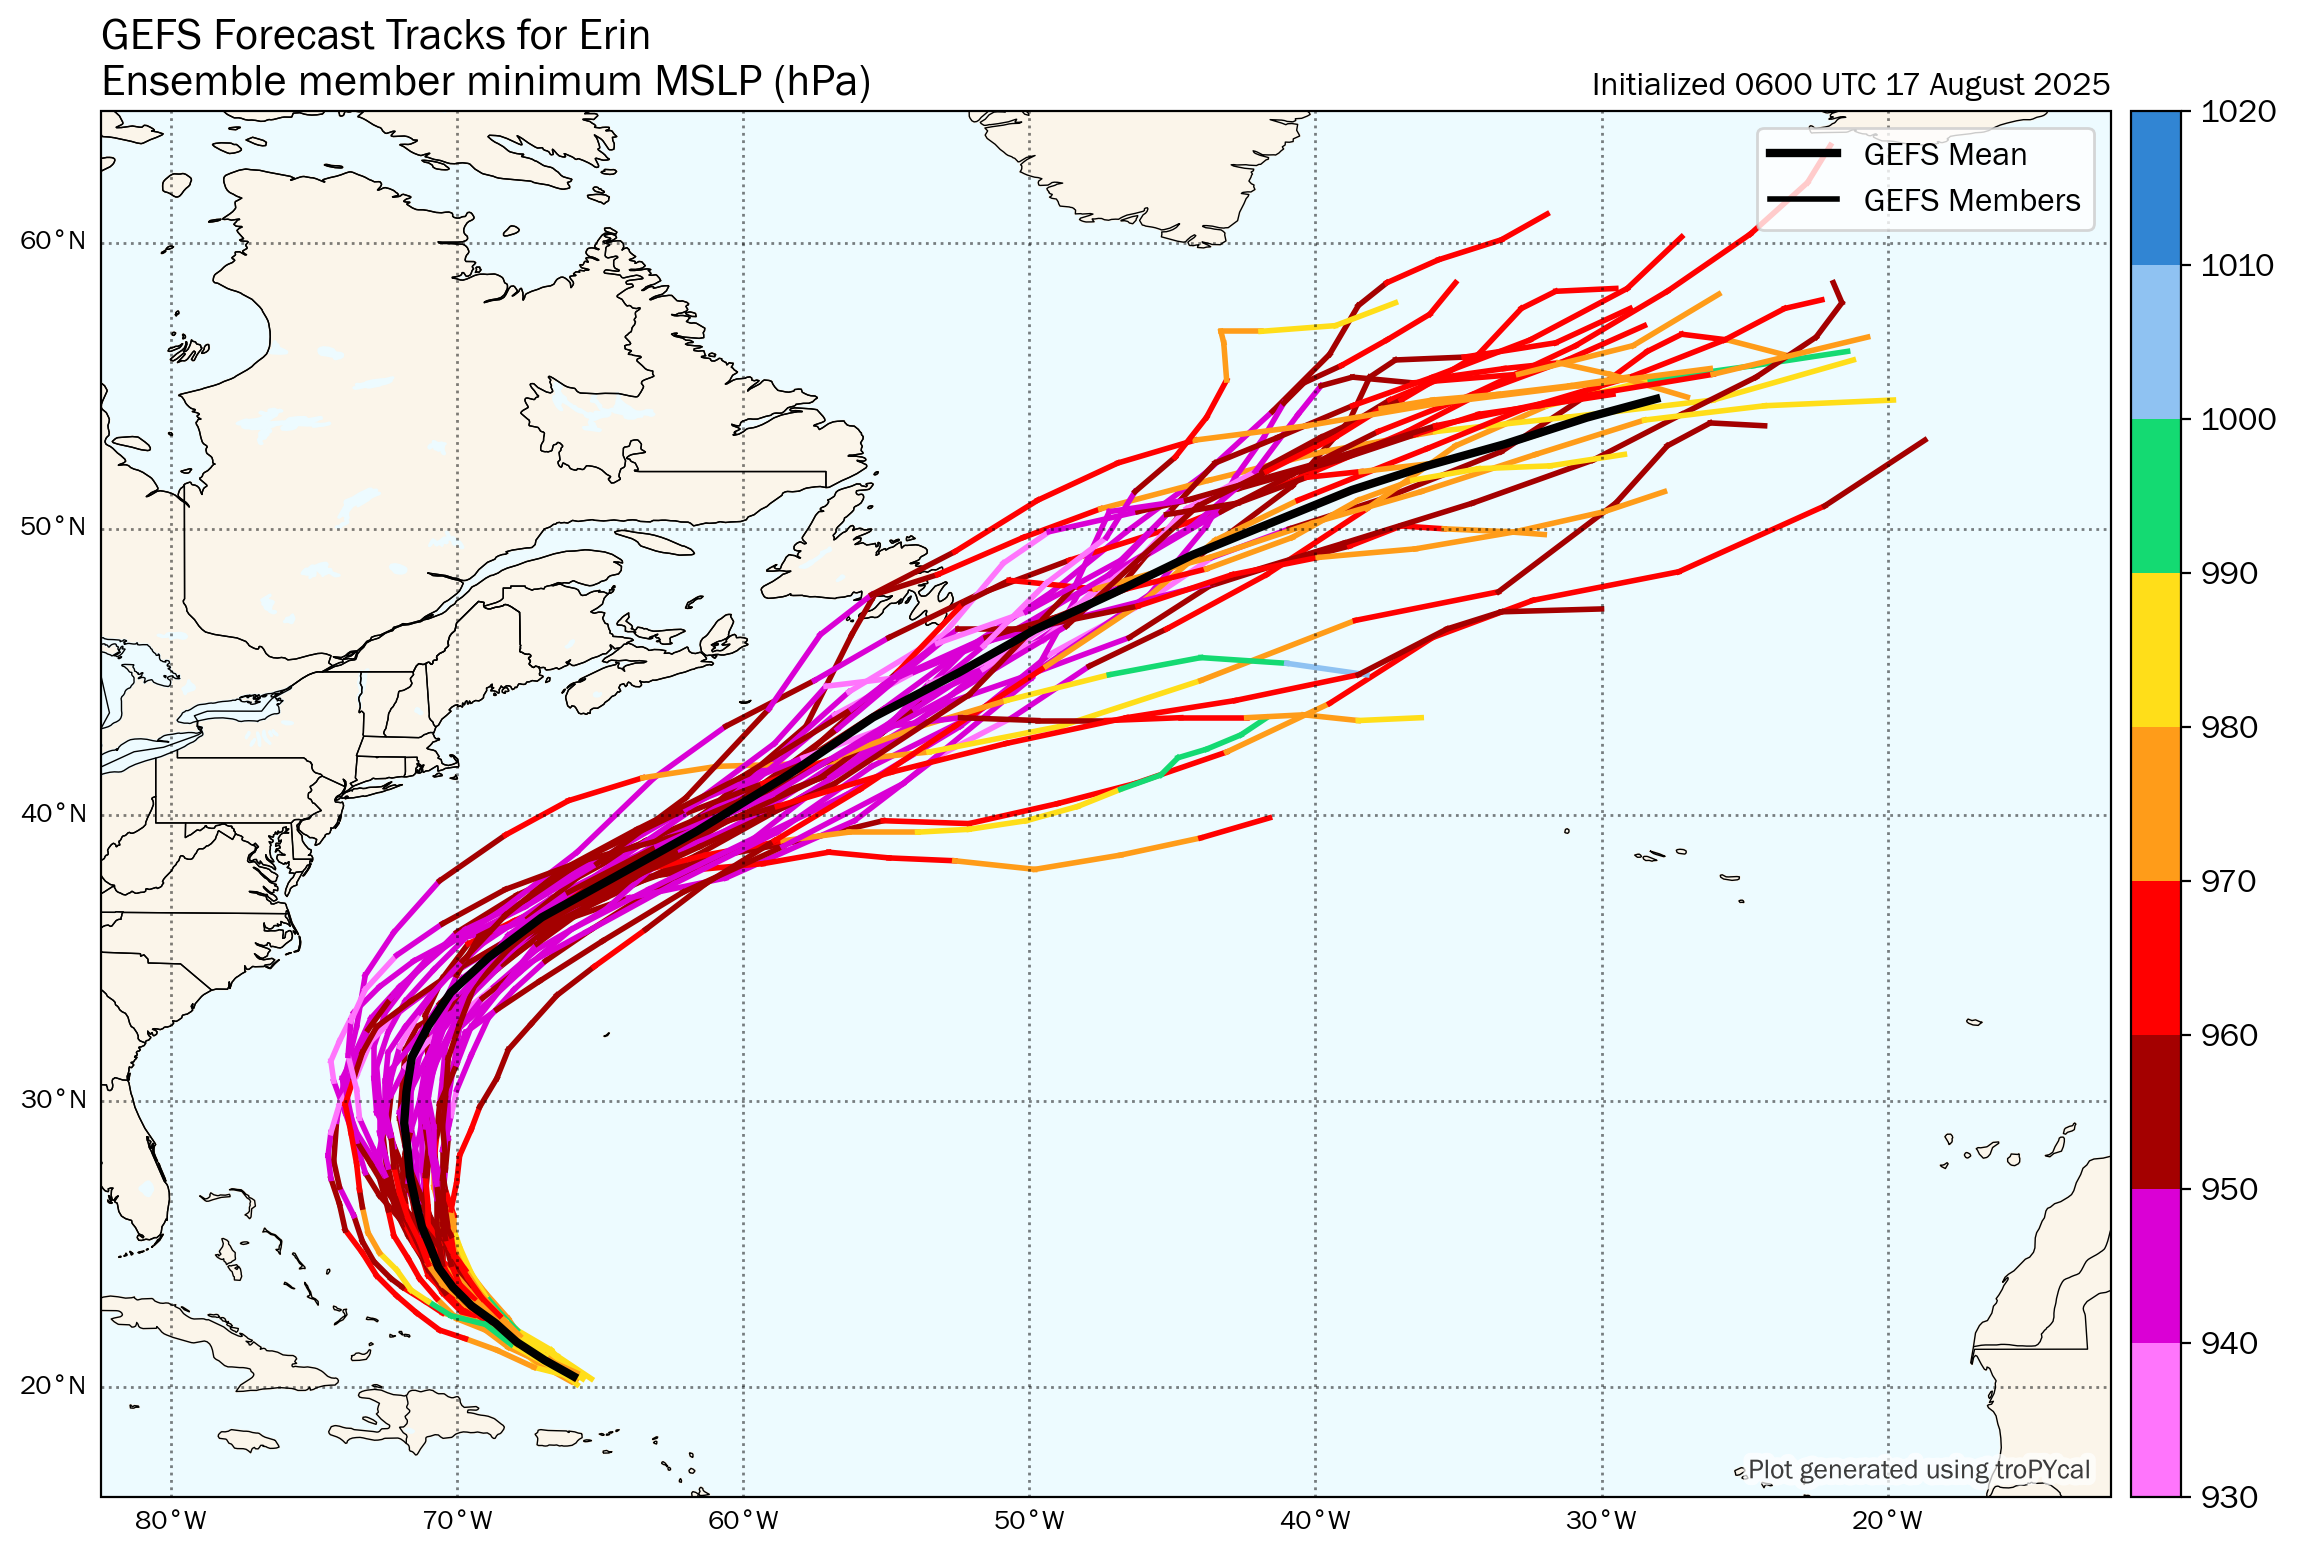
GEFS Tracks (MSLP)
Summary Plot
Summary Plot
Storm-Centered Composite
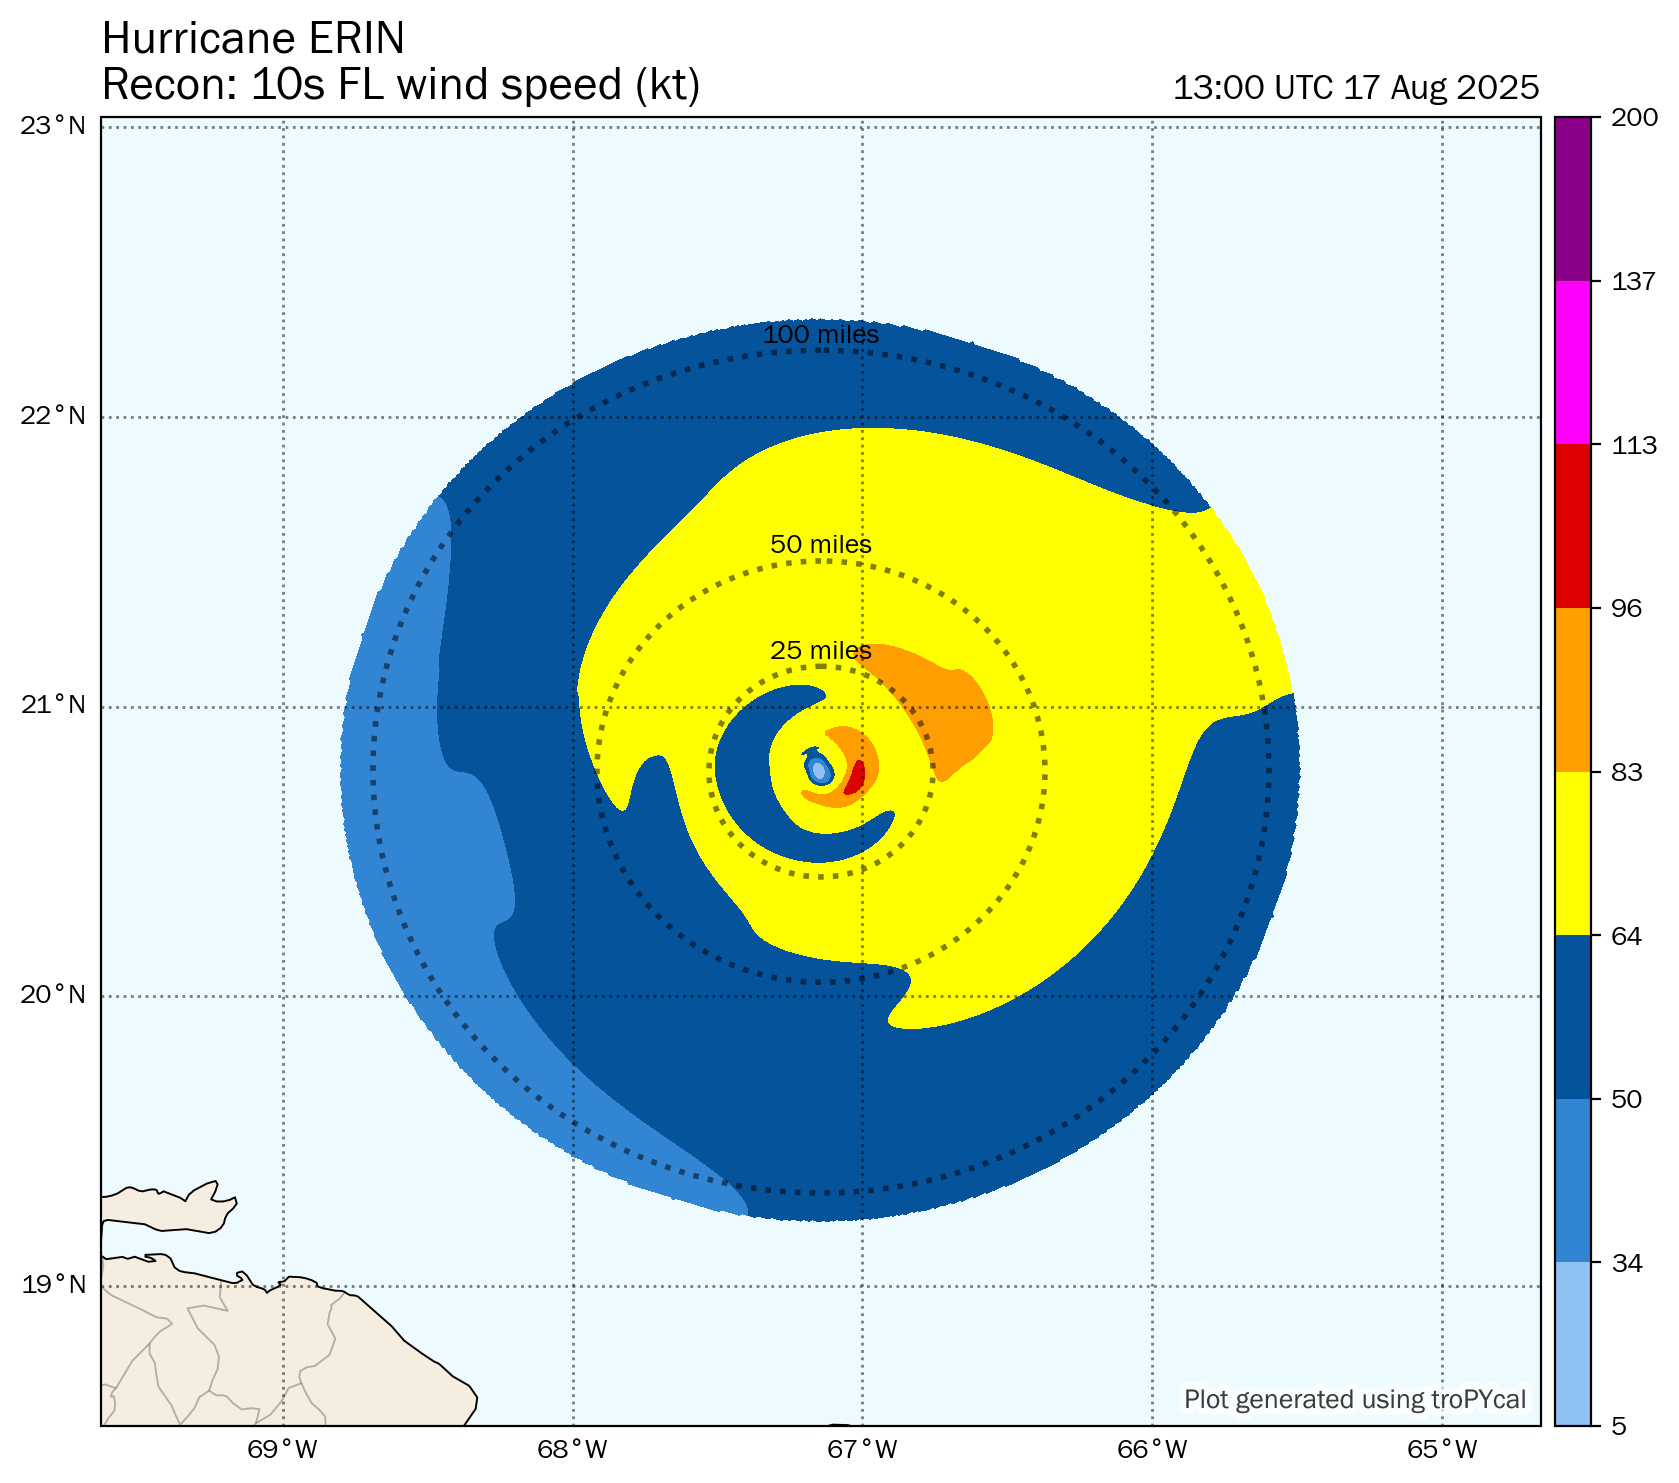
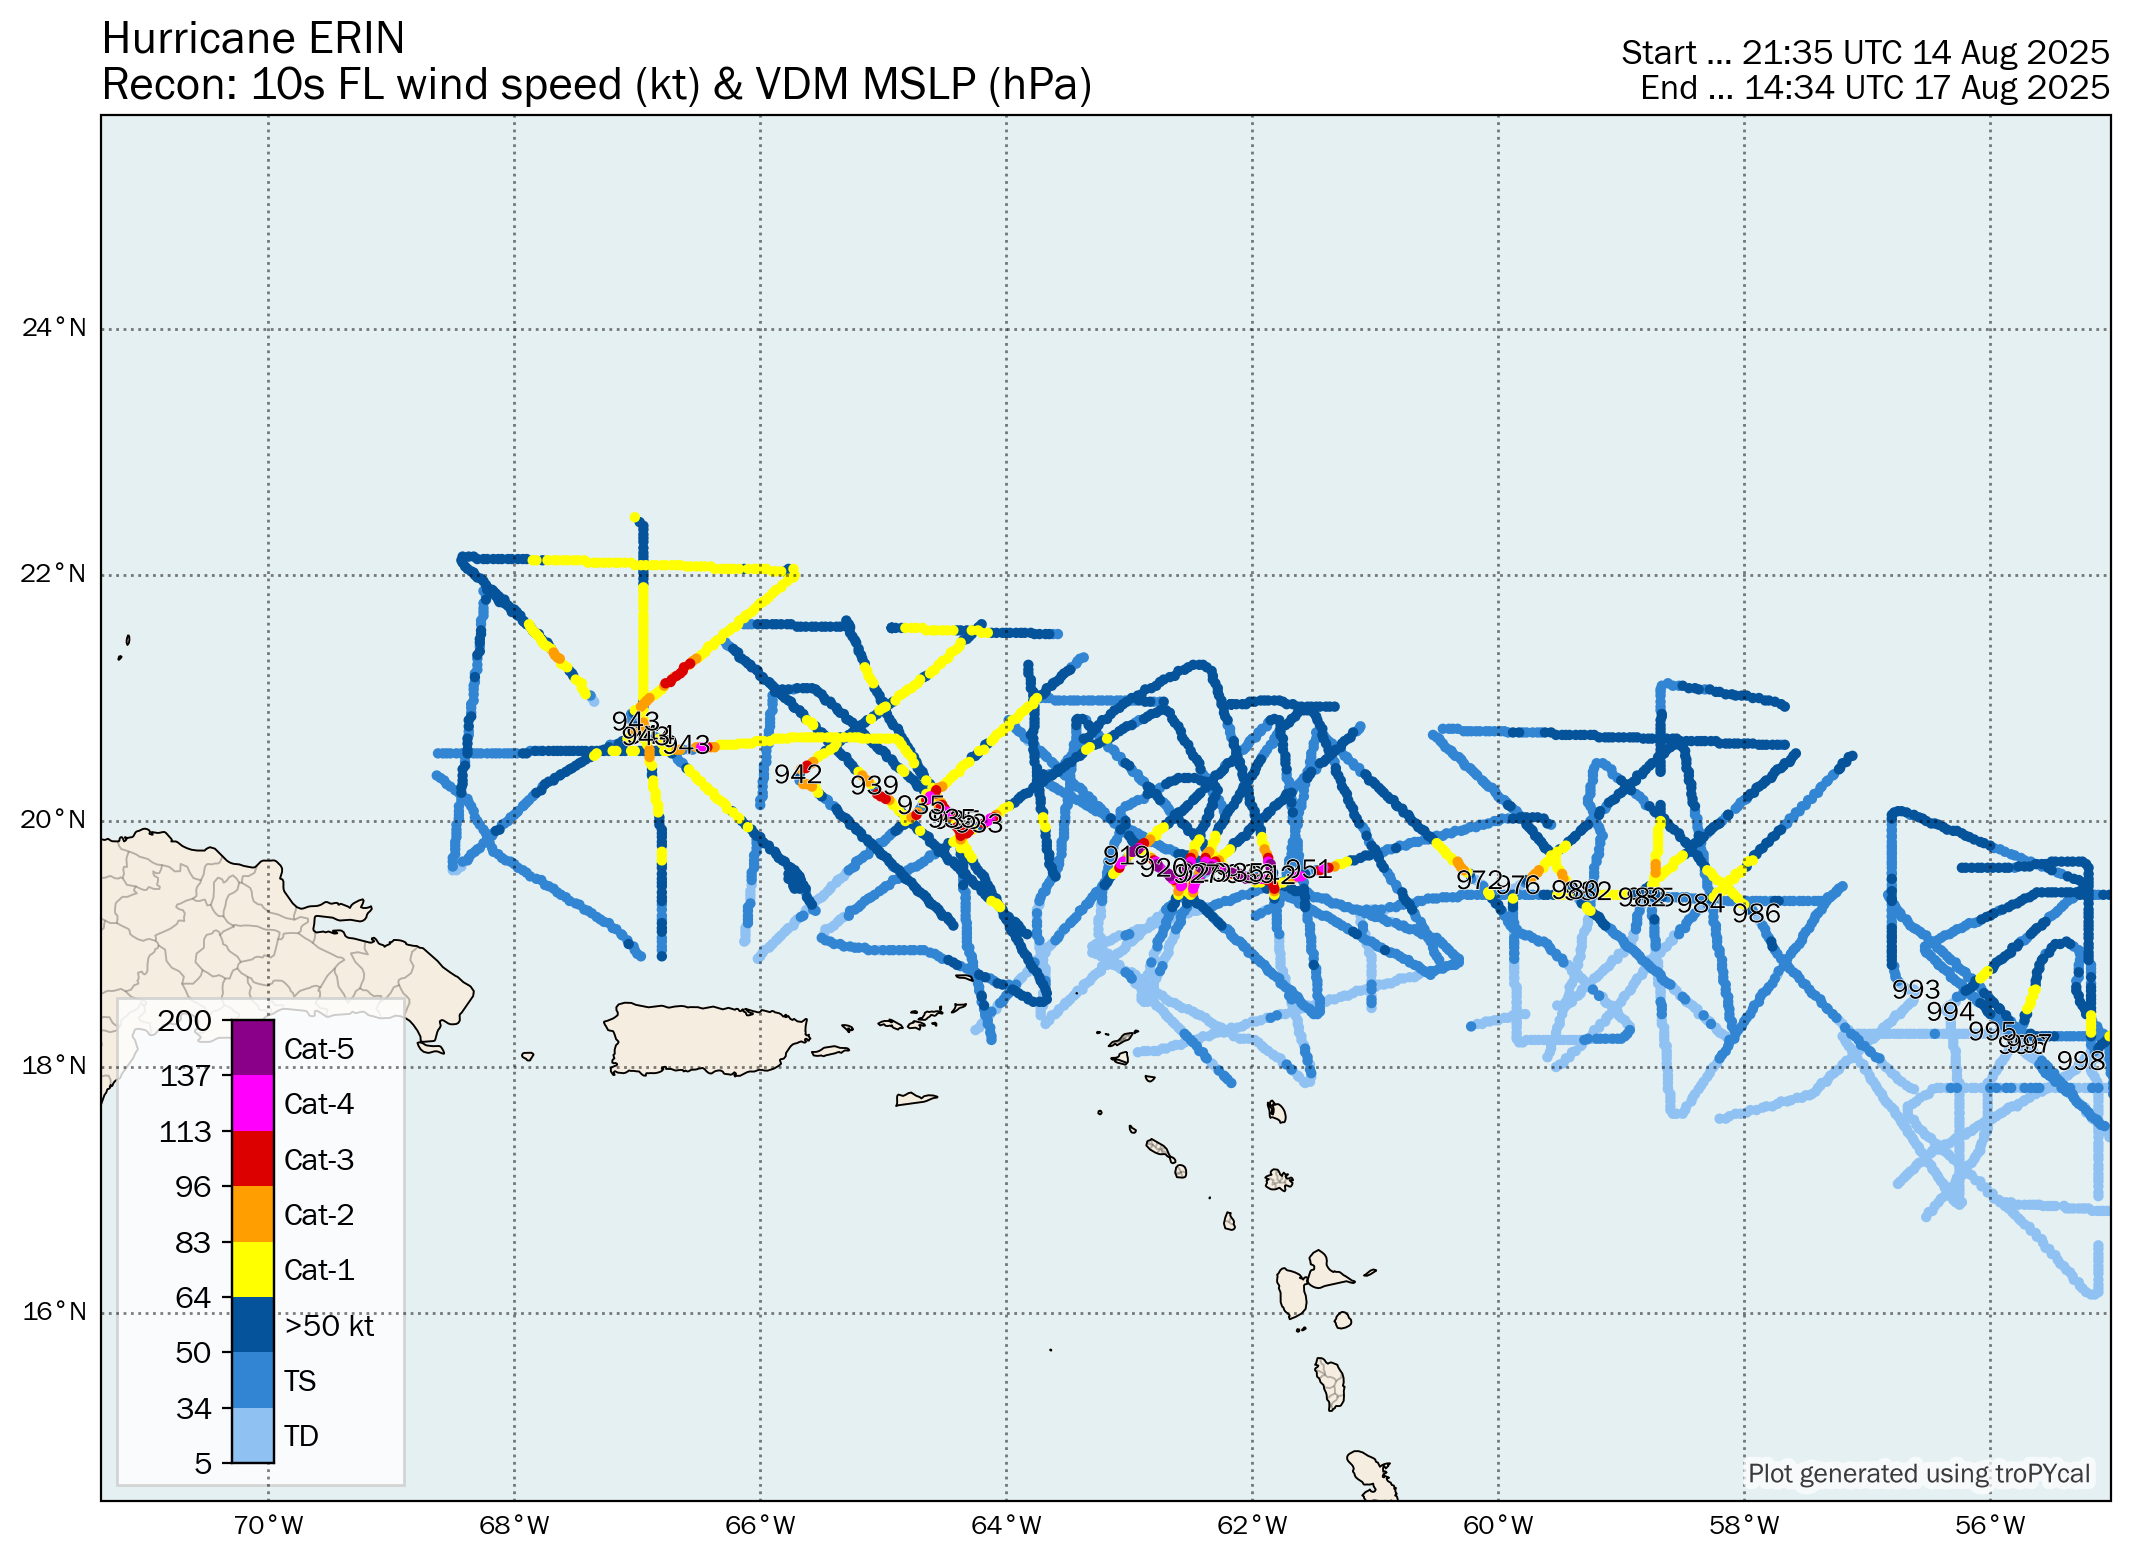
Recon Wind
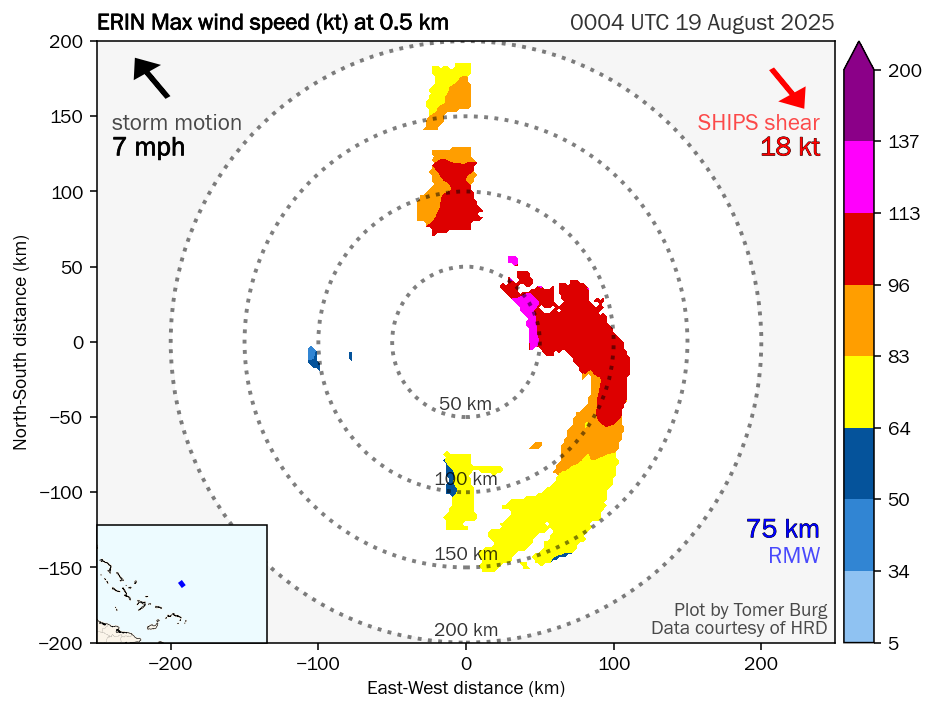
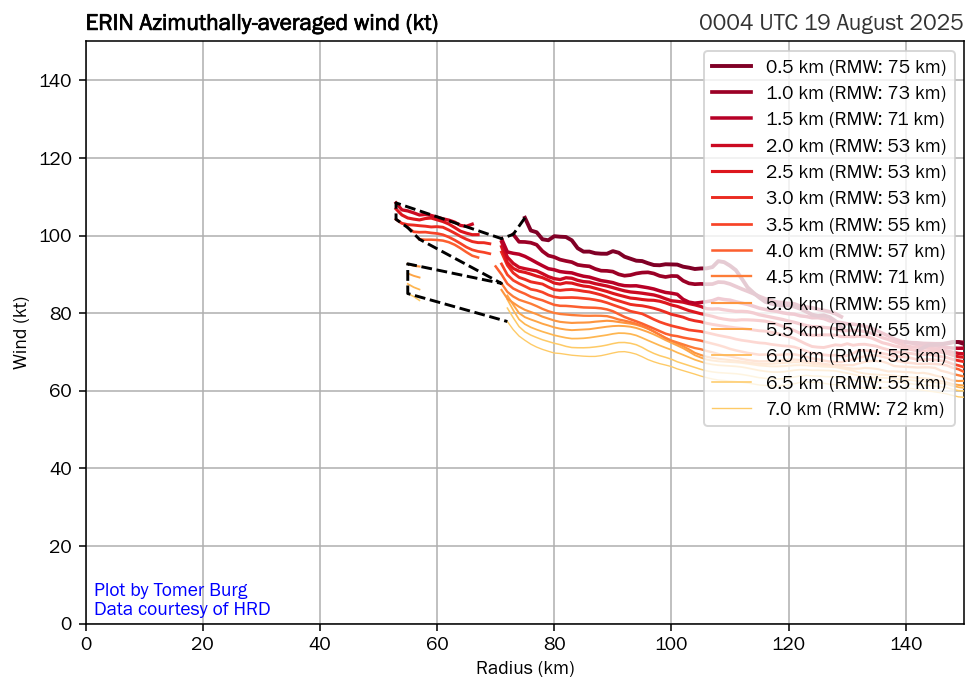
Derived RMW
| Time (UTC) | Lat | Lon | Wind (mph) | Pressure | Storm Type | Category |
|---|---|---|---|---|---|---|
| 1200 UTC 08 Aug | 9.5 | -13.5 | 30 | N/A | Disturbance | - |
| 1800 UTC 08 Aug | 9.7 | -14.3 | 30 | N/A | Disturbance | - |
| 0000 UTC 09 Aug | 9.9 | -15.2 | 30 | 1008 | Disturbance | - |
| 0600 UTC 09 Aug | 10.0 | -16.1 | 30 | 1007 | Disturbance | - |
| 1200 UTC 09 Aug | 10.1 | -17.0 | 30 | 1006 | Disturbance | - |
| 1800 UTC 09 Aug | 10.6 | -18.0 | 30 | 1006 | Disturbance | - |
| 0000 UTC 10 Aug | 11.6 | -19.0 | 30 | 1006 | Disturbance | - |
| 0600 UTC 10 Aug | 12.5 | -19.9 | 30 | 1006 | Disturbance | - |
| 1200 UTC 10 Aug | 14.0 | -20.3 | 35 | 1006 | Disturbance | - |
| 1800 UTC 10 Aug | 15.7 | -21.5 | 35 | 1006 | Disturbance | - |
| 0000 UTC 11 Aug | 16.5 | -23.4 | 35 | 1006 | Disturbance | - |
| 0600 UTC 11 Aug | 17.2 | -25.2 | 35 | 1006 | Disturbance | - |
| 1200 UTC 11 Aug | 17.3 | -27.3 | 45 | 1004 | Tropical Storm | - |
| 1800 UTC 11 Aug | 17.4 | -29.3 | 45 | 1004 | Tropical Storm | - |
| 0000 UTC 12 Aug | 17.6 | -31.3 | 45 | 1004 | Tropical Storm | - |
| 0600 UTC 12 Aug | 17.5 | -33.3 | 45 | 1004 | Tropical Storm | - |
| 1200 UTC 12 Aug | 17.3 | -35.4 | 45 | 1006 | Tropical Storm | - |
| 1800 UTC 12 Aug | 17.1 | -37.4 | 45 | 1006 | Tropical Storm | - |
| 0000 UTC 13 Aug | 16.8 | -39.3 | 45 | 1004 | Tropical Storm | - |
| 0600 UTC 13 Aug | 16.6 | -41.0 | 45 | 1004 | Tropical Storm | - |
| 1200 UTC 13 Aug | 16.4 | -42.7 | 50 | 1002 | Tropical Storm | - |
| 1800 UTC 13 Aug | 16.3 | -44.3 | 50 | 1002 | Tropical Storm | - |
| 0000 UTC 14 Aug | 16.3 | -45.9 | 50 | 1002 | Tropical Storm | - |
| 0600 UTC 14 Aug | 16.3 | -47.5 | 50 | 1002 | Tropical Storm | - |
| 1200 UTC 14 Aug | 16.3 | -48.9 | 60 | 999 | Tropical Storm | - |
| 1800 UTC 14 Aug | 16.6 | -50.4 | 60 | 998 | Tropical Storm | - |
| 0000 UTC 15 Aug | 16.9 | -51.9 | 70 | 998 | Tropical Storm | - |
| 0600 UTC 15 Aug | 17.5 | -53.7 | 70 | 998 | Tropical Storm | - |
| 1200 UTC 15 Aug | 18.0 | -55.3 | 75 | 998 | Hurricane | 1 |
| 1800 UTC 15 Aug | 18.7 | -56.8 | 75 | 993 | Hurricane | 1 |
| 0000 UTC 16 Aug | 19.4 | -58.6 | 85 | 981 | Hurricane | 1 |
| 0600 UTC 16 Aug | 19.6 | -60.4 | 105 | 970 | Hurricane | 2 |
| 1200 UTC 16 Aug | 19.6 | -62.1 | 150 | 934 | Hurricane | 4 |
| 1800 UTC 16 Aug | 19.8 | -63.4 | 160 | 915 | Hurricane | 5 |
| 0000 UTC 17 Aug | 20.0 | -64.5 | 145 | 934 | Hurricane | 4 |
| 0600 UTC 17 Aug | 20.3 | -65.9 | 125 | 940 | Hurricane | 3 |
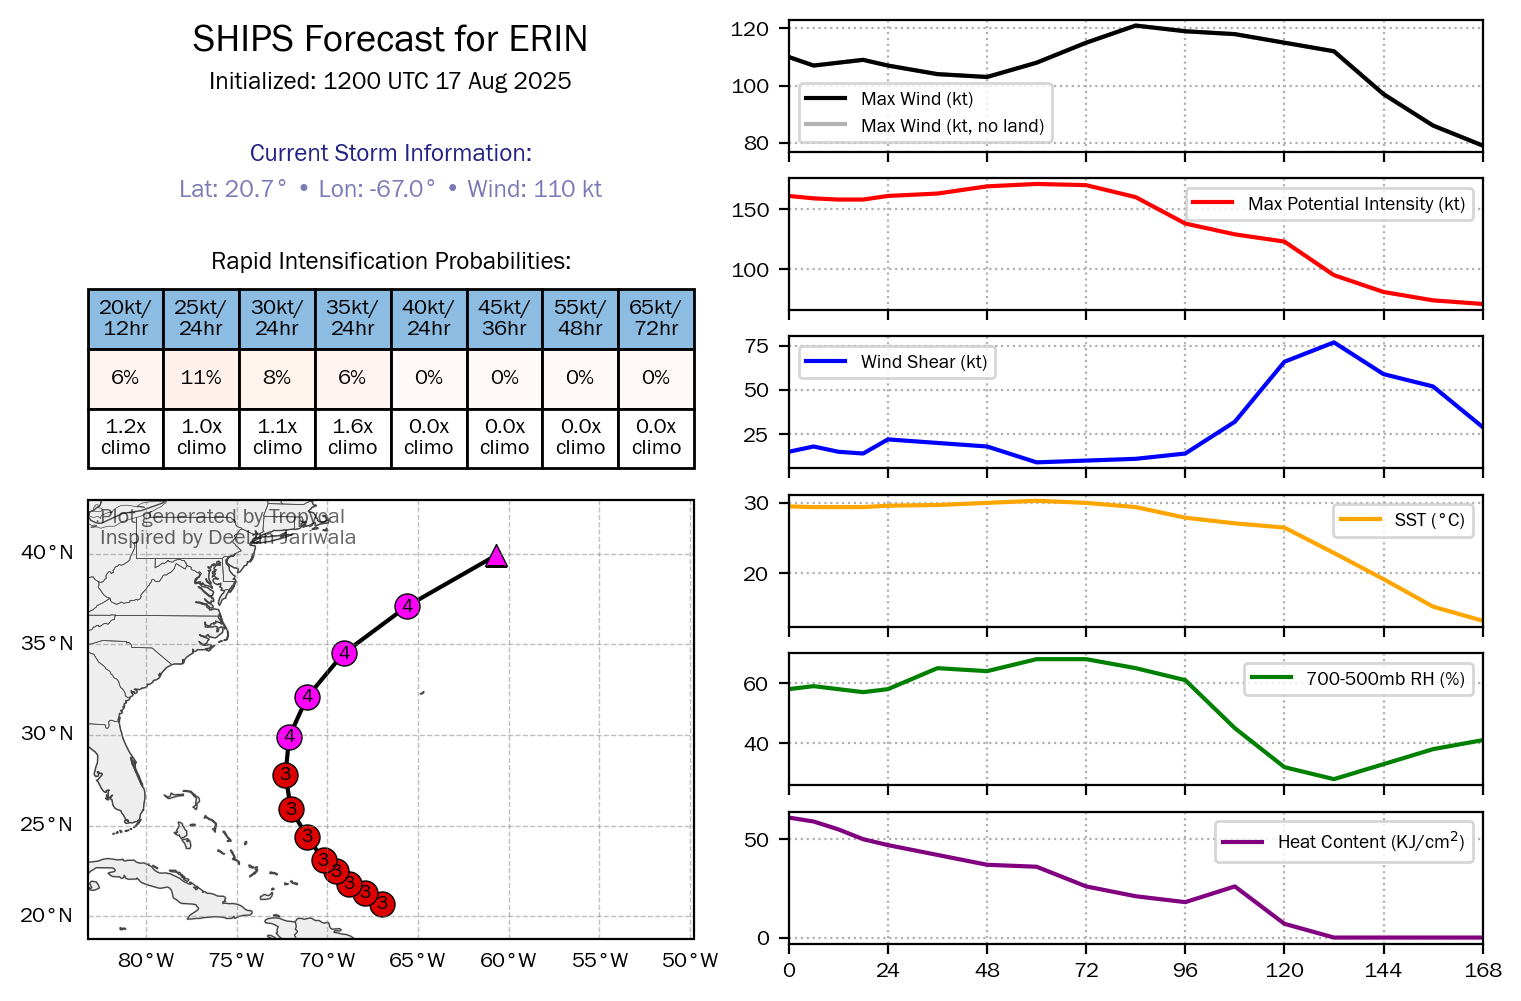
| 1200 UTC 17 Aug | 20.7 | -67.0 | 125 | 940 | Hurricane | 3 |
| 1800 UTC 17 Aug | 21.5 | -68.0 | 125 | 946 | Hurricane | 3 |
| 0000 UTC 18 Aug | 22.1 | -68.8 | 125 | 946 | Hurricane | 3 |
| 0600 UTC 18 Aug | 22.5 | -69.8 | 130 | 945 | Hurricane | 4 |
| 1200 UTC 18 Aug | 22.9 | -70.5 | 140 | 935 | Hurricane | 4 |
| 1800 UTC 18 Aug | 23.6 | -71.0 | 140 | 937 | Hurricane | 4 |
| 0000 UTC 19 Aug | 24.0 | -71.4 | 125 | 947 | Hurricane | 3 |
| 0600 UTC 19 Aug | 24.5 | -71.8 | 115 | 955 | Hurricane | 3 |
| 1200 UTC 19 Aug | 25.2 | -72.1 | 105 | 958 | Hurricane | 2 |
| 1800 UTC 19 Aug | 26.1 | -72.5 | 105 | 958 | Hurricane | 2 |
| 0000 UTC 20 Aug | 27.2 | -72.8 | 105 | 959 | Hurricane | 2 |
| 0600 UTC 20 Aug | 28.3 | -73.2 | 100 | 954 | Hurricane | 2 |
| 1200 UTC 20 Aug | 29.6 | -73.7 | 110 | 945 | Hurricane | 2 |
| 1800 UTC 20 Aug | 30.7 | -73.6 | 110 | 943 | Hurricane | 2 |
| 0000 UTC 21 Aug | 32.1 | -73.3 | 110 | 941 | Hurricane | 2 |
| 0600 UTC 21 Aug | 33.6 | -72.6 | 105 | 945 | Hurricane | 2 |
| 1200 UTC 21 Aug | 34.9 | -71.7 | 105 | 949 | Hurricane | 2 |
| 1800 UTC 21 Aug | 35.9 | -70.1 | 100 | 952 | Hurricane | 2 |
| 0000 UTC 22 Aug | 36.8 | -68.1 | 100 | 952 | Hurricane | 2 |
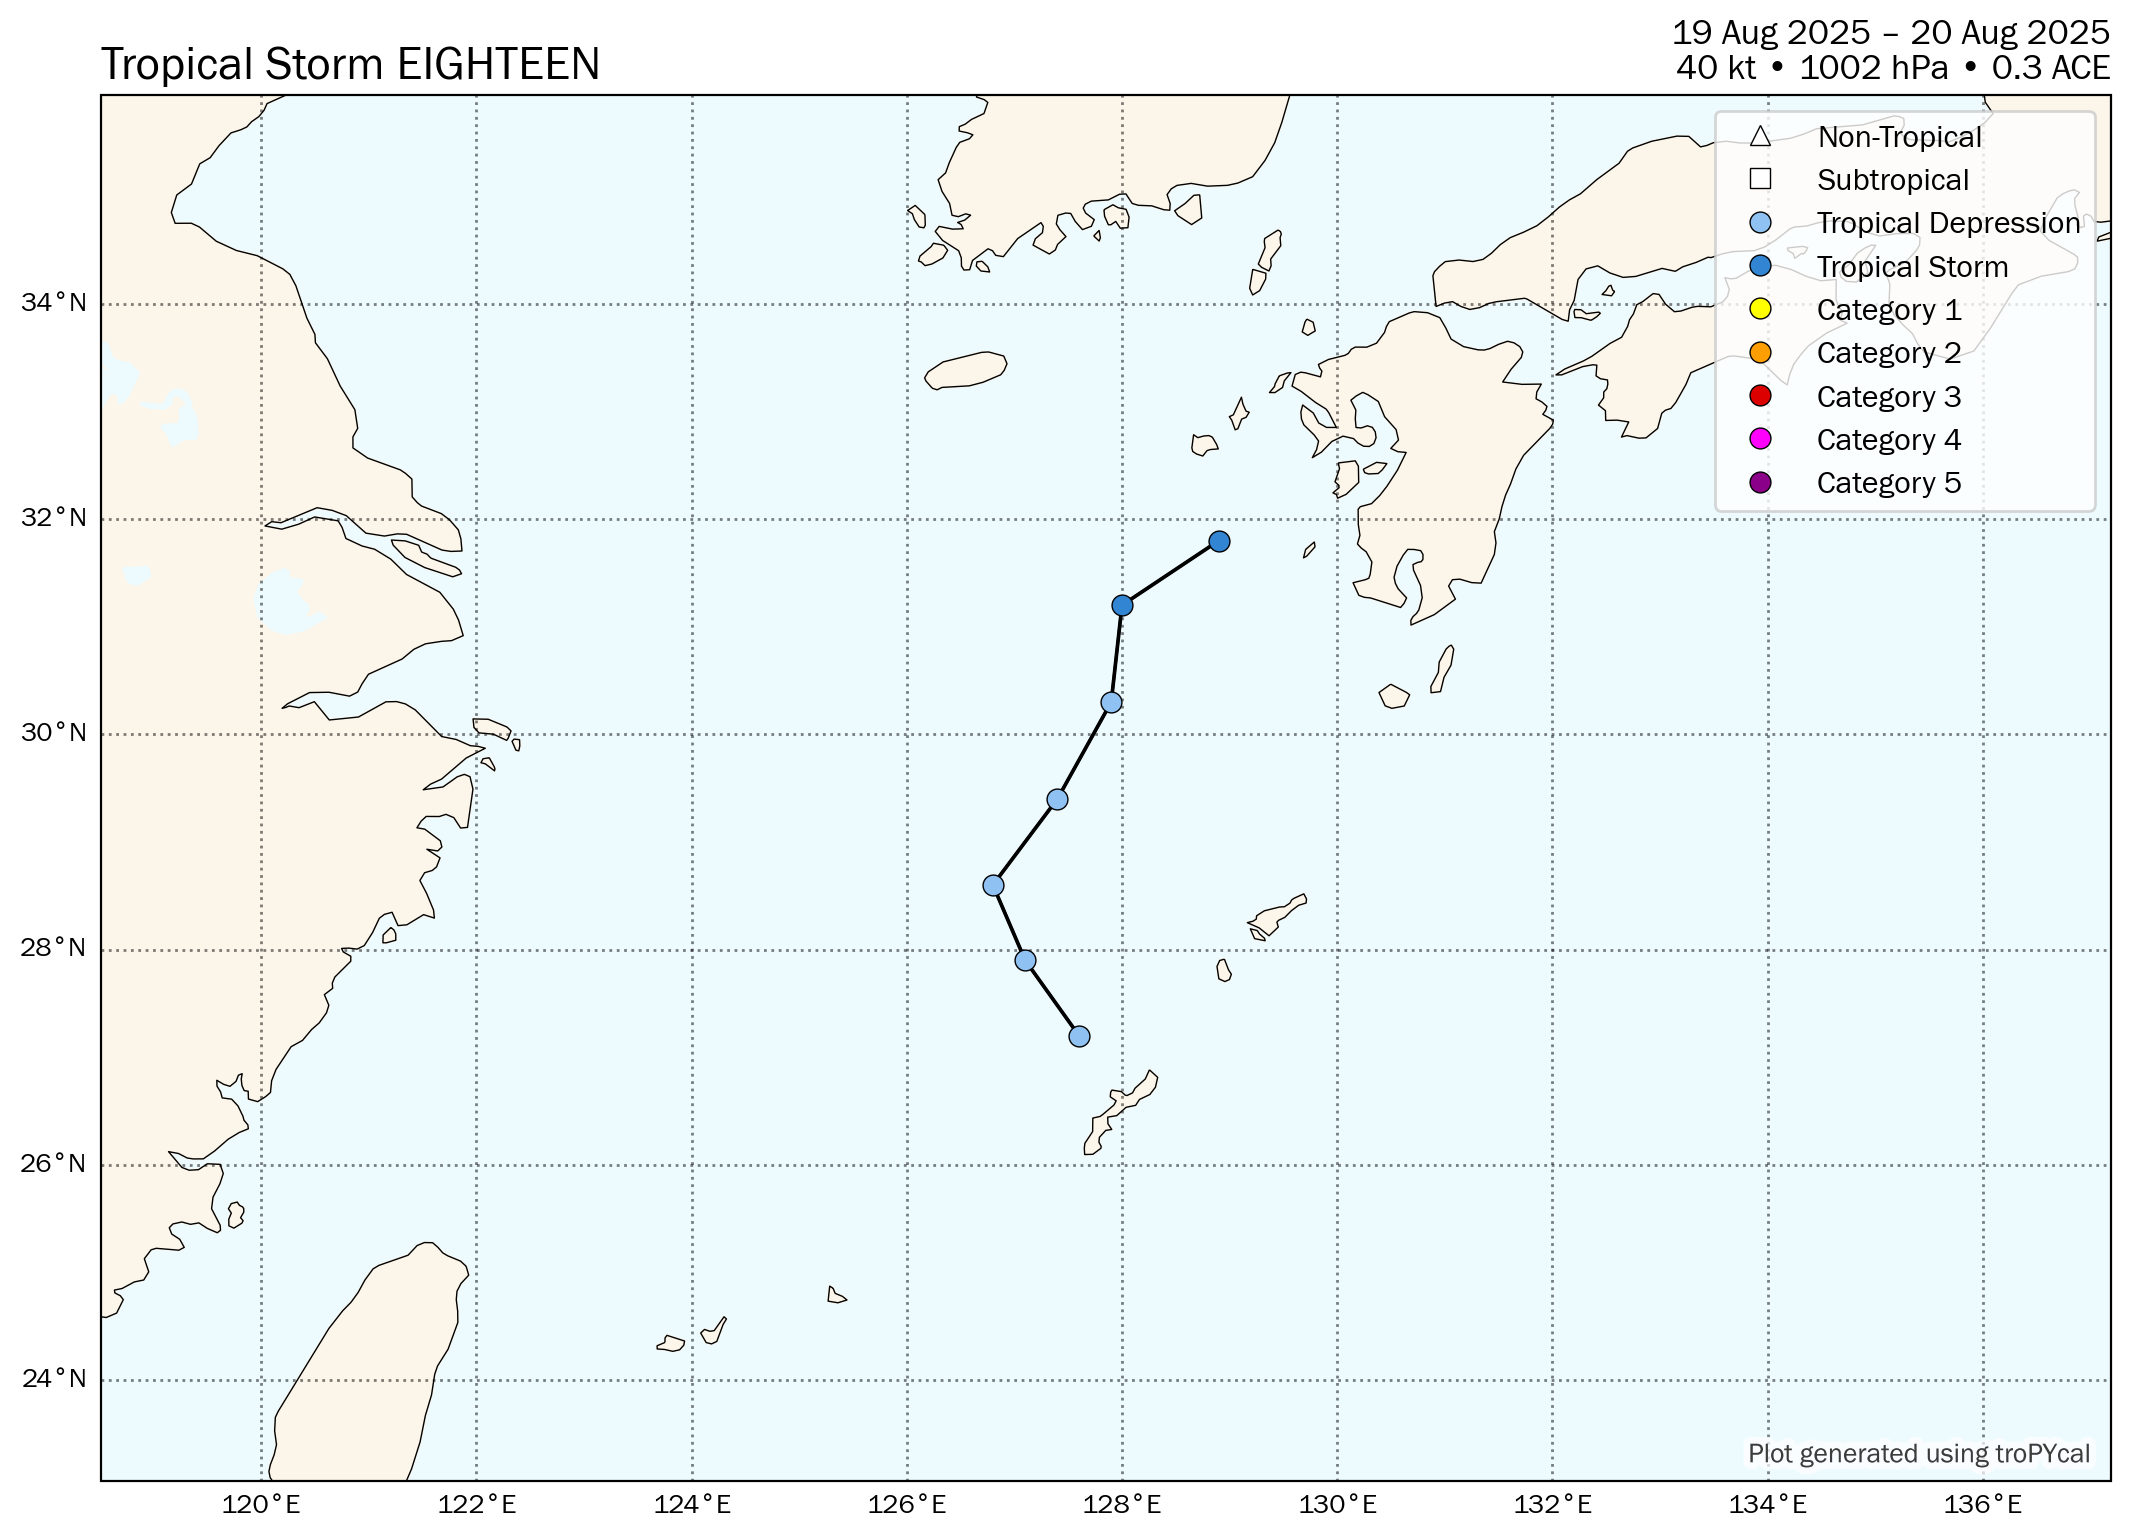
| Time (UTC) | Lat | Lon | Wind (mph) | Pressure | Storm Type | Category |
|---|---|---|---|---|---|---|
| 0600 UTC 19 Aug | 27.2 | 127.6 | 35 | 1009 | Tropical Depression | - |
| 1200 UTC 19 Aug | 27.9 | 127.1 | 35 | 1008 | Tropical Depression | - |
| 1800 UTC 19 Aug | 28.6 | 126.8 | 30 | 1005 | Tropical Depression | - |
| 0000 UTC 20 Aug | 29.4 | 127.4 | 35 | 1005 | Tropical Depression | - |
| 0600 UTC 20 Aug | 30.3 | 127.9 | 35 | 1005 | Tropical Depression | - |
| 1200 UTC 20 Aug | 31.2 | 128.0 | 40 | 1004 | Tropical Storm | - |
| 1800 UTC 20 Aug | 31.8 | 128.9 | 45 | 1002 | Tropical Storm | - |
| 0000 UTC 21 Aug | 32.0 | 129.2 | 45 | 996 | Tropical Storm | - |
| 0600 UTC 21 Aug | 31.7 | 129.9 | 50 | 992 | Tropical Storm | - |
| 1200 UTC 21 Aug | 31.6 | 130.9 | 35 | 1002 | Tropical Depression | - |
| 1800 UTC 21 Aug | 31.8 | 131.4 | 35 | 1004 | Tropical Depression | - |
| 0000 UTC 22 Aug | 32.1 | 132.0 | 30 | 1006 | Tropical Depression | - |
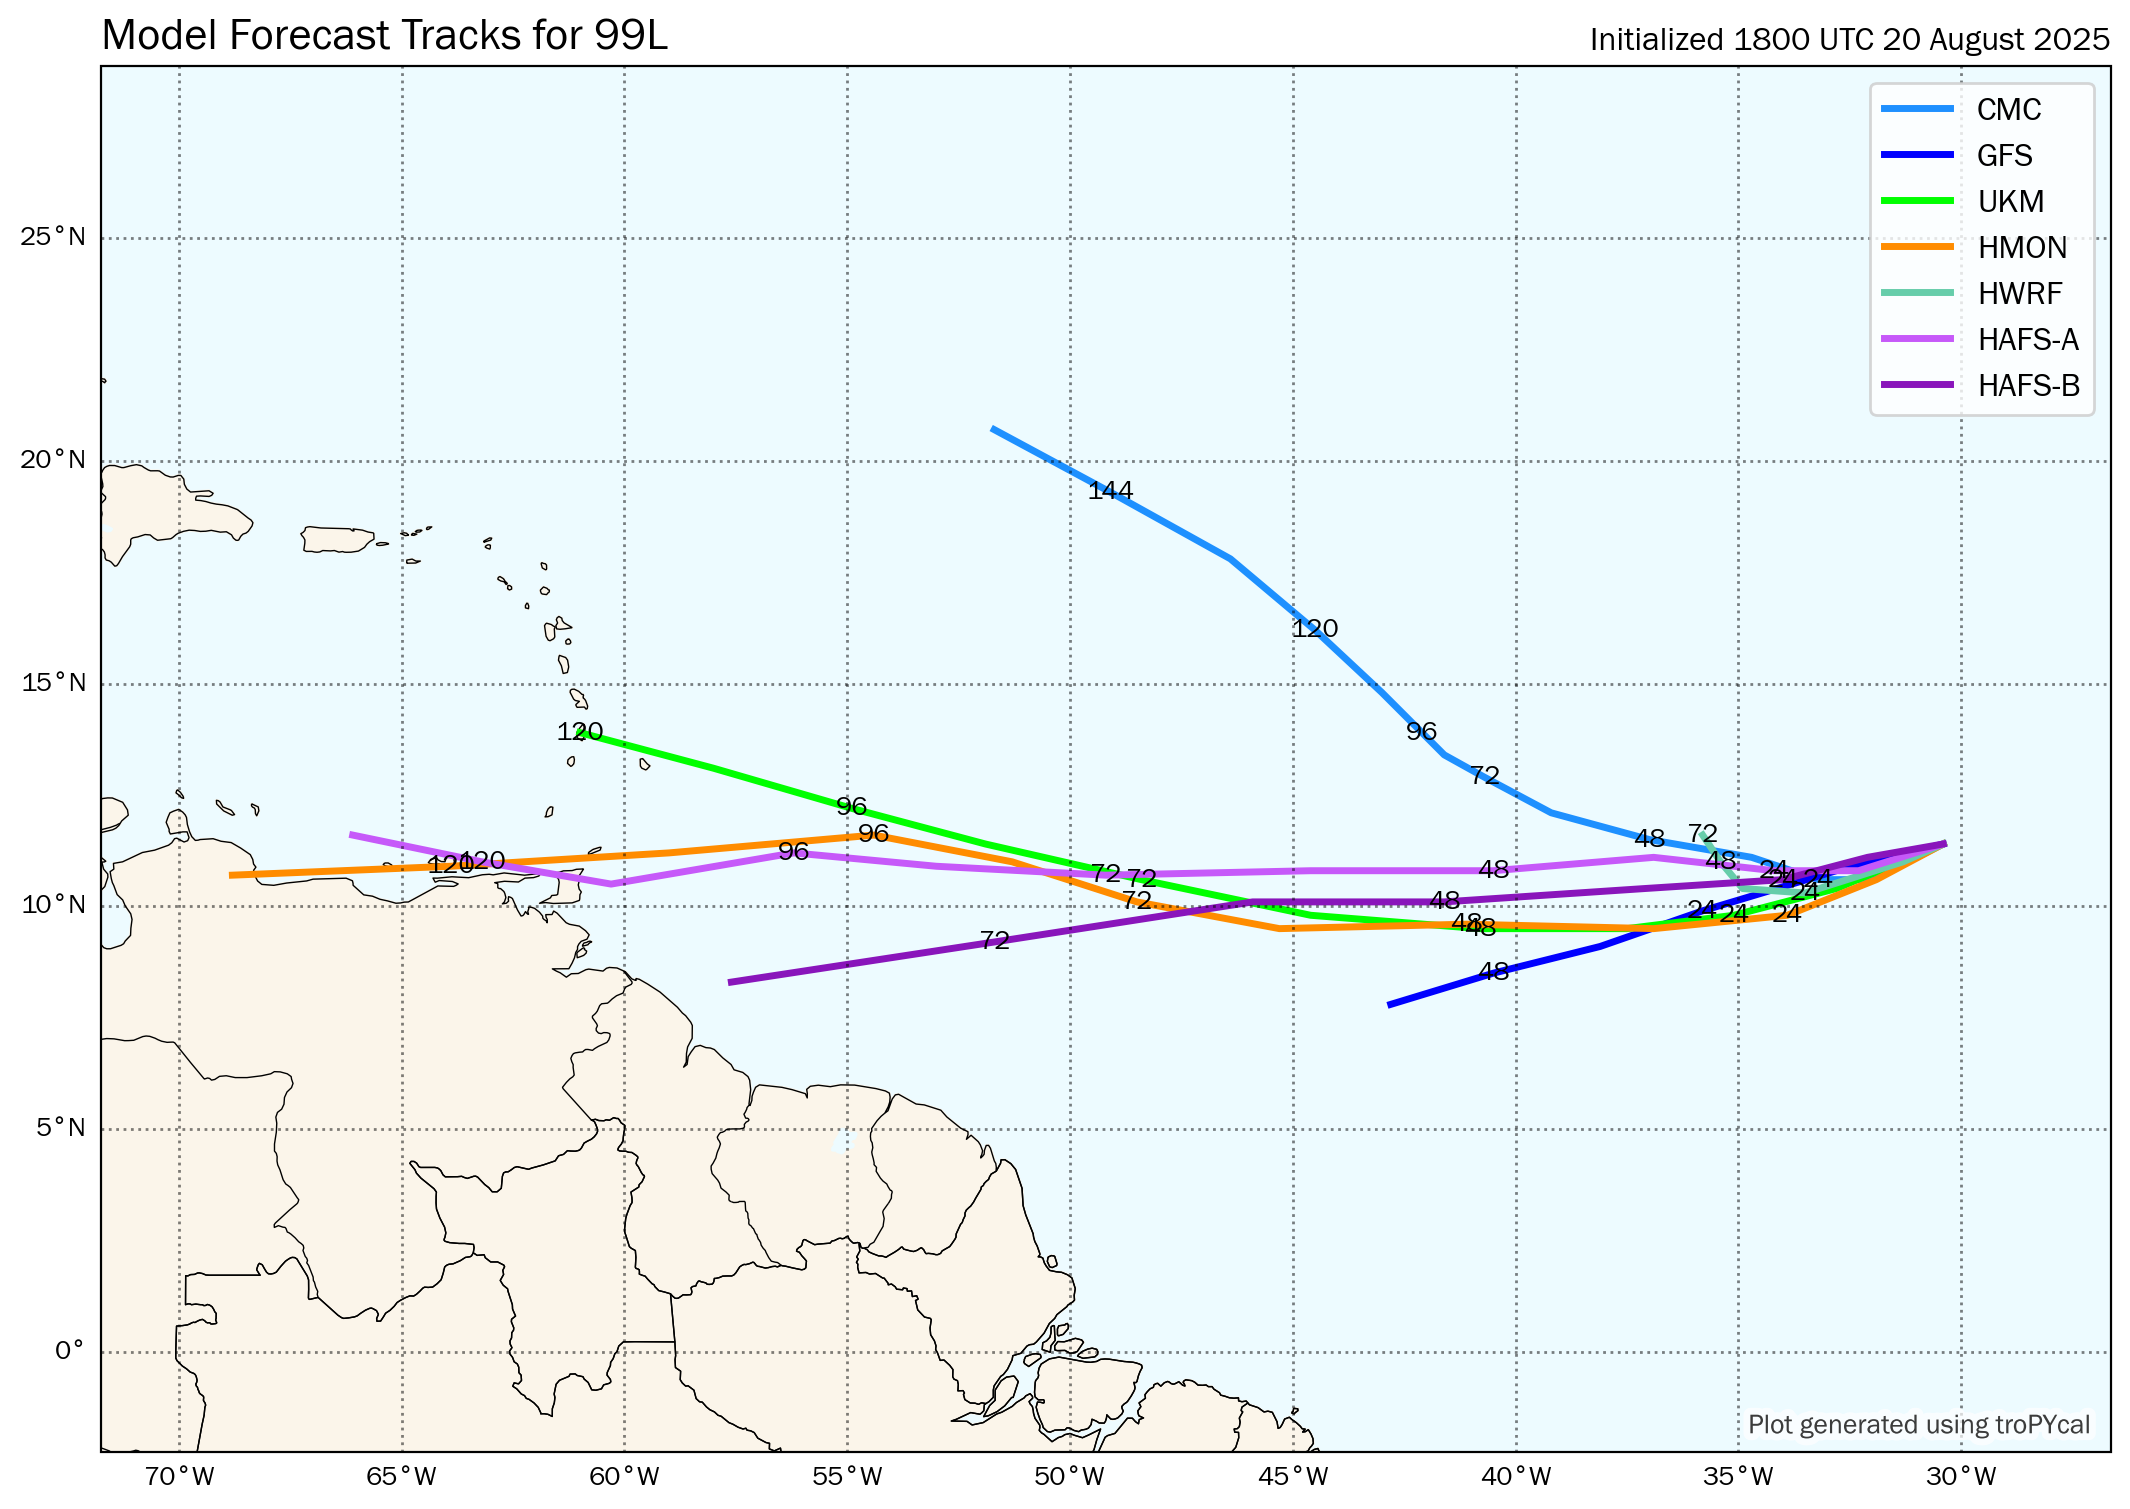
Model Tracks

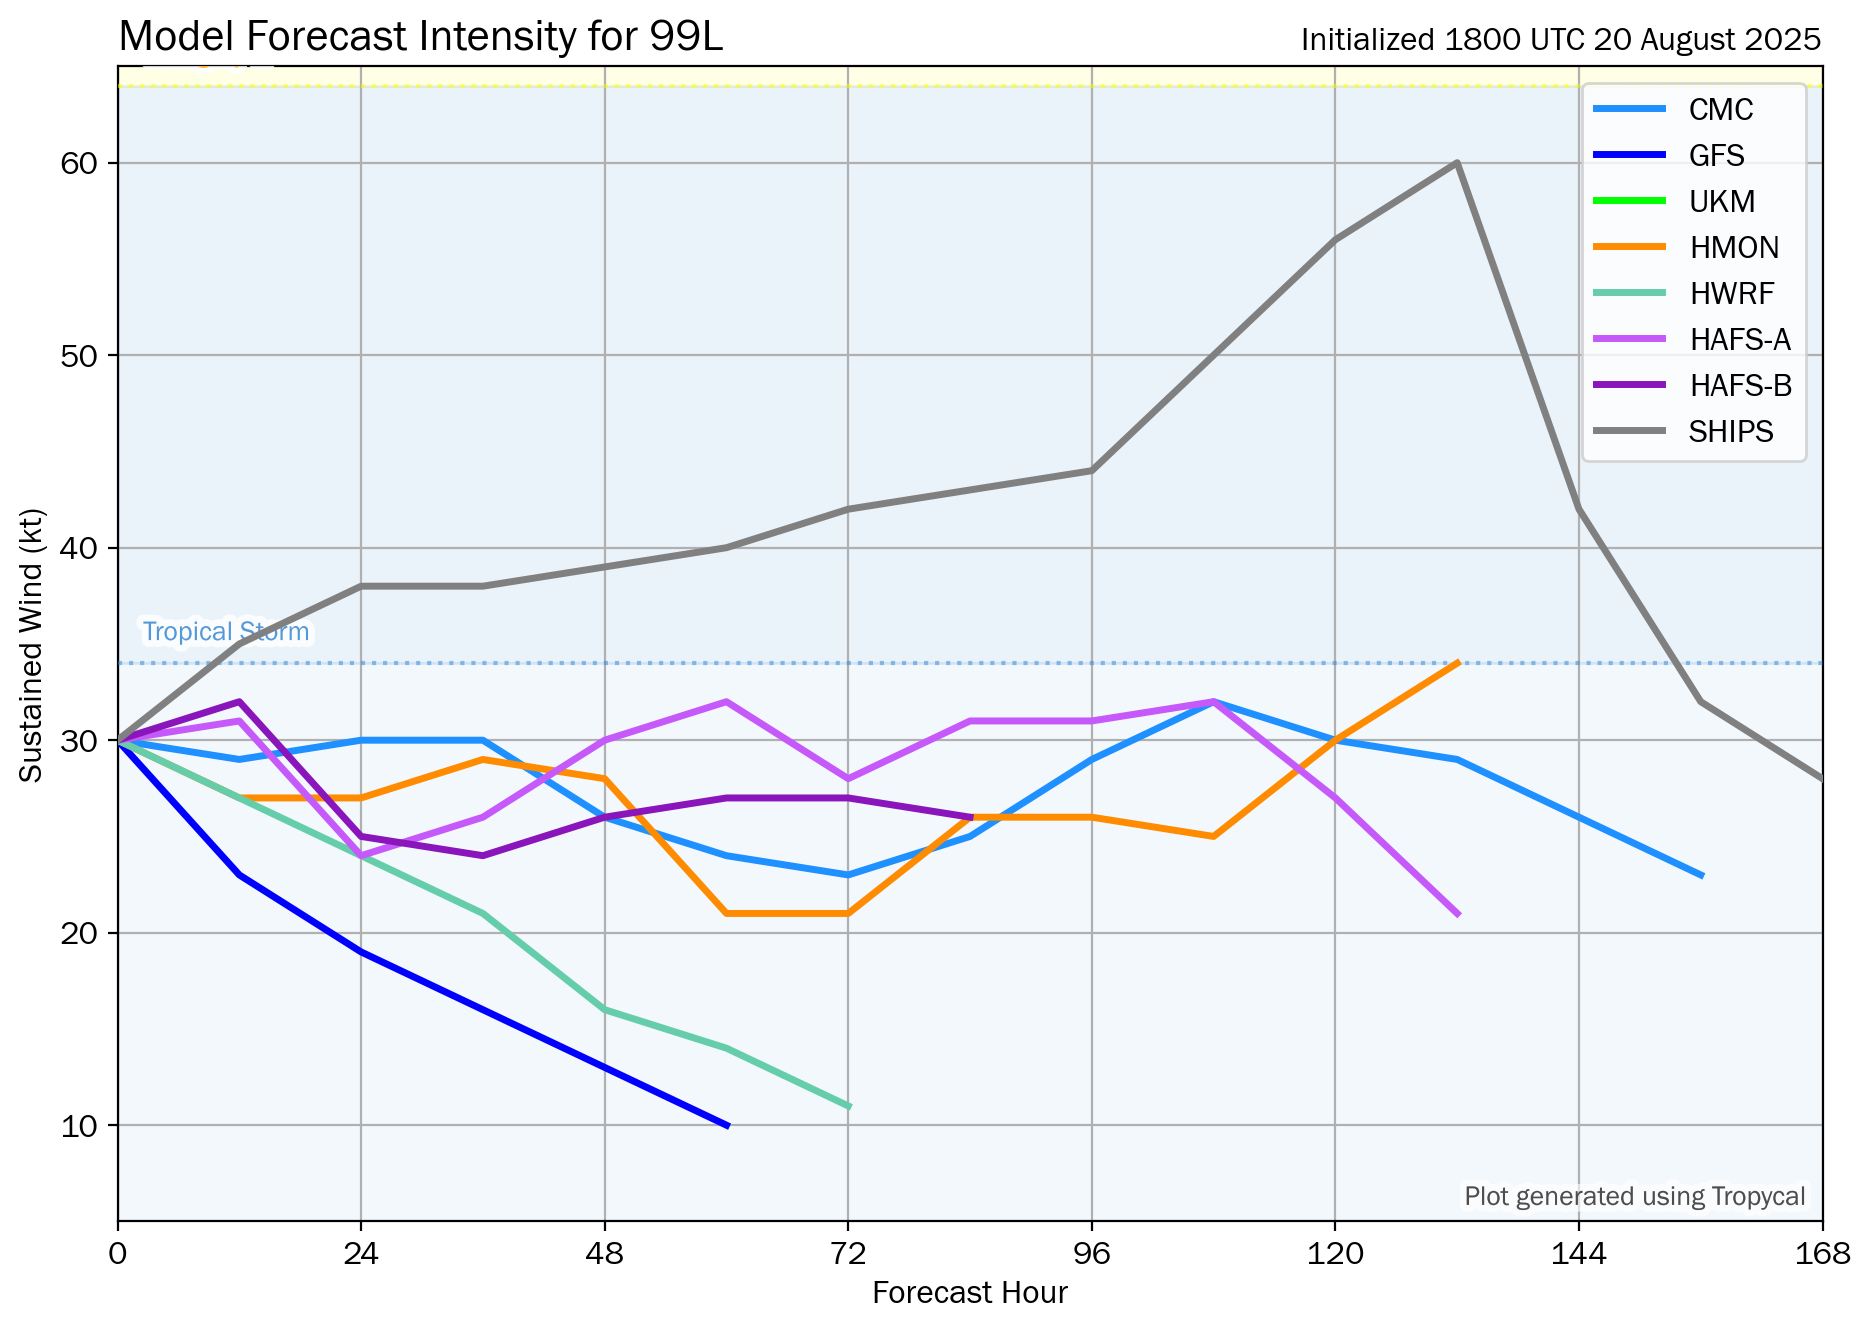
Model Intensity

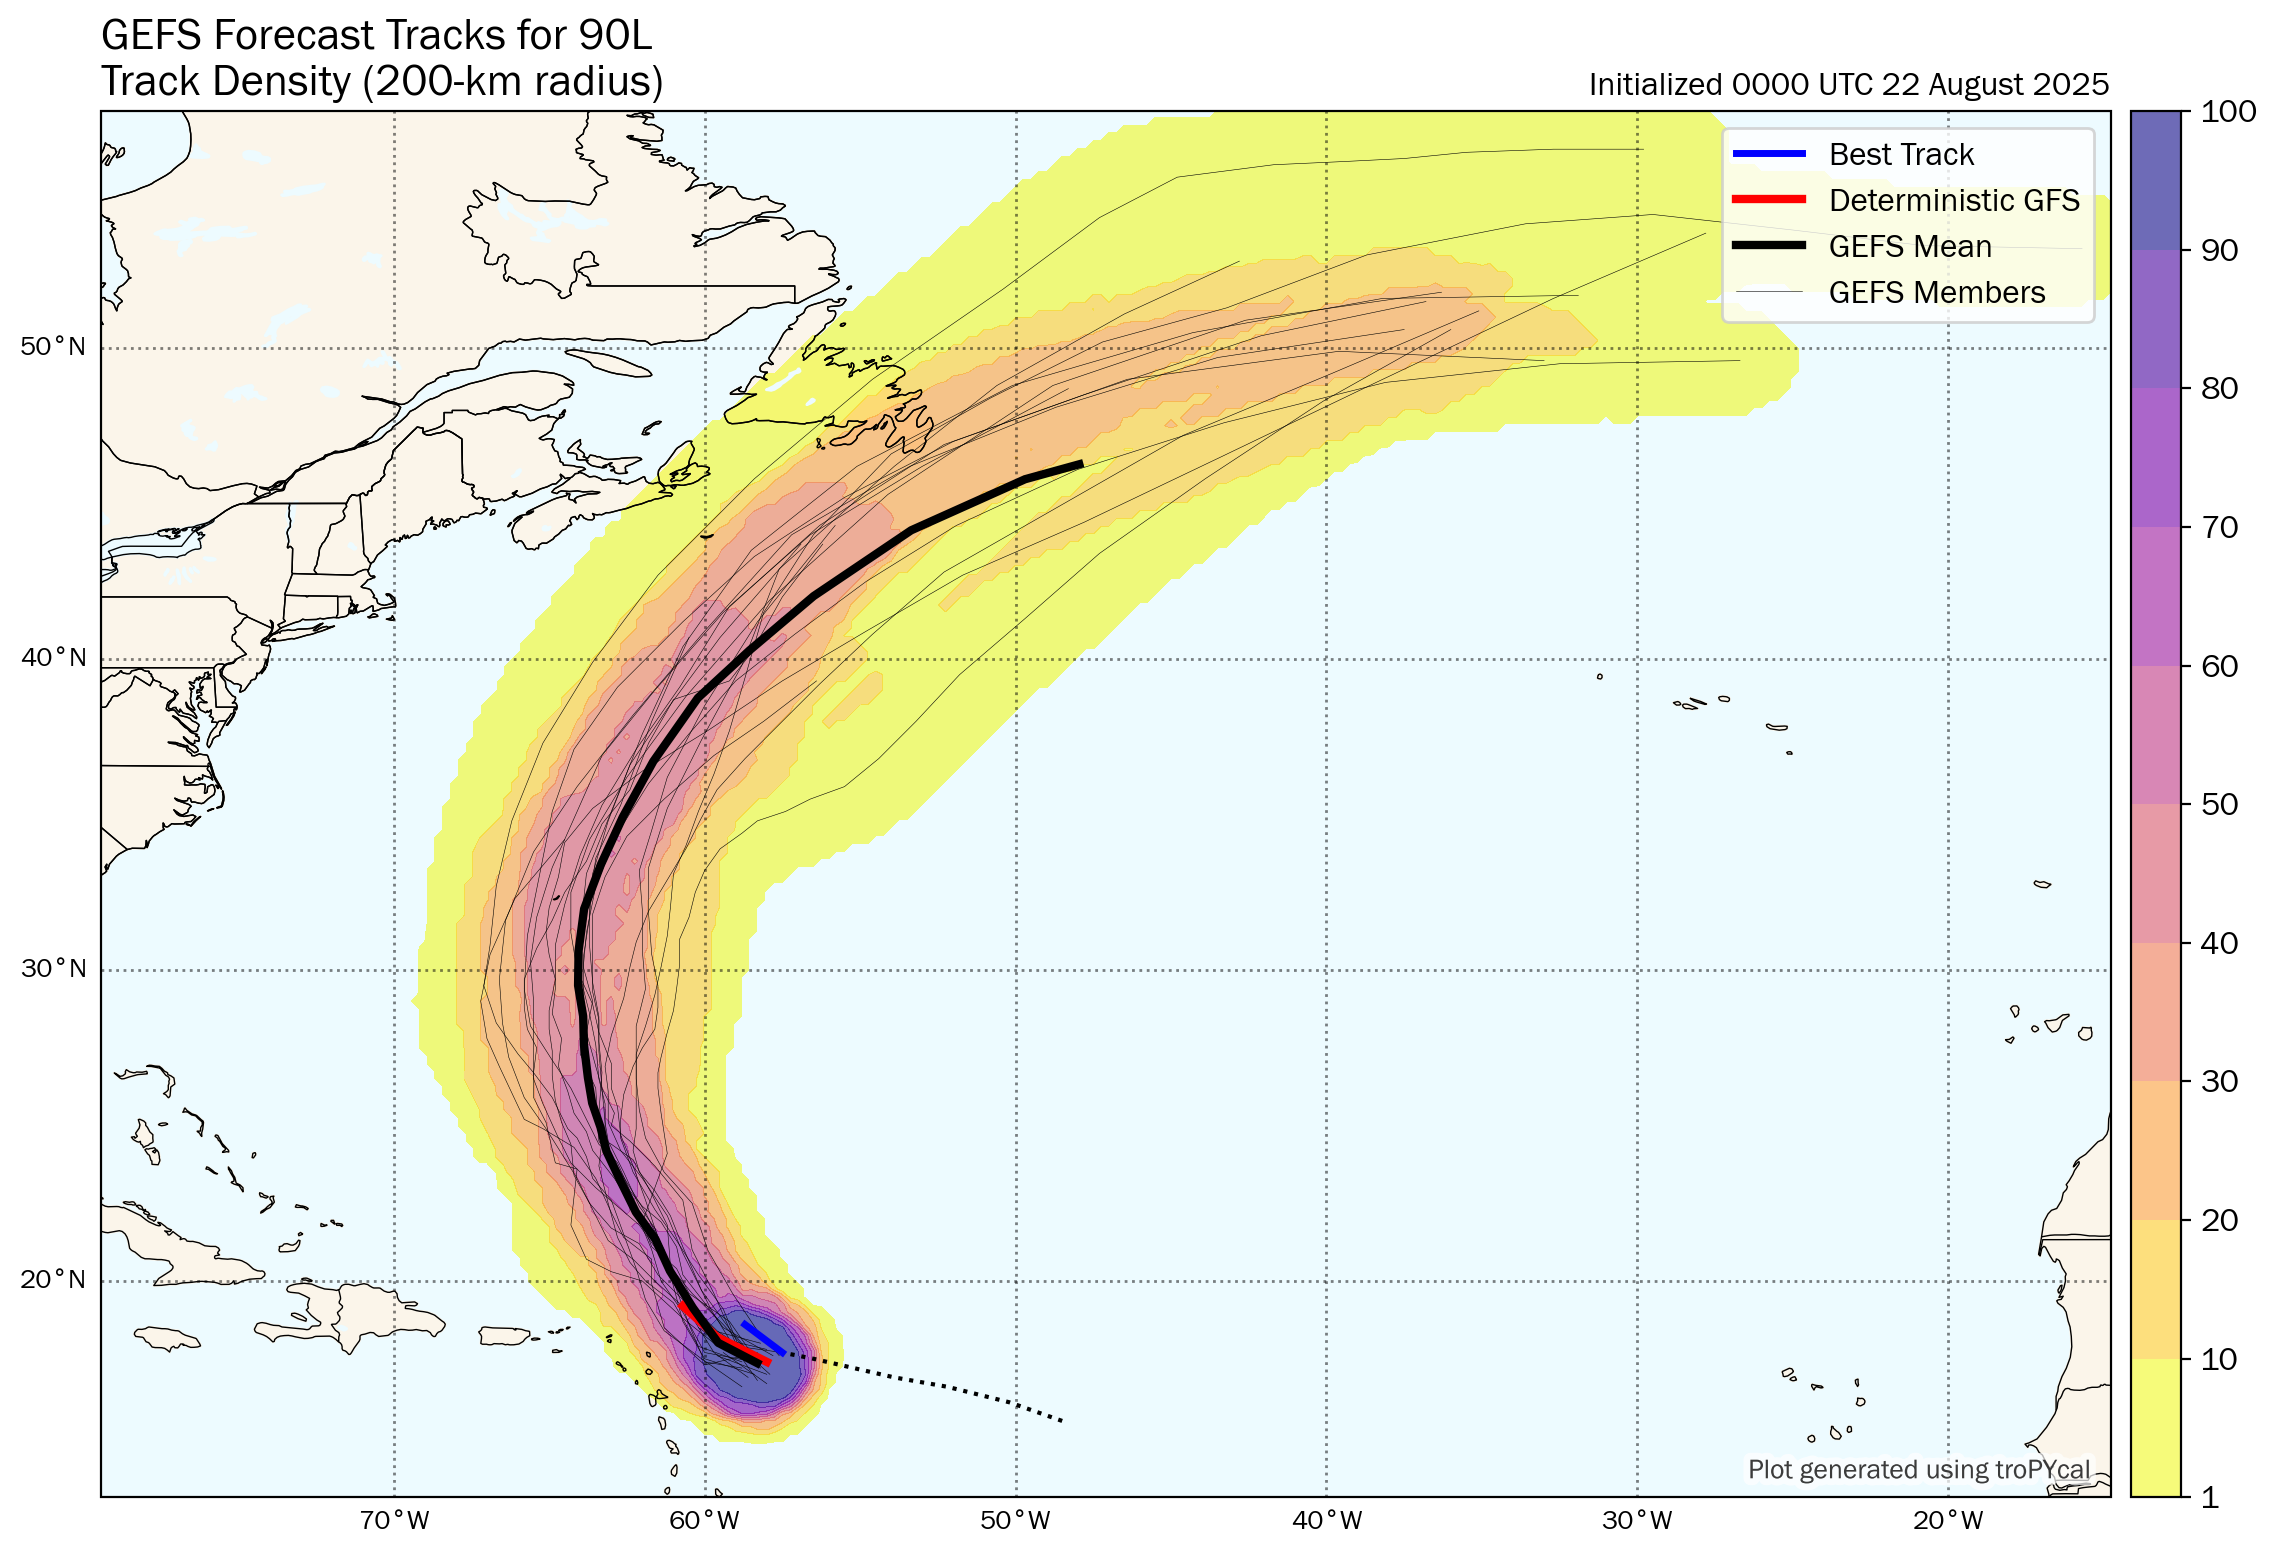
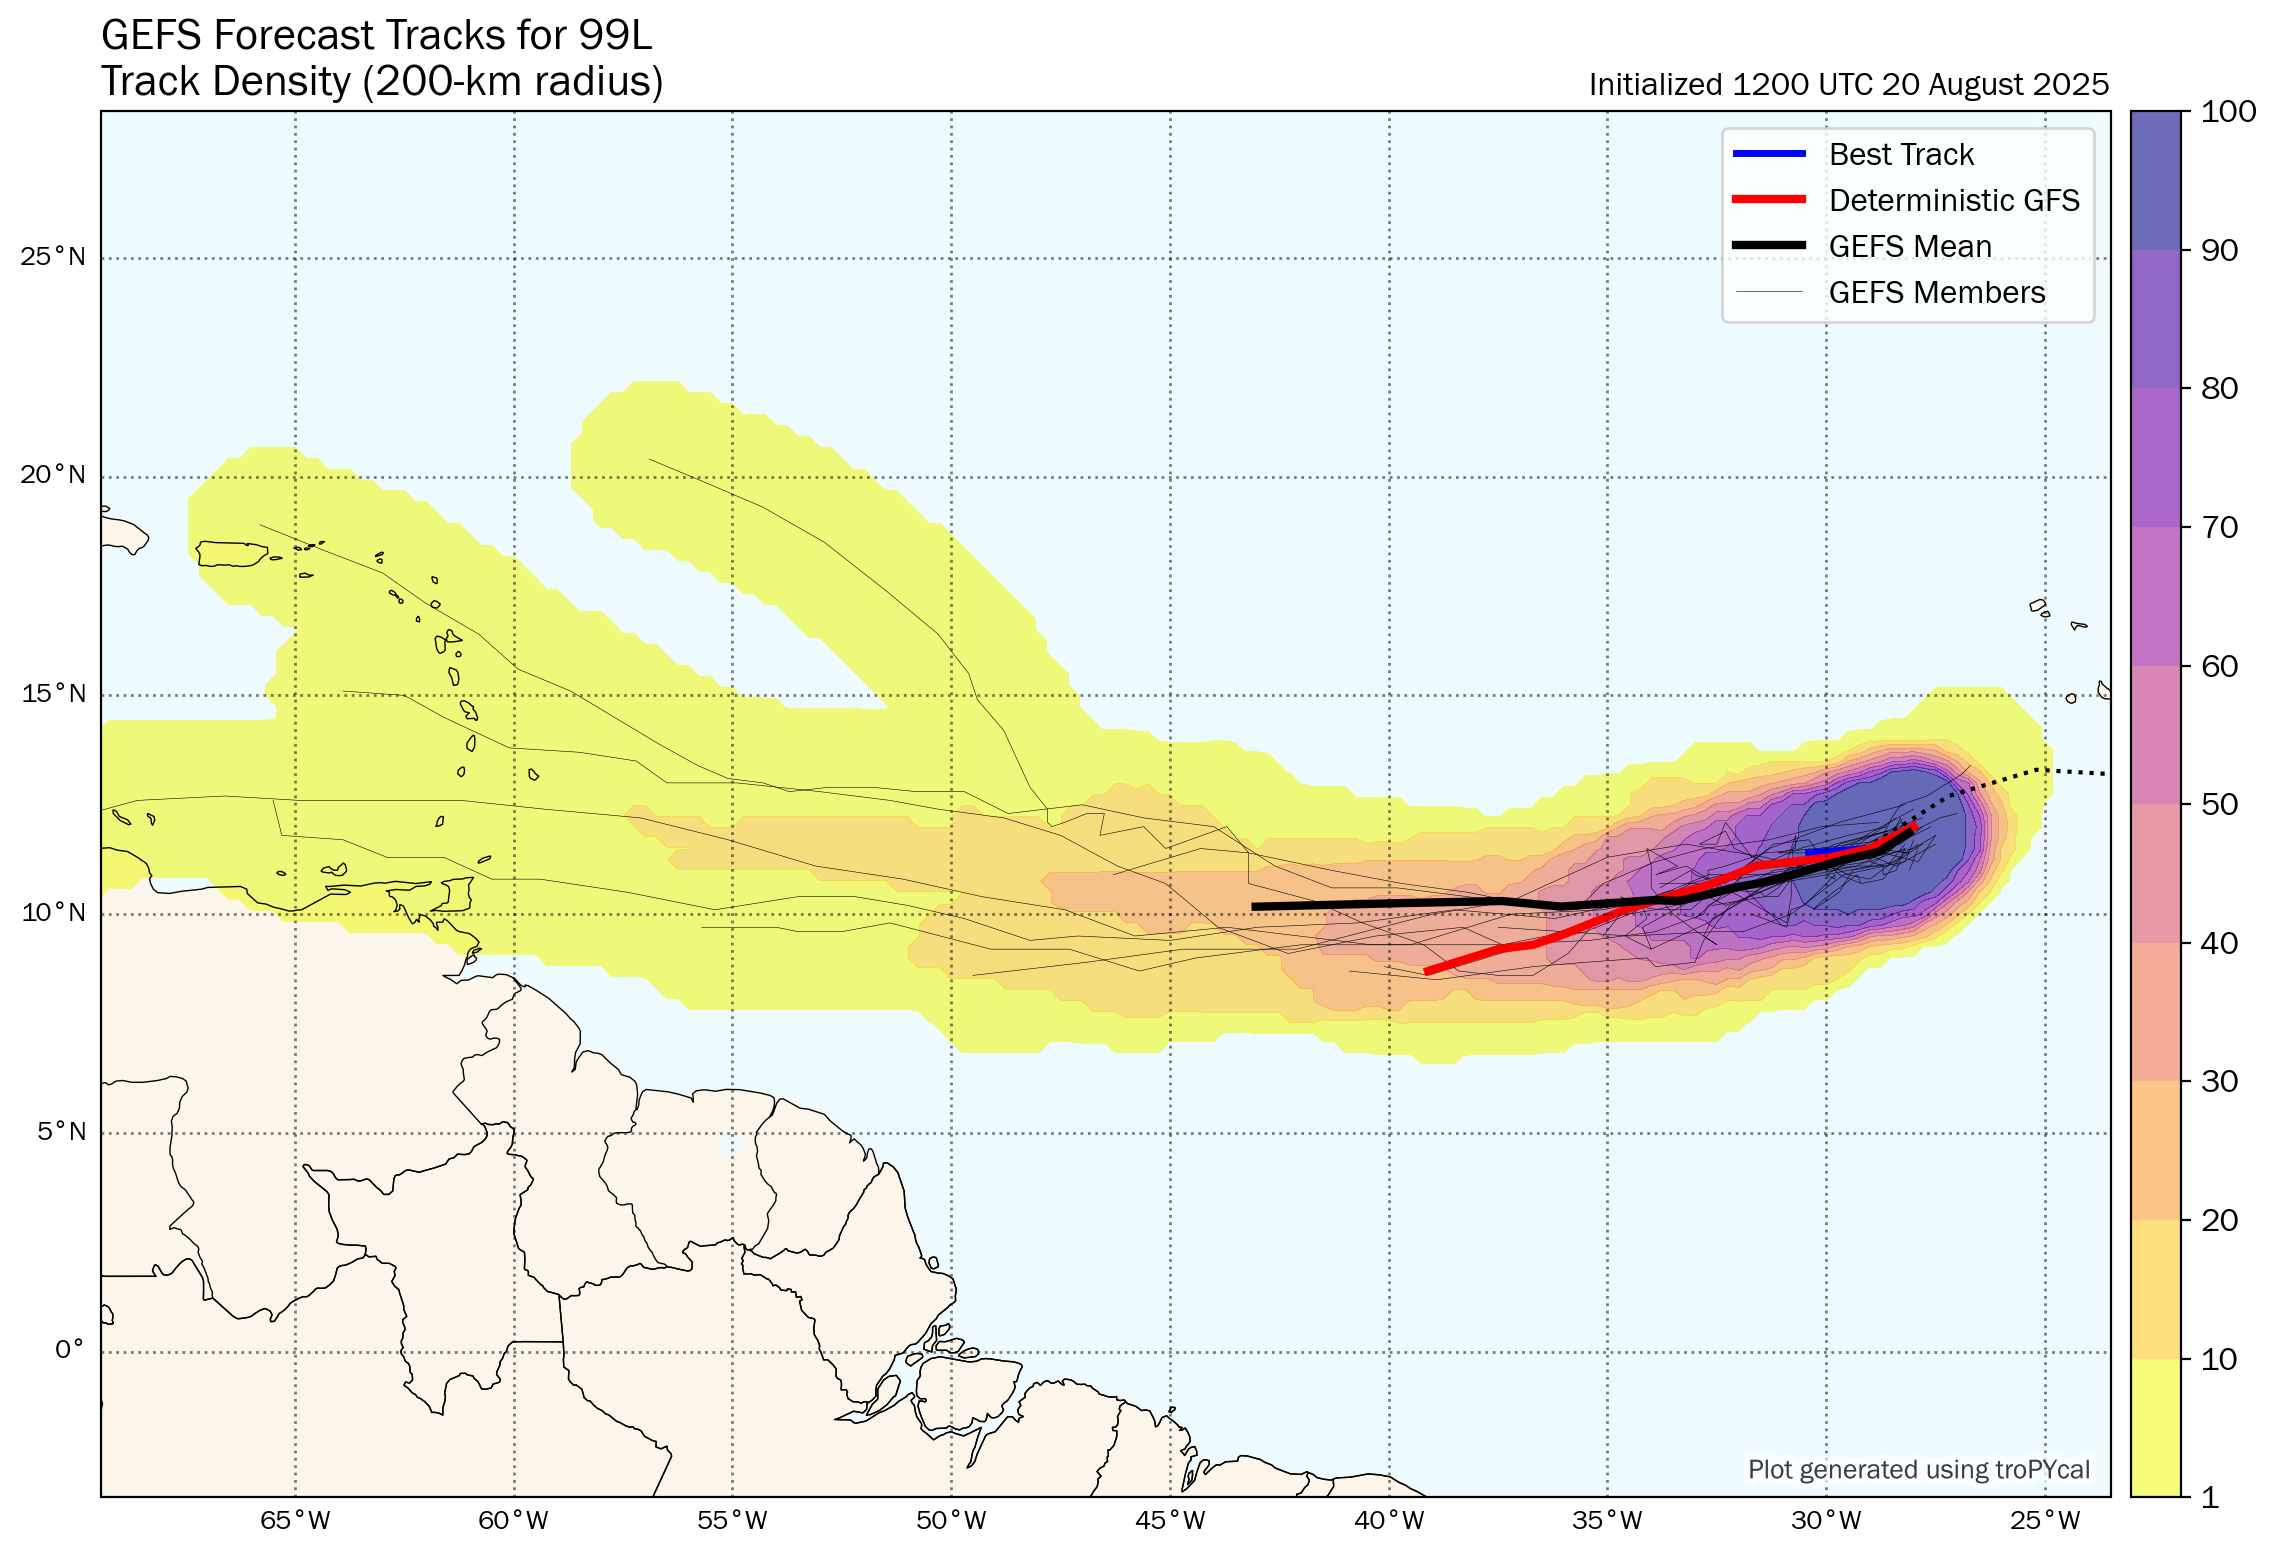
GEFS Track Density
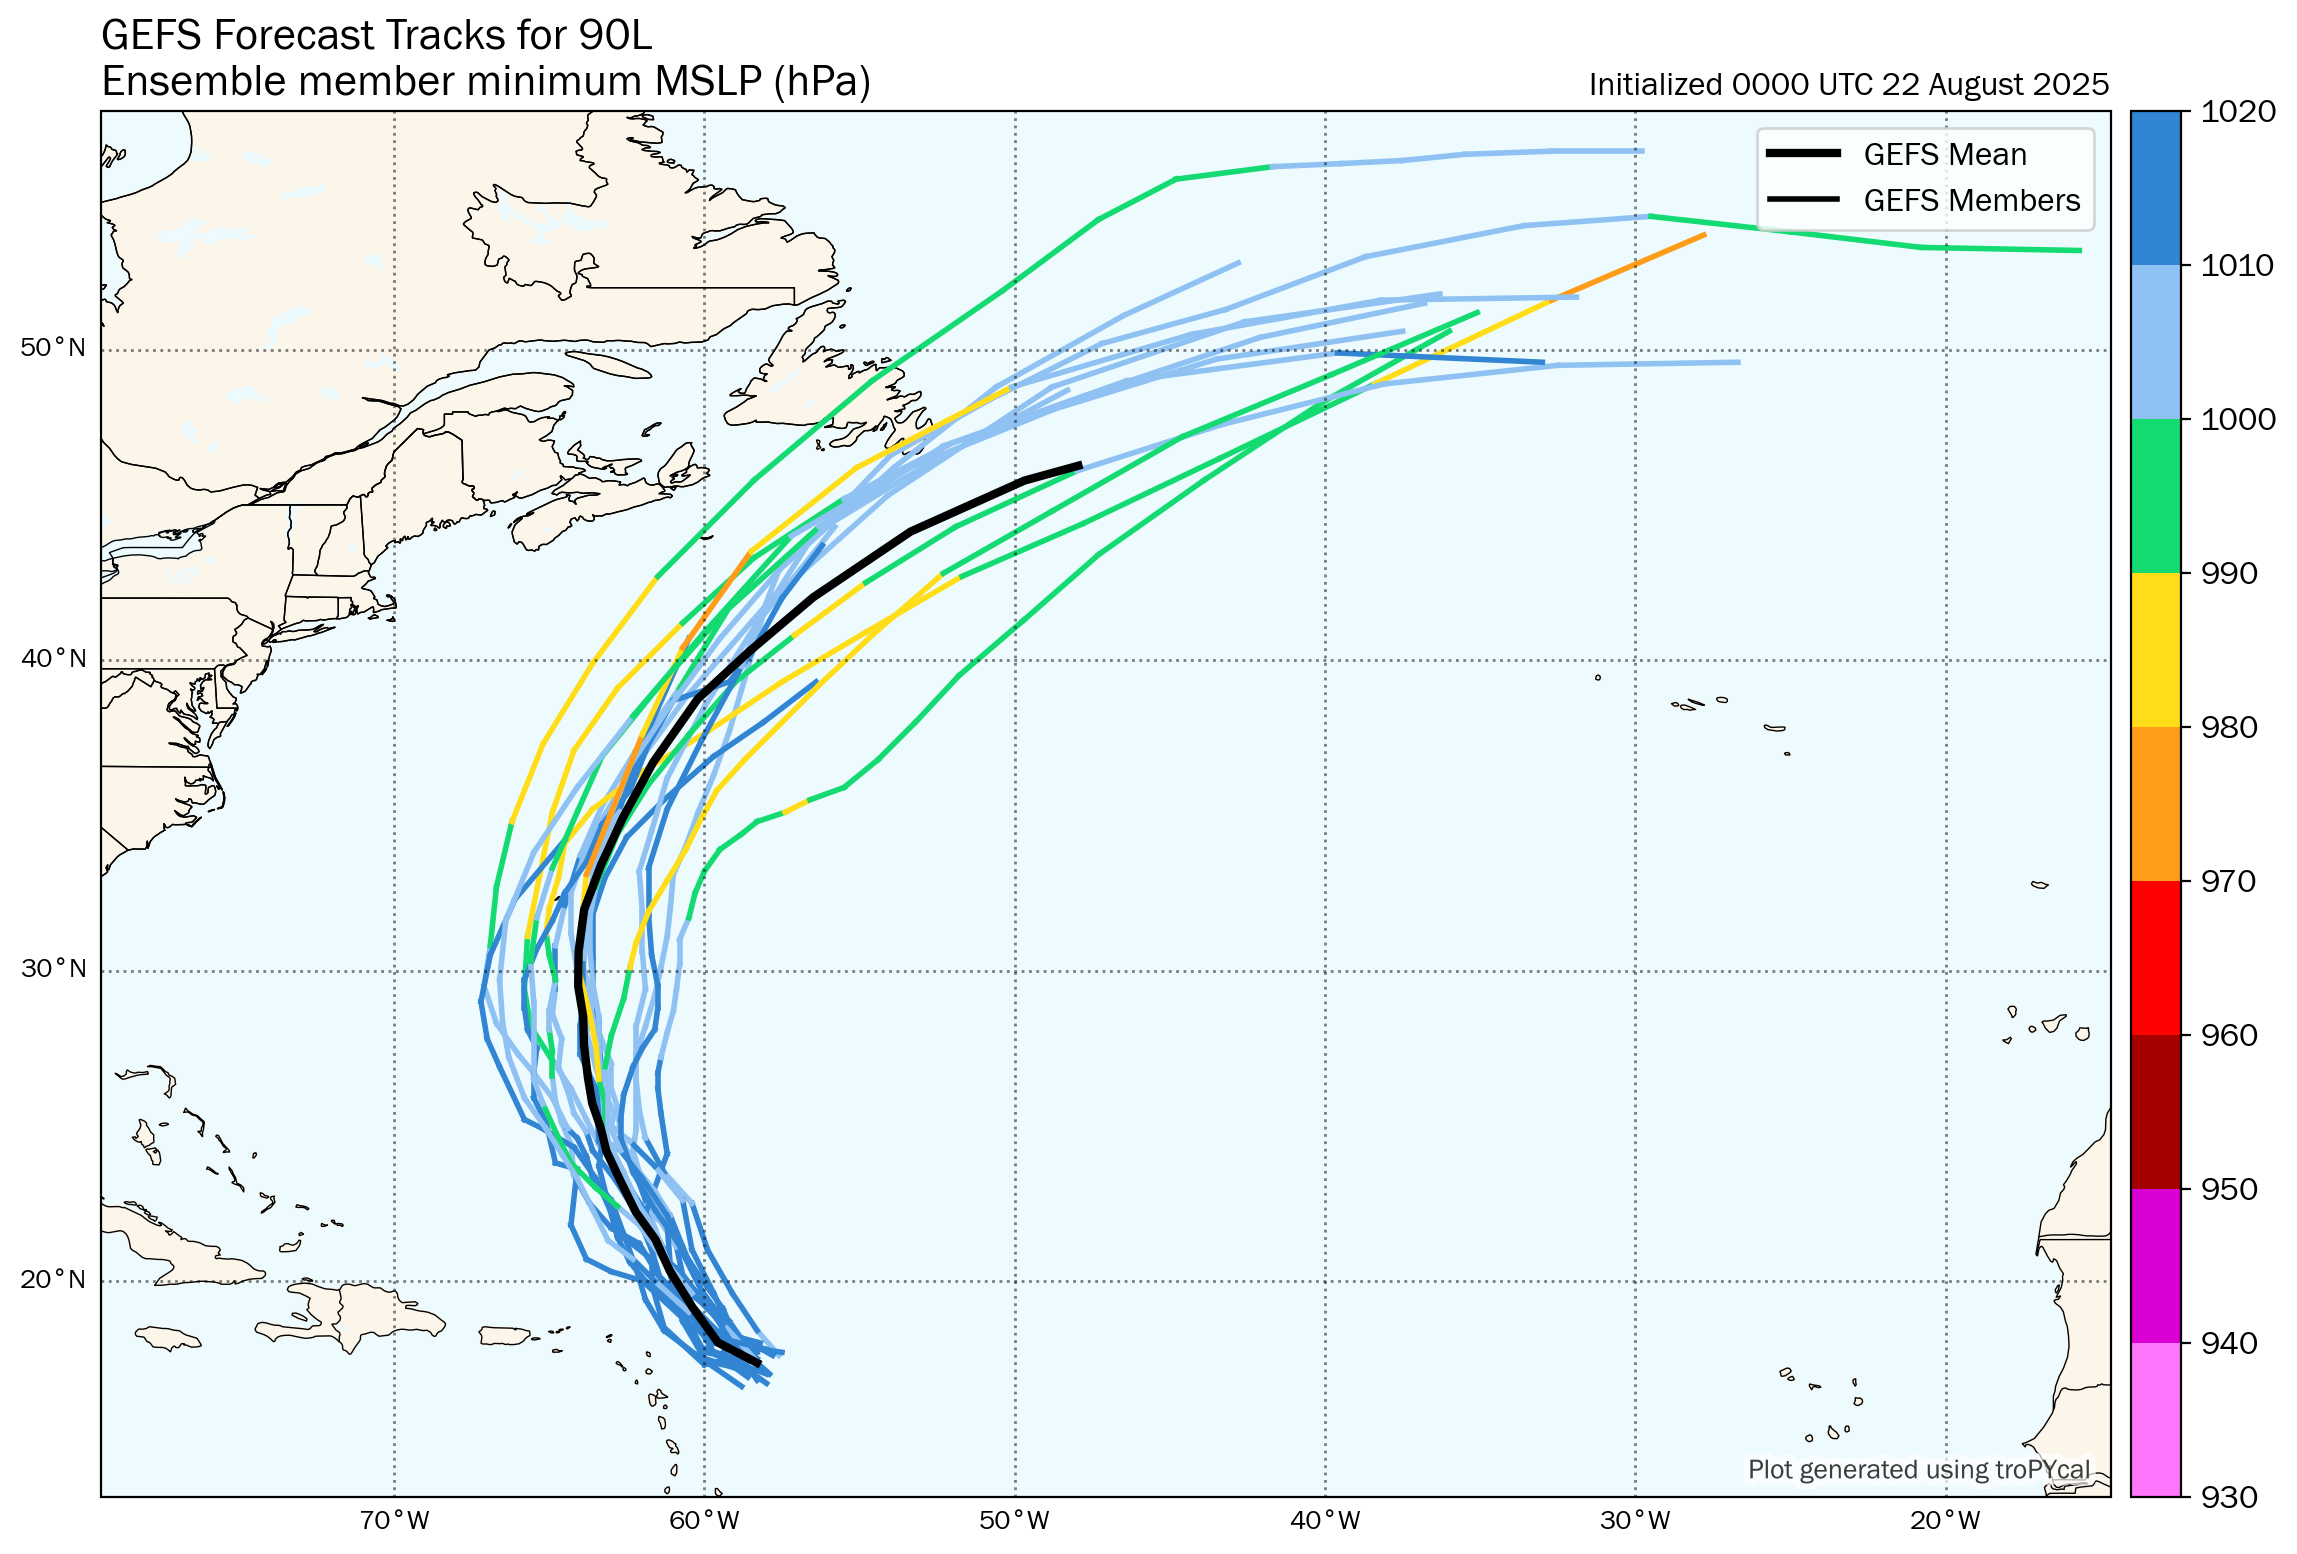
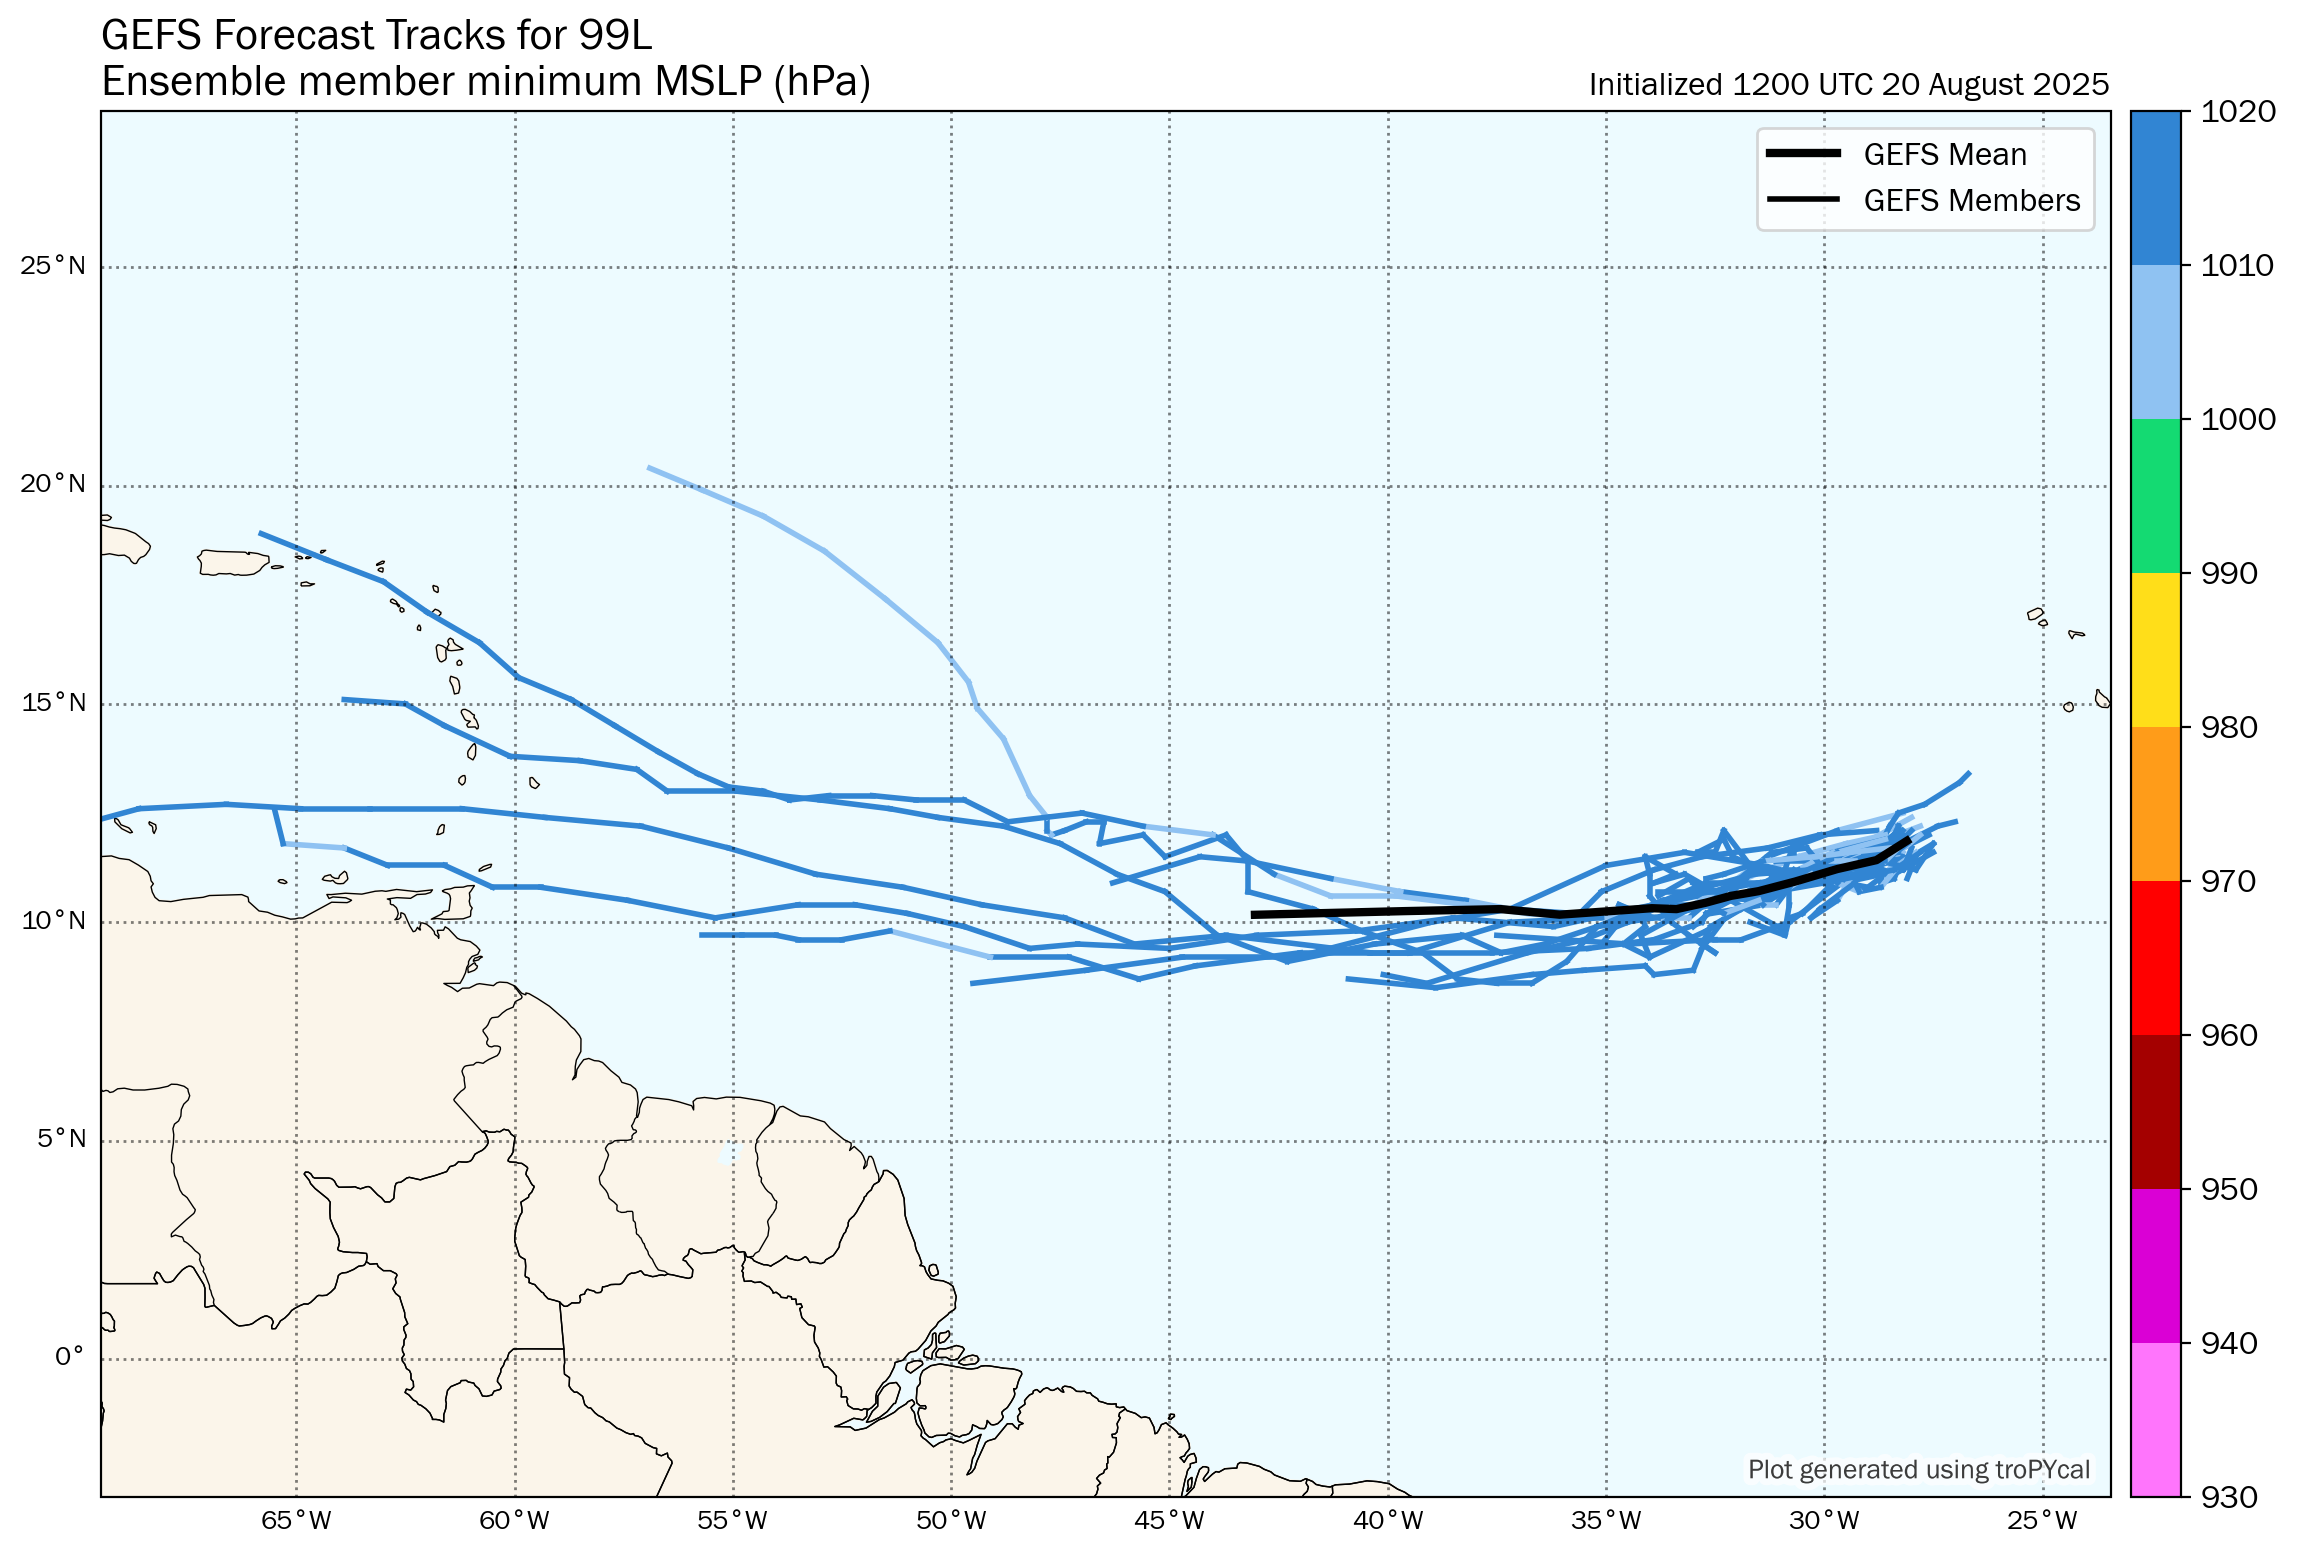
GEFS Tracks (MSLP)
Summary Plot
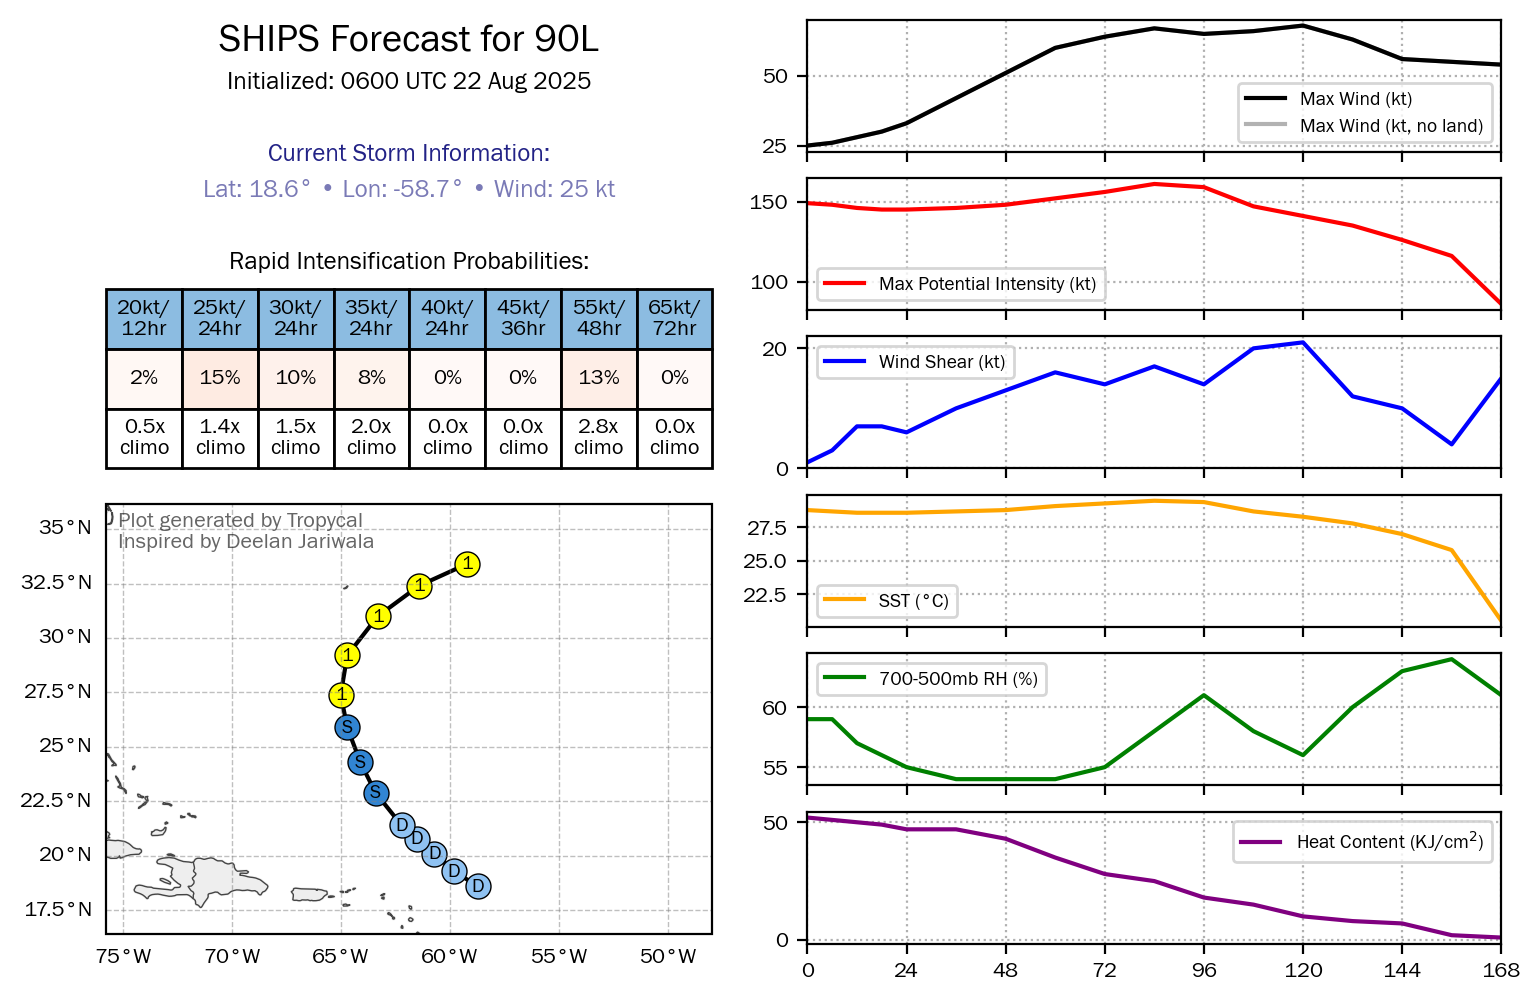
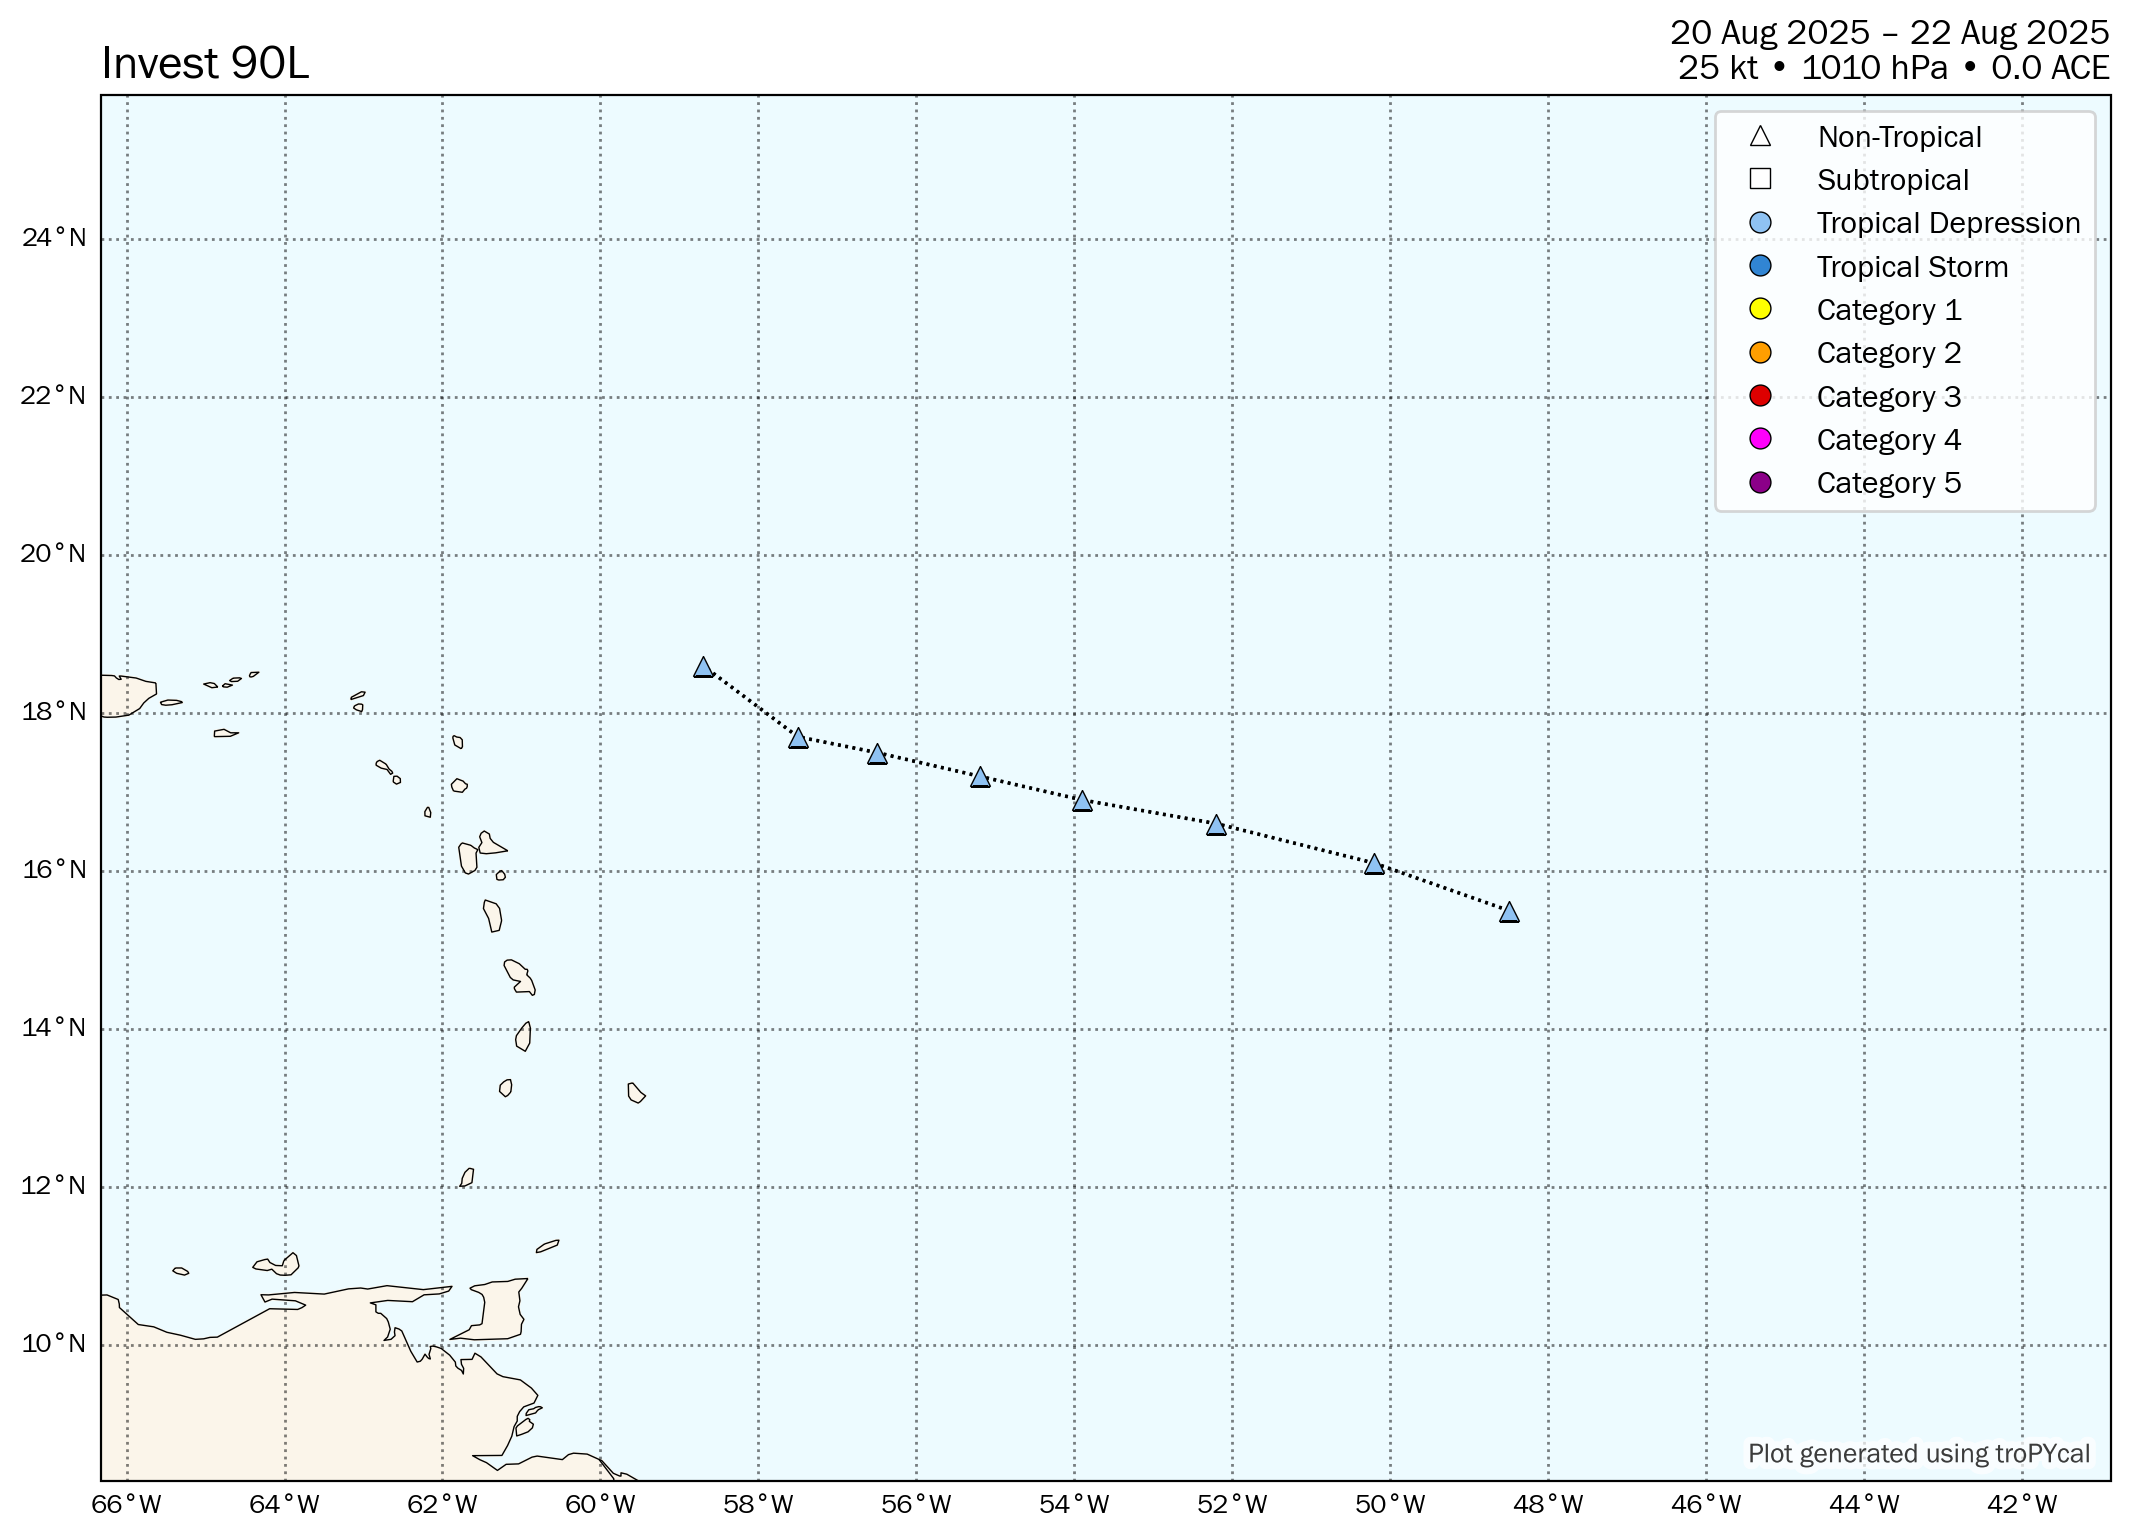
| Time (UTC) | Lat | Lon | Wind (mph) | Pressure | Storm Type | Category |
|---|---|---|---|---|---|---|
| 1200 UTC 20 Aug | 15.5 | -48.5 | 30 | 1012 | Disturbance | - |
| 1800 UTC 20 Aug | 16.1 | -50.2 | 20 | 1012 | Disturbance | - |
| 0000 UTC 21 Aug | 16.6 | -52.2 | 20 | 1012 | Disturbance | - |
| 0600 UTC 21 Aug | 16.9 | -53.9 | 30 | 1011 | Disturbance | - |
| 1200 UTC 21 Aug | 17.2 | -55.2 | 30 | 1011 | Disturbance | - |
| 1800 UTC 21 Aug | 17.5 | -56.5 | 30 | 1010 | Disturbance | - |
| 0000 UTC 22 Aug | 17.7 | -57.5 | 30 | 1010 | Disturbance | - |
Model Tracks
Model Intensity
GEFS Track Density
GEFS Tracks (MSLP)
Summary Plot
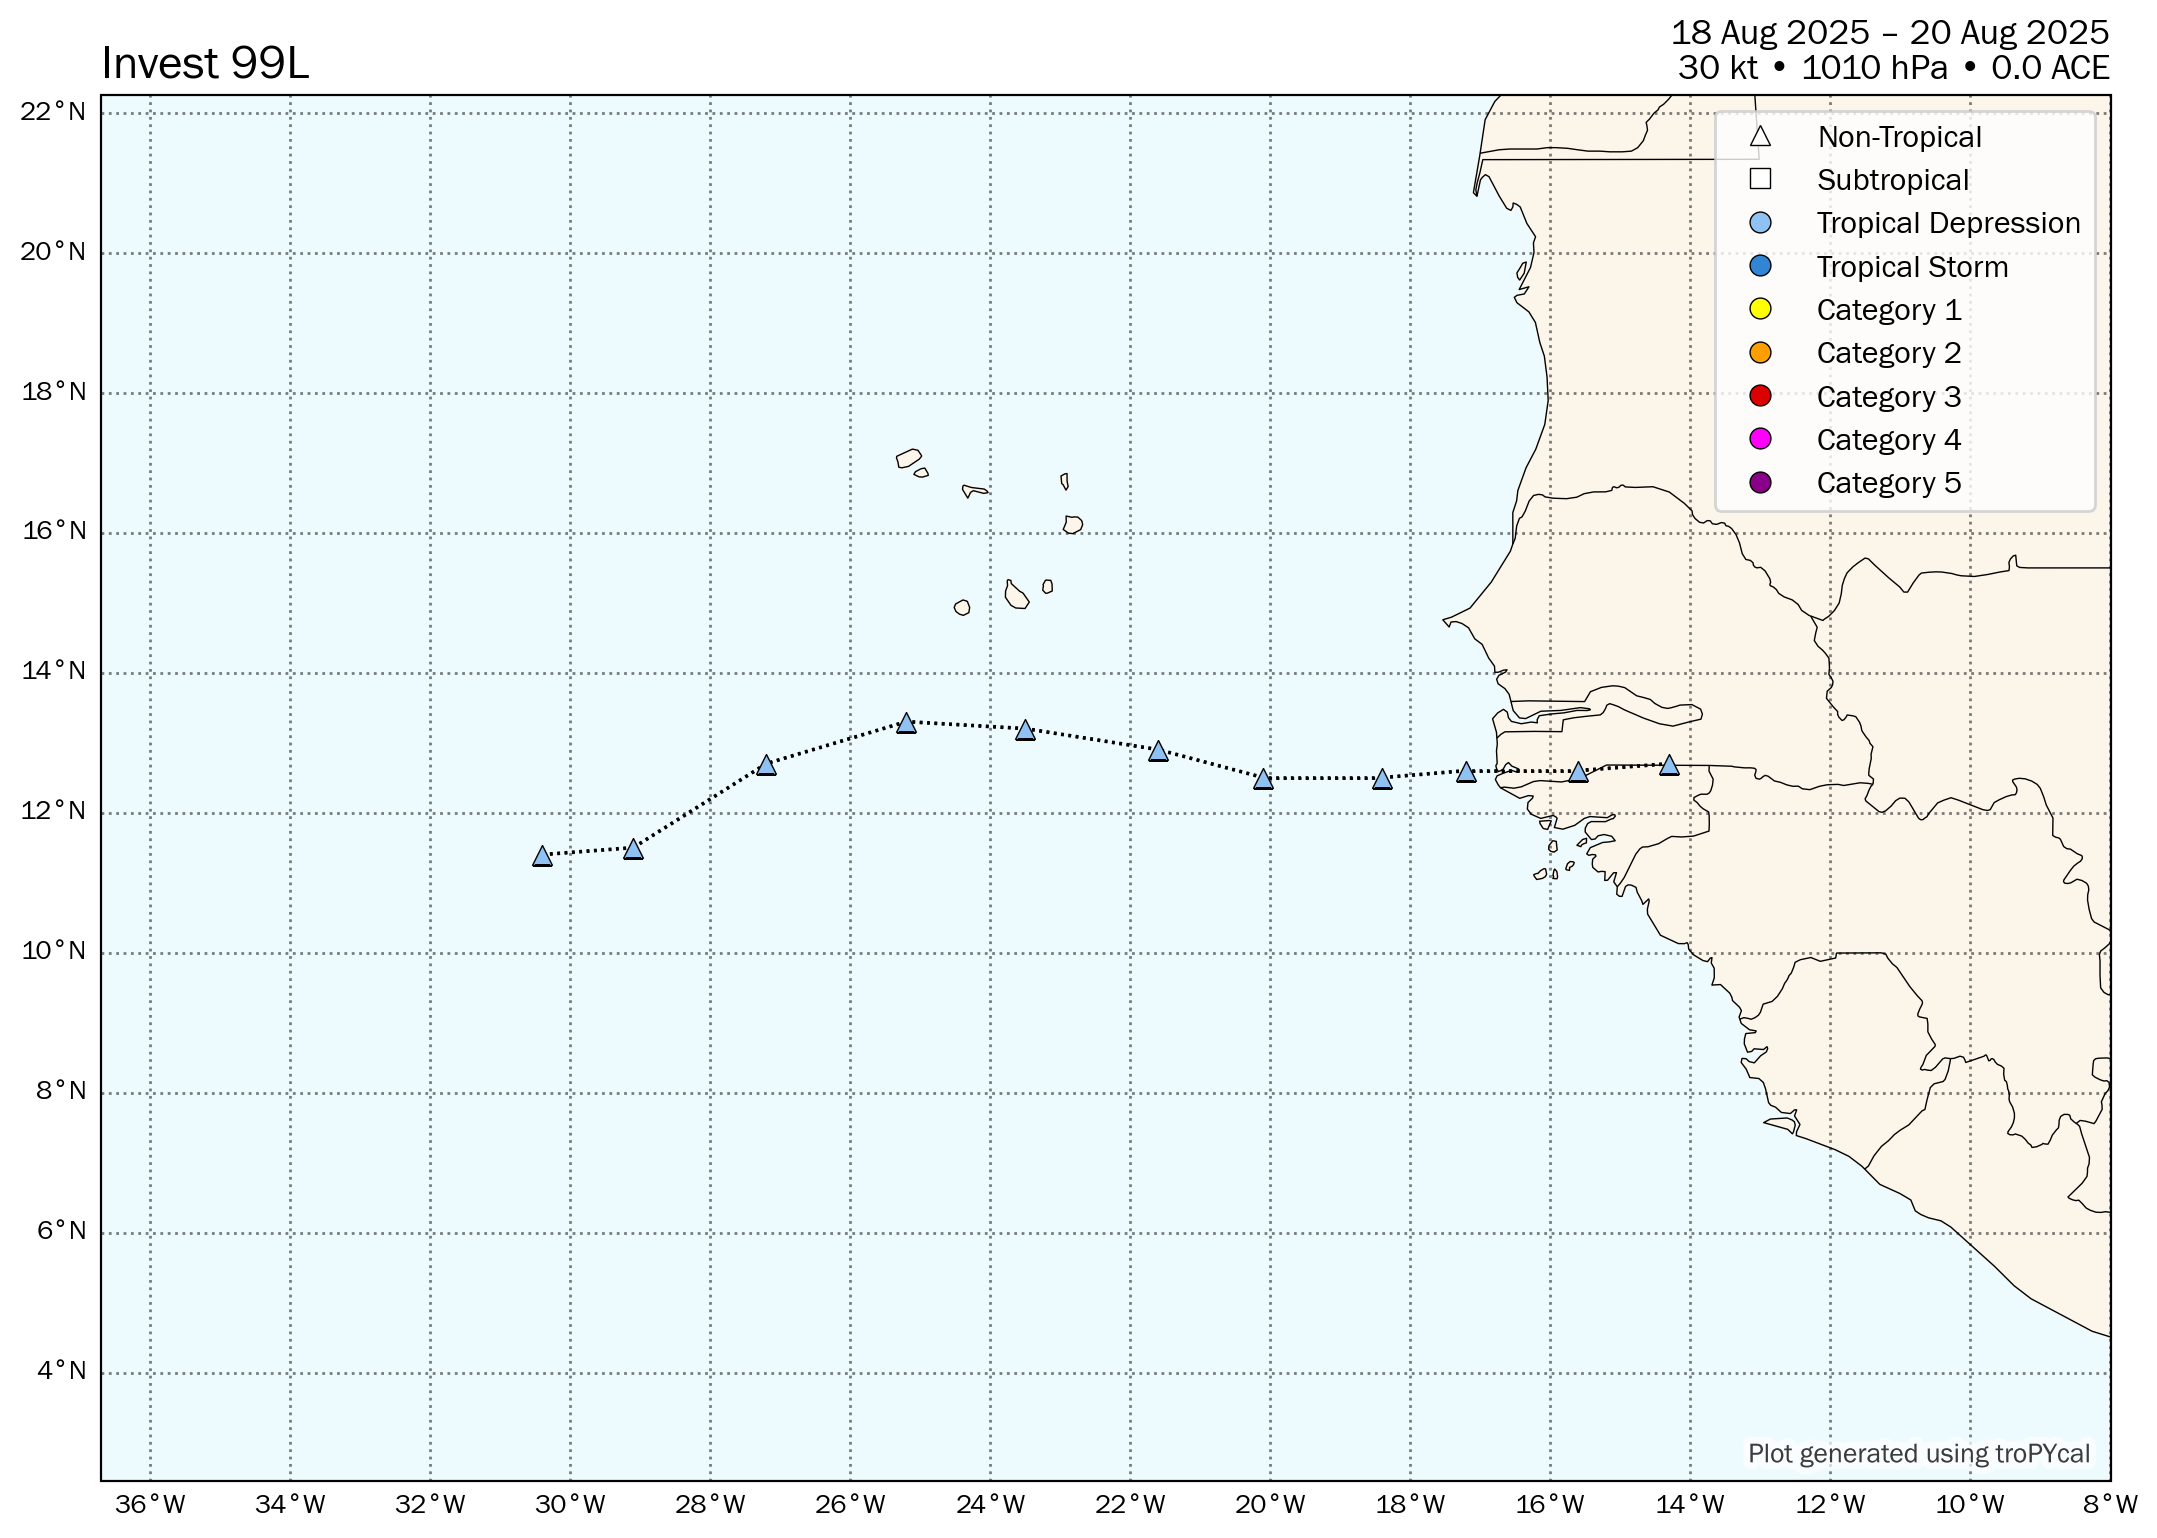
| Time (UTC) | Lat | Lon | Wind (mph) | Pressure | Storm Type | Category |
|---|---|---|---|---|---|---|
| 0600 UTC 18 Aug | 12.7 | -14.3 | 30 | 1012 | Disturbance | - |
| 1200 UTC 18 Aug | 12.6 | -15.6 | 30 | 1012 | Disturbance | - |
| 1800 UTC 18 Aug | 12.6 | -17.2 | 30 | 1010 | Disturbance | - |
| 0000 UTC 19 Aug | 12.5 | -18.4 | 35 | 1010 | Disturbance | - |
| 0600 UTC 19 Aug | 12.5 | -20.1 | 35 | 1010 | Disturbance | - |
| 1200 UTC 19 Aug | 12.9 | -21.6 | 35 | 1010 | Disturbance | - |
| 1800 UTC 19 Aug | 13.2 | -23.5 | 35 | 1010 | Disturbance | - |
| 0000 UTC 20 Aug | 13.3 | -25.2 | 35 | 1011 | Disturbance | - |
| 0600 UTC 20 Aug | 12.7 | -27.2 | 35 | 1011 | Disturbance | - |
| 1200 UTC 20 Aug | 11.5 | -29.1 | 35 | 1011 | Disturbance | - |
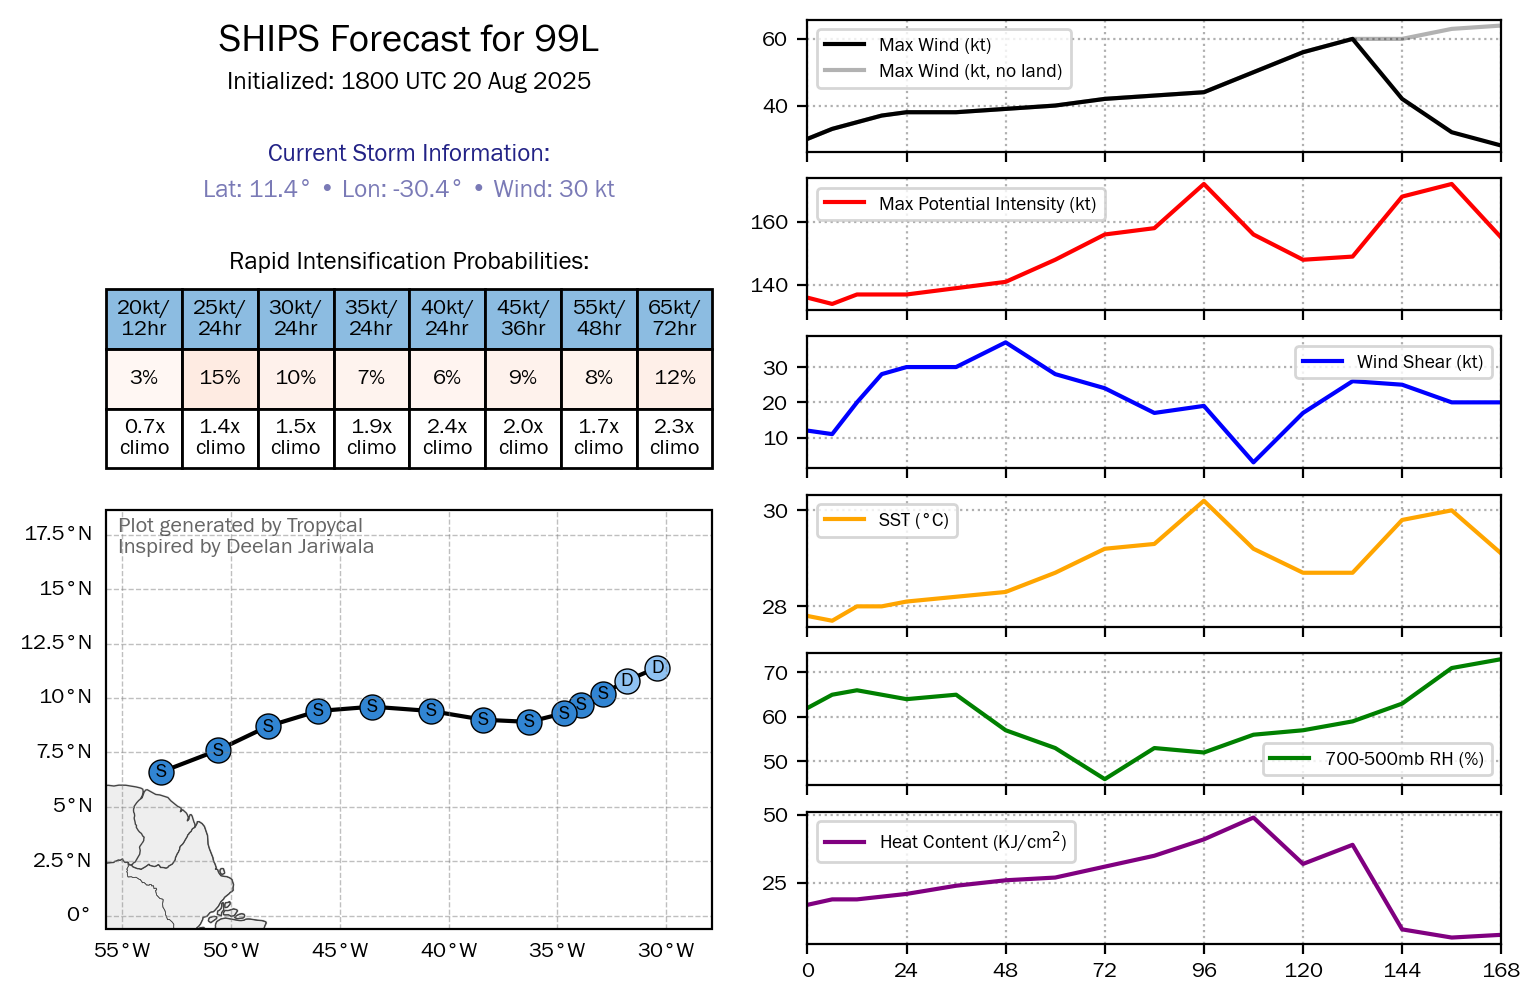
| 1800 UTC 20 Aug | 11.4 | -30.4 | 35 | 1011 | Disturbance | - |
| 0000 UTC 21 Aug | 11.3 | -31.3 | 35 | 1011 | Disturbance | - |
| 0600 UTC 21 Aug | 11.3 | -32.5 | 35 | 1010 | Disturbance | - |
| 1200 UTC 21 Aug | 10.9 | -33.7 | 35 | 1011 | Disturbance | - |
| 1800 UTC 21 Aug | 10.4 | -35.4 | 35 | 1010 | Disturbance | - |
| 0000 UTC 22 Aug | 10.2 | -37.1 | 35 | 1010 | Disturbance | - |
| Time (UTC) | Lat | Lon | Wind (mph) | Pressure | Storm Type | Category |
|---|---|---|---|---|---|---|
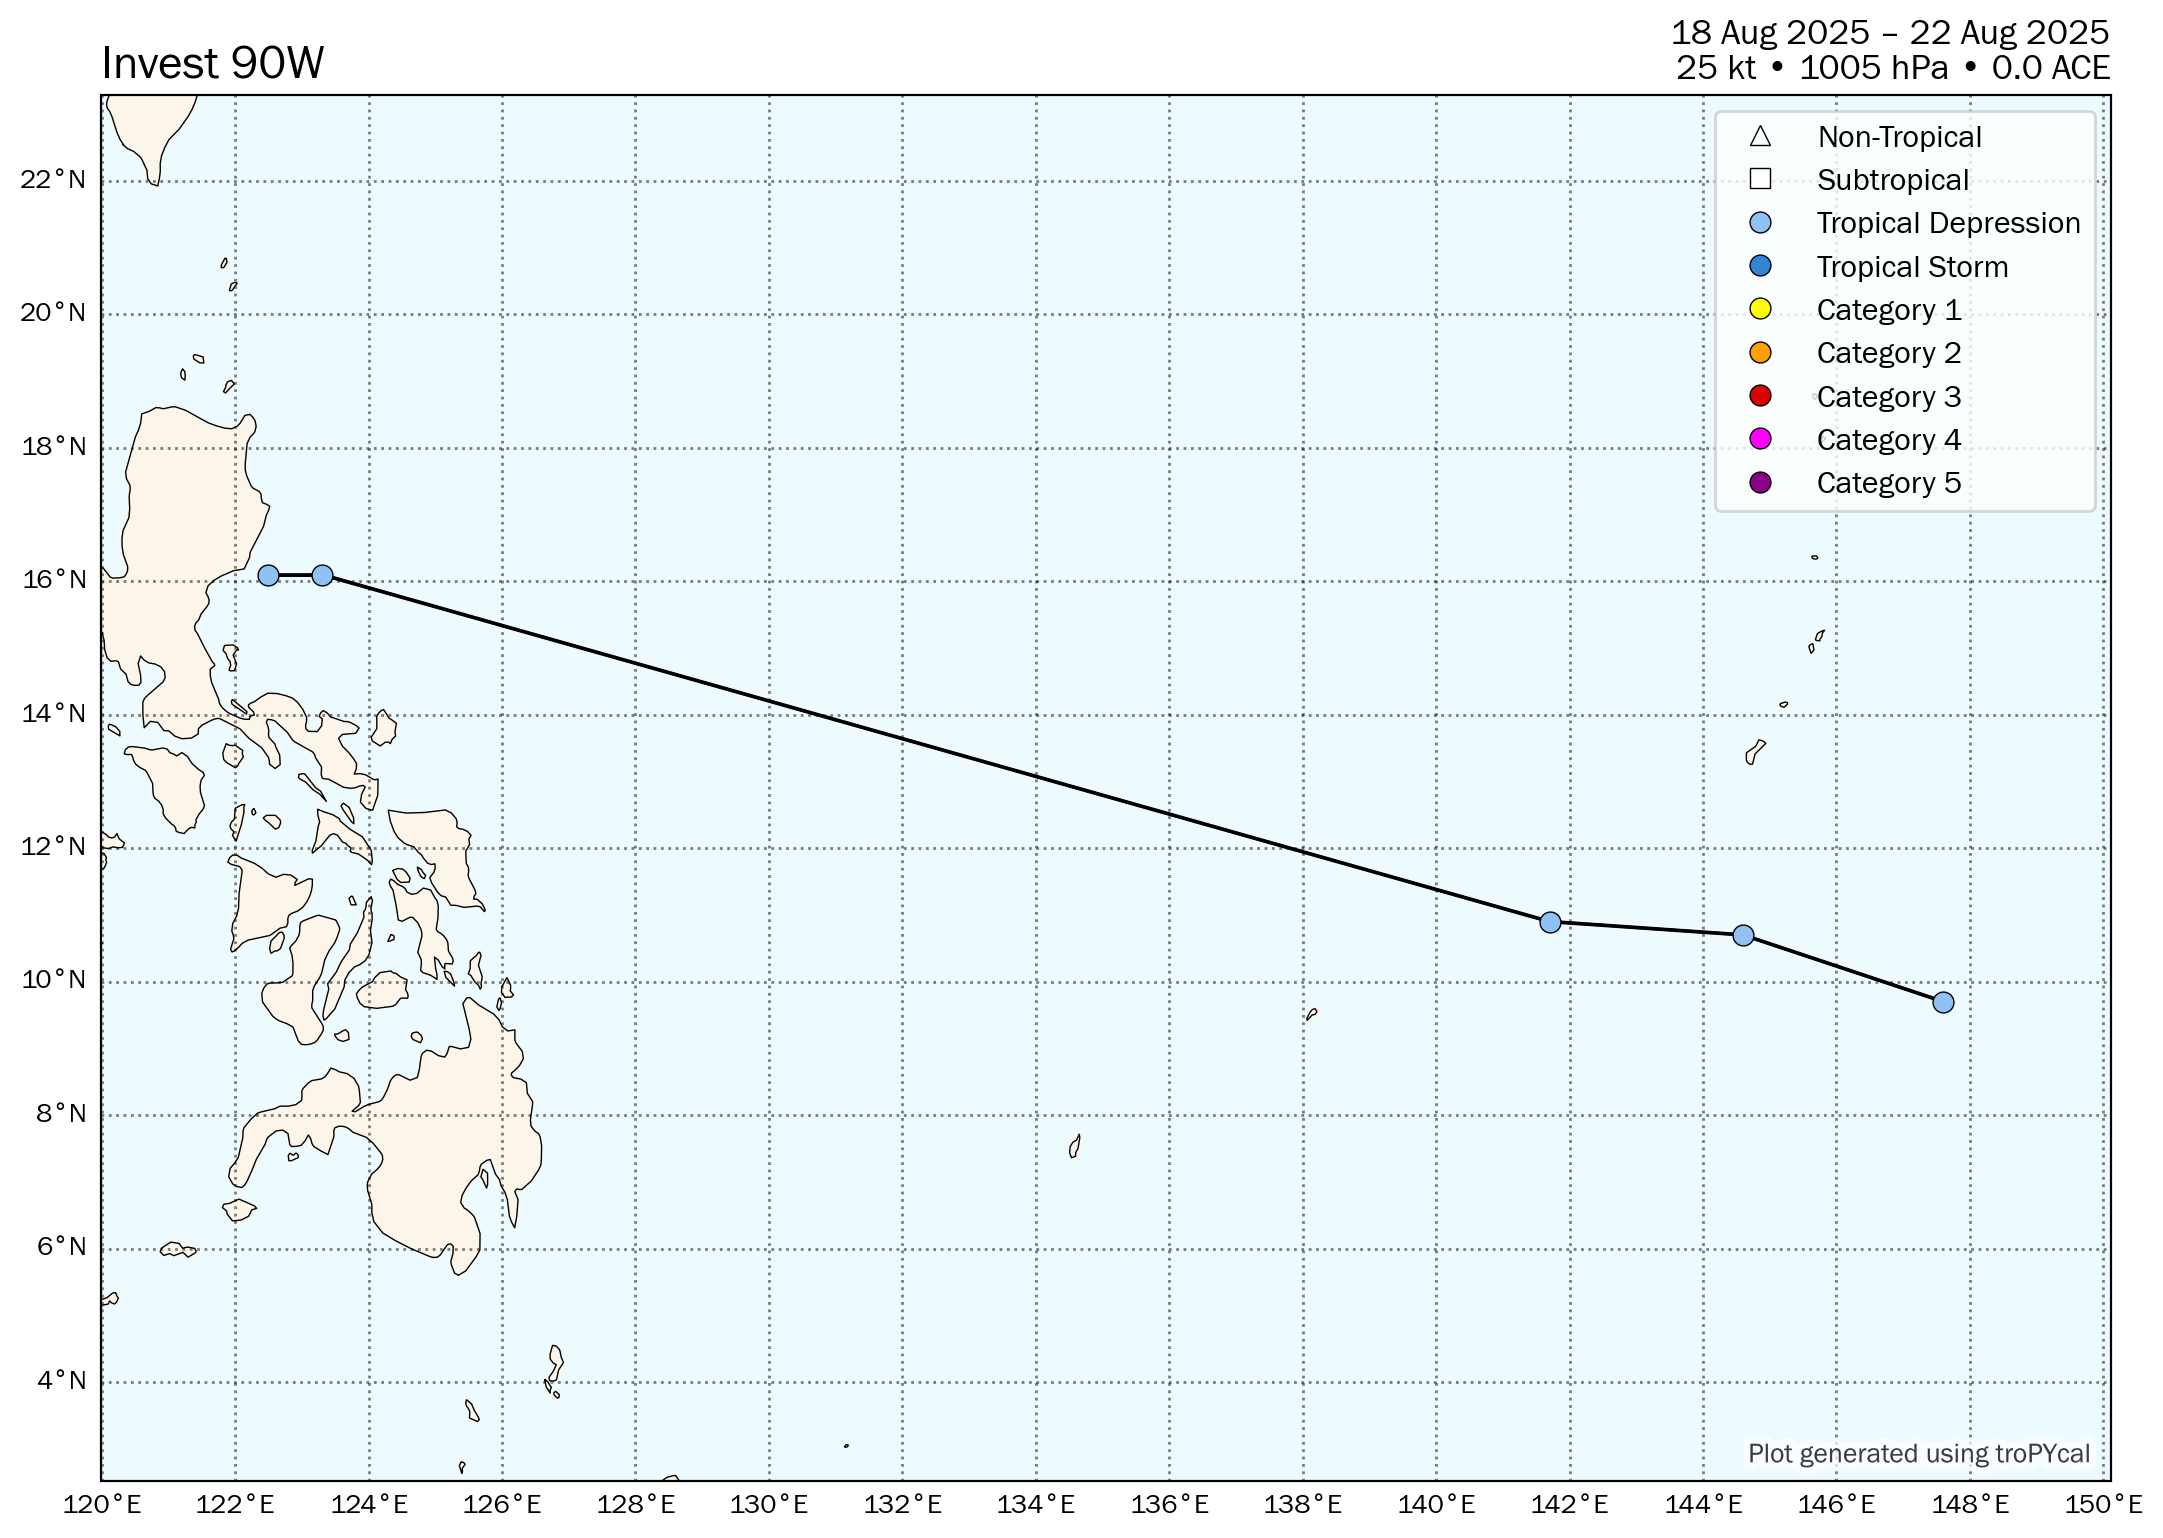
| 0600 UTC 18 Aug | 9.7 | 147.6 | 25 | 1008 | Tropical Depression | - |
| 1200 UTC 18 Aug | 10.7 | 144.6 | 25 | 1008 | Tropical Depression | - |
| 1800 UTC 18 Aug | 10.9 | 141.7 | 25 | 1008 | Tropical Depression | - |
| 1800 UTC 21 Aug | 16.1 | 123.3 | 25 | 1006 | Tropical Depression | - |
| 0000 UTC 22 Aug | 16.1 | 122.5 | 30 | 1005 | Tropical Depression | - |