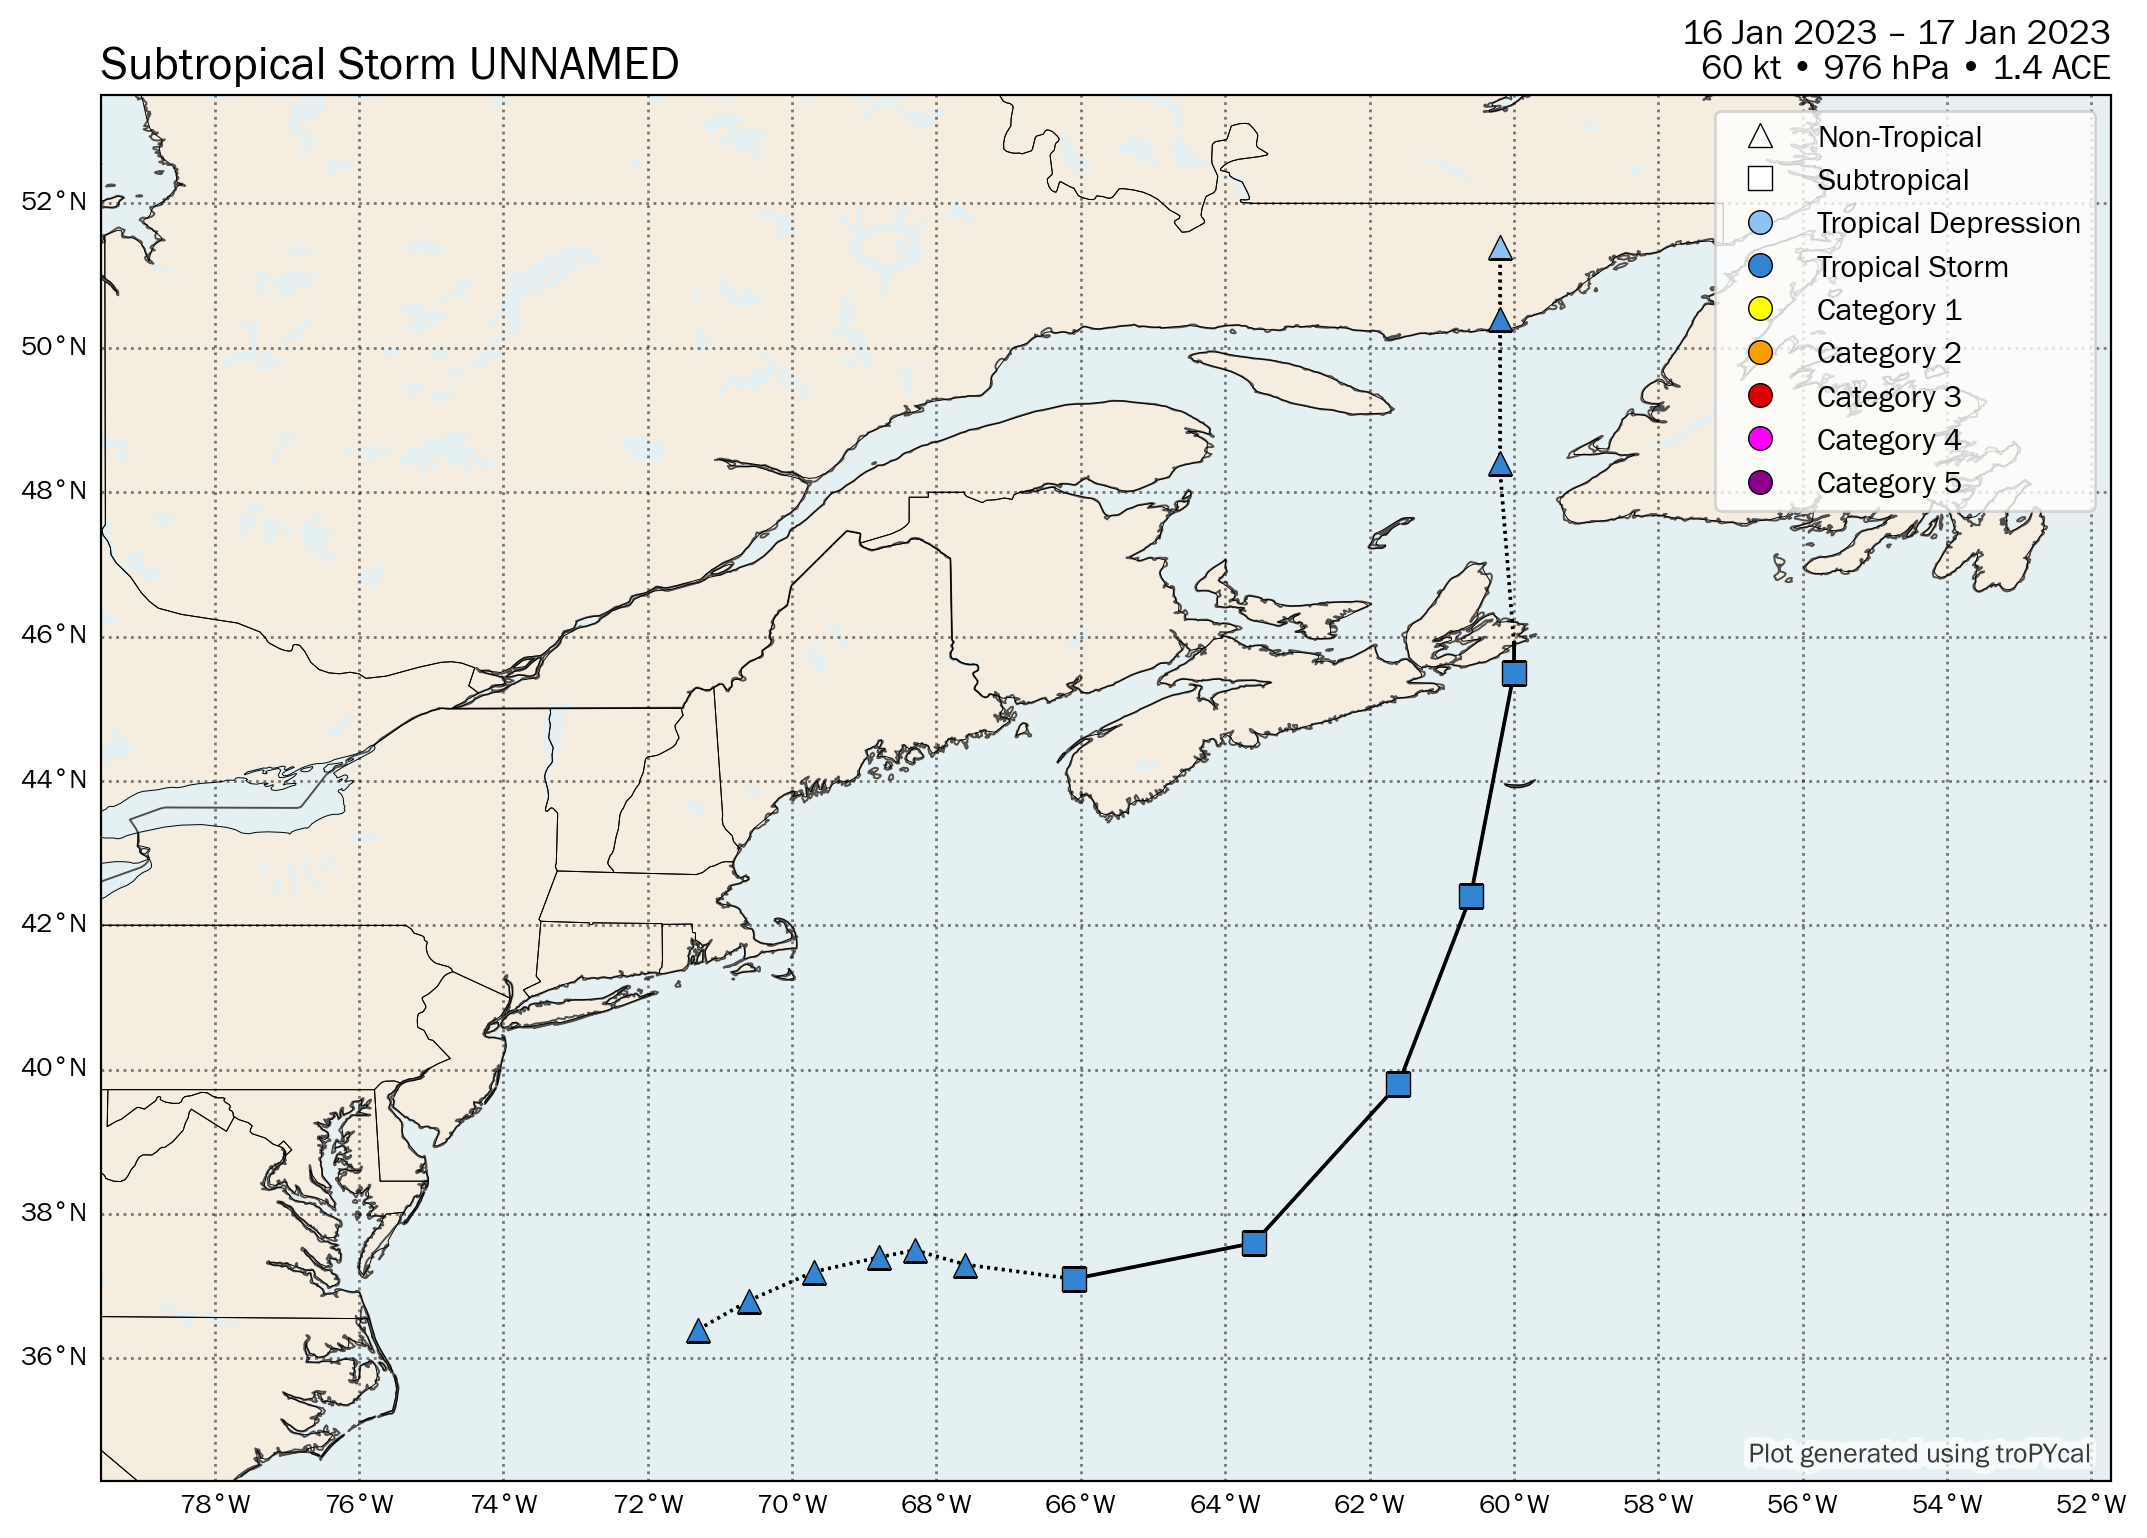
Unnamed Subtropical Storm
Storm Duration
•
January 16–17, 2023
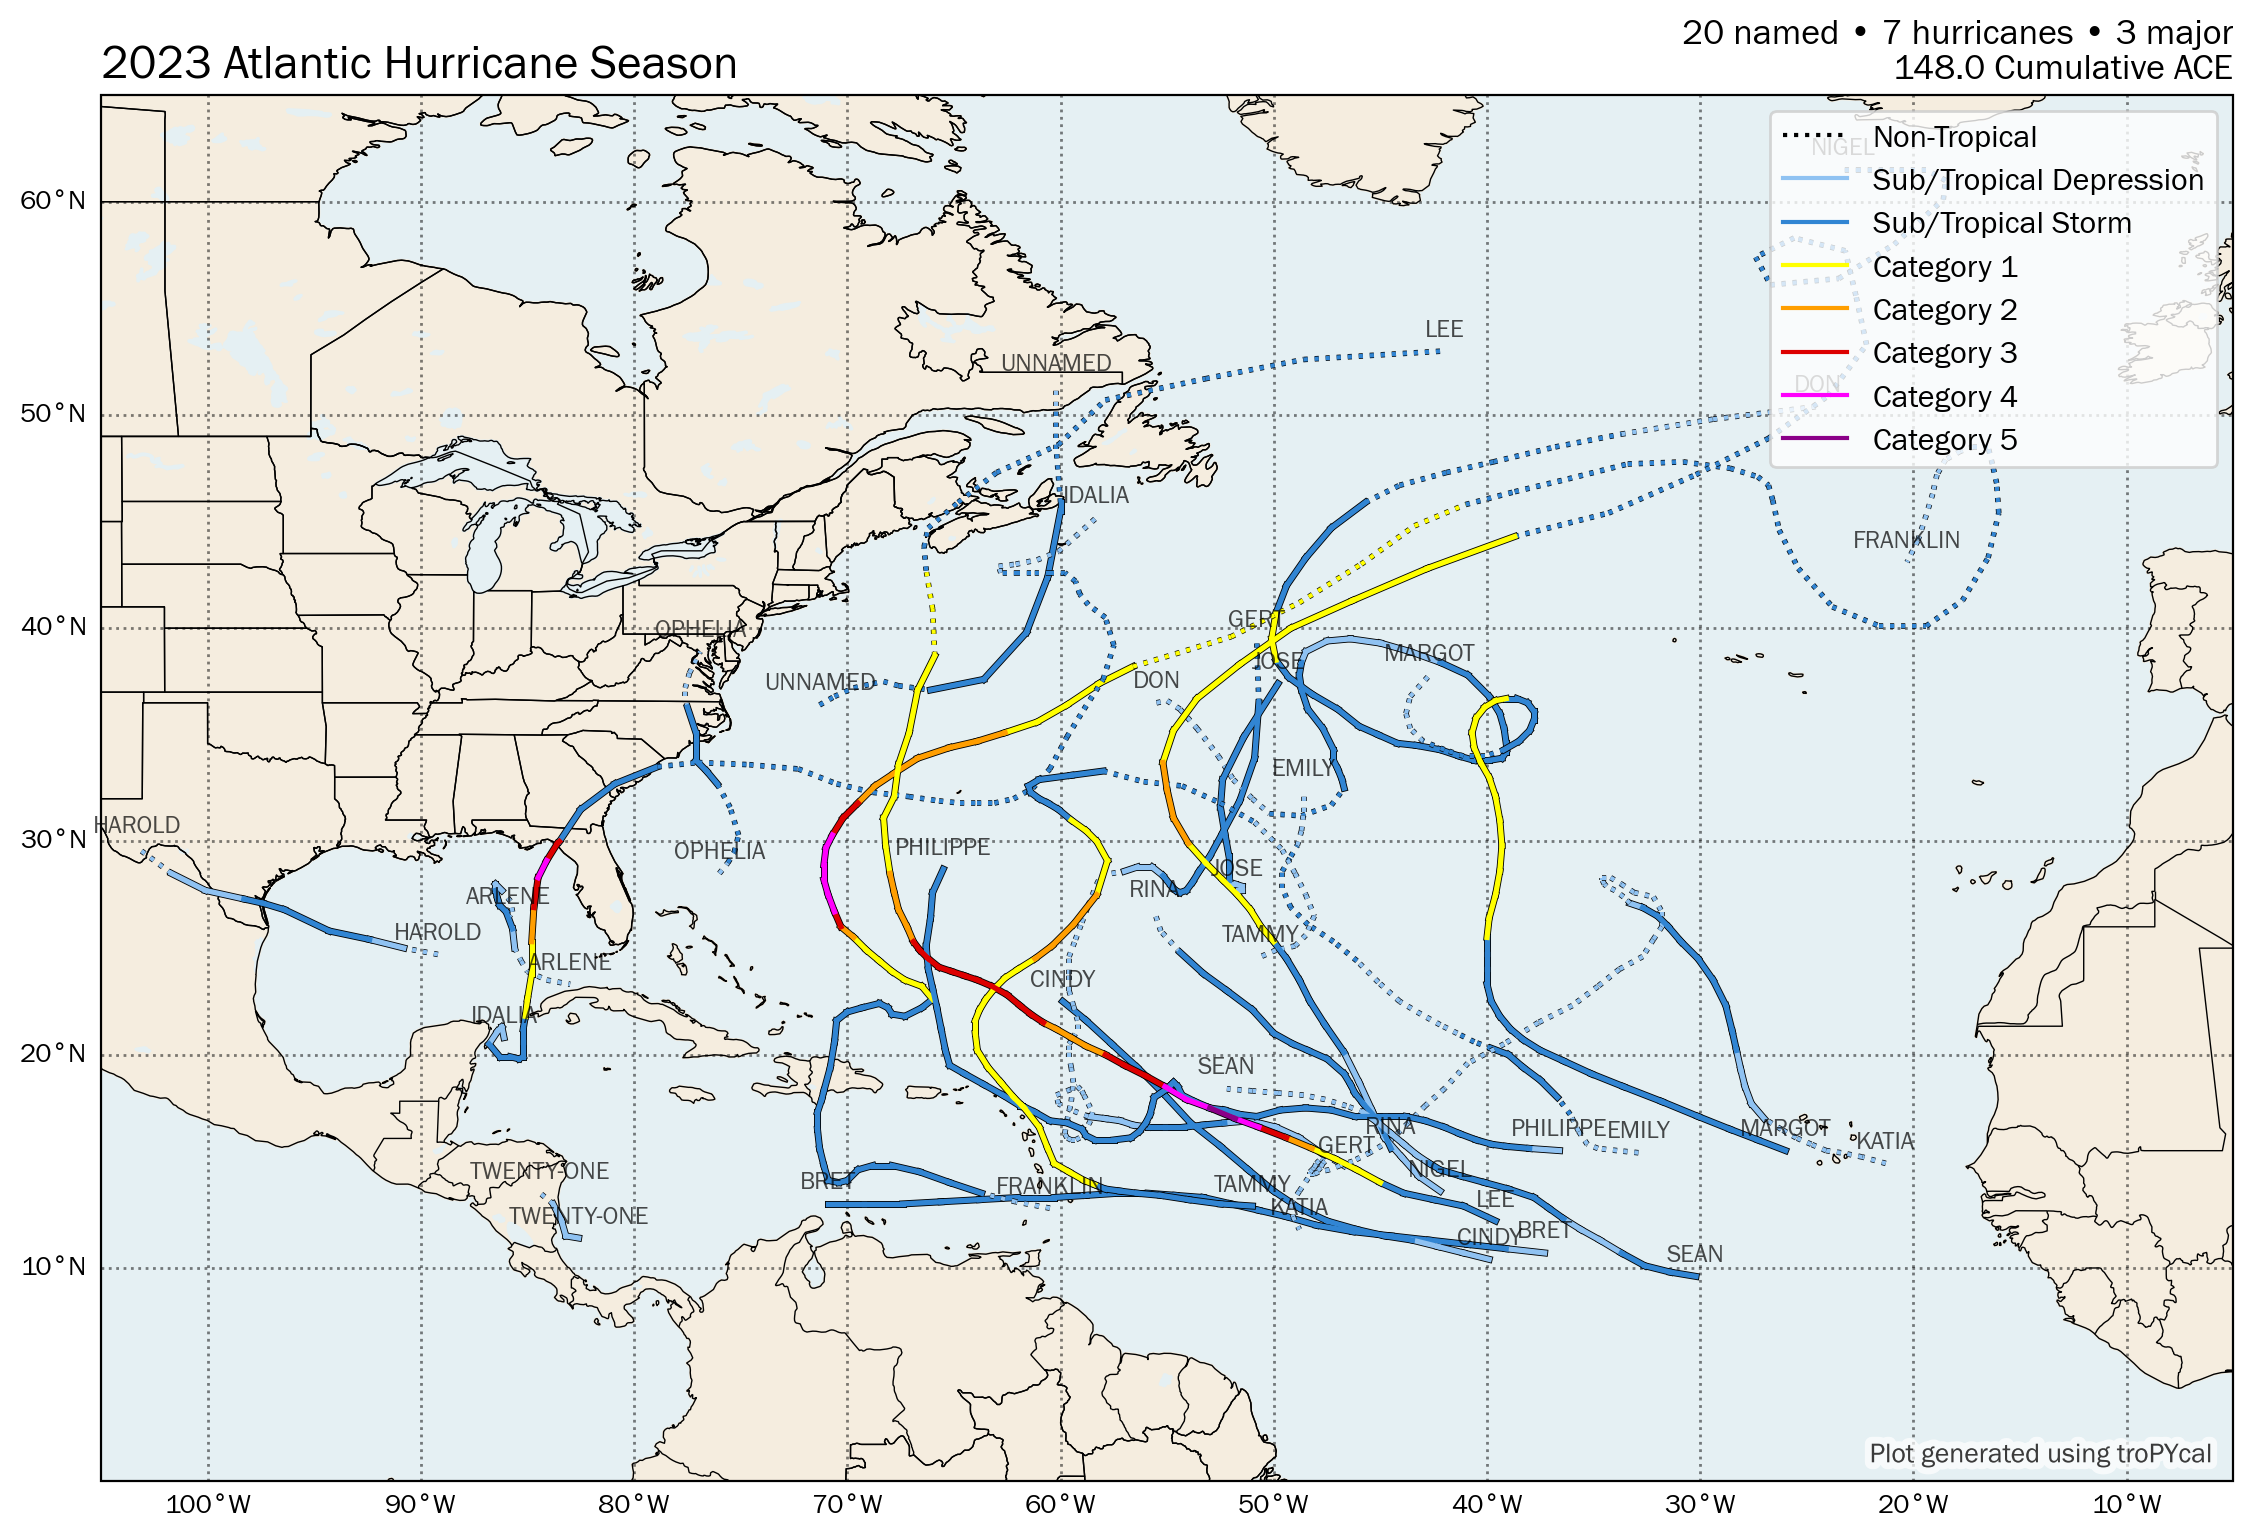
| S | Unnamed Subtropical Storm | 60 kt | 976 hPa | 12z 01/16 | 12z 01/17 | 1.4 |
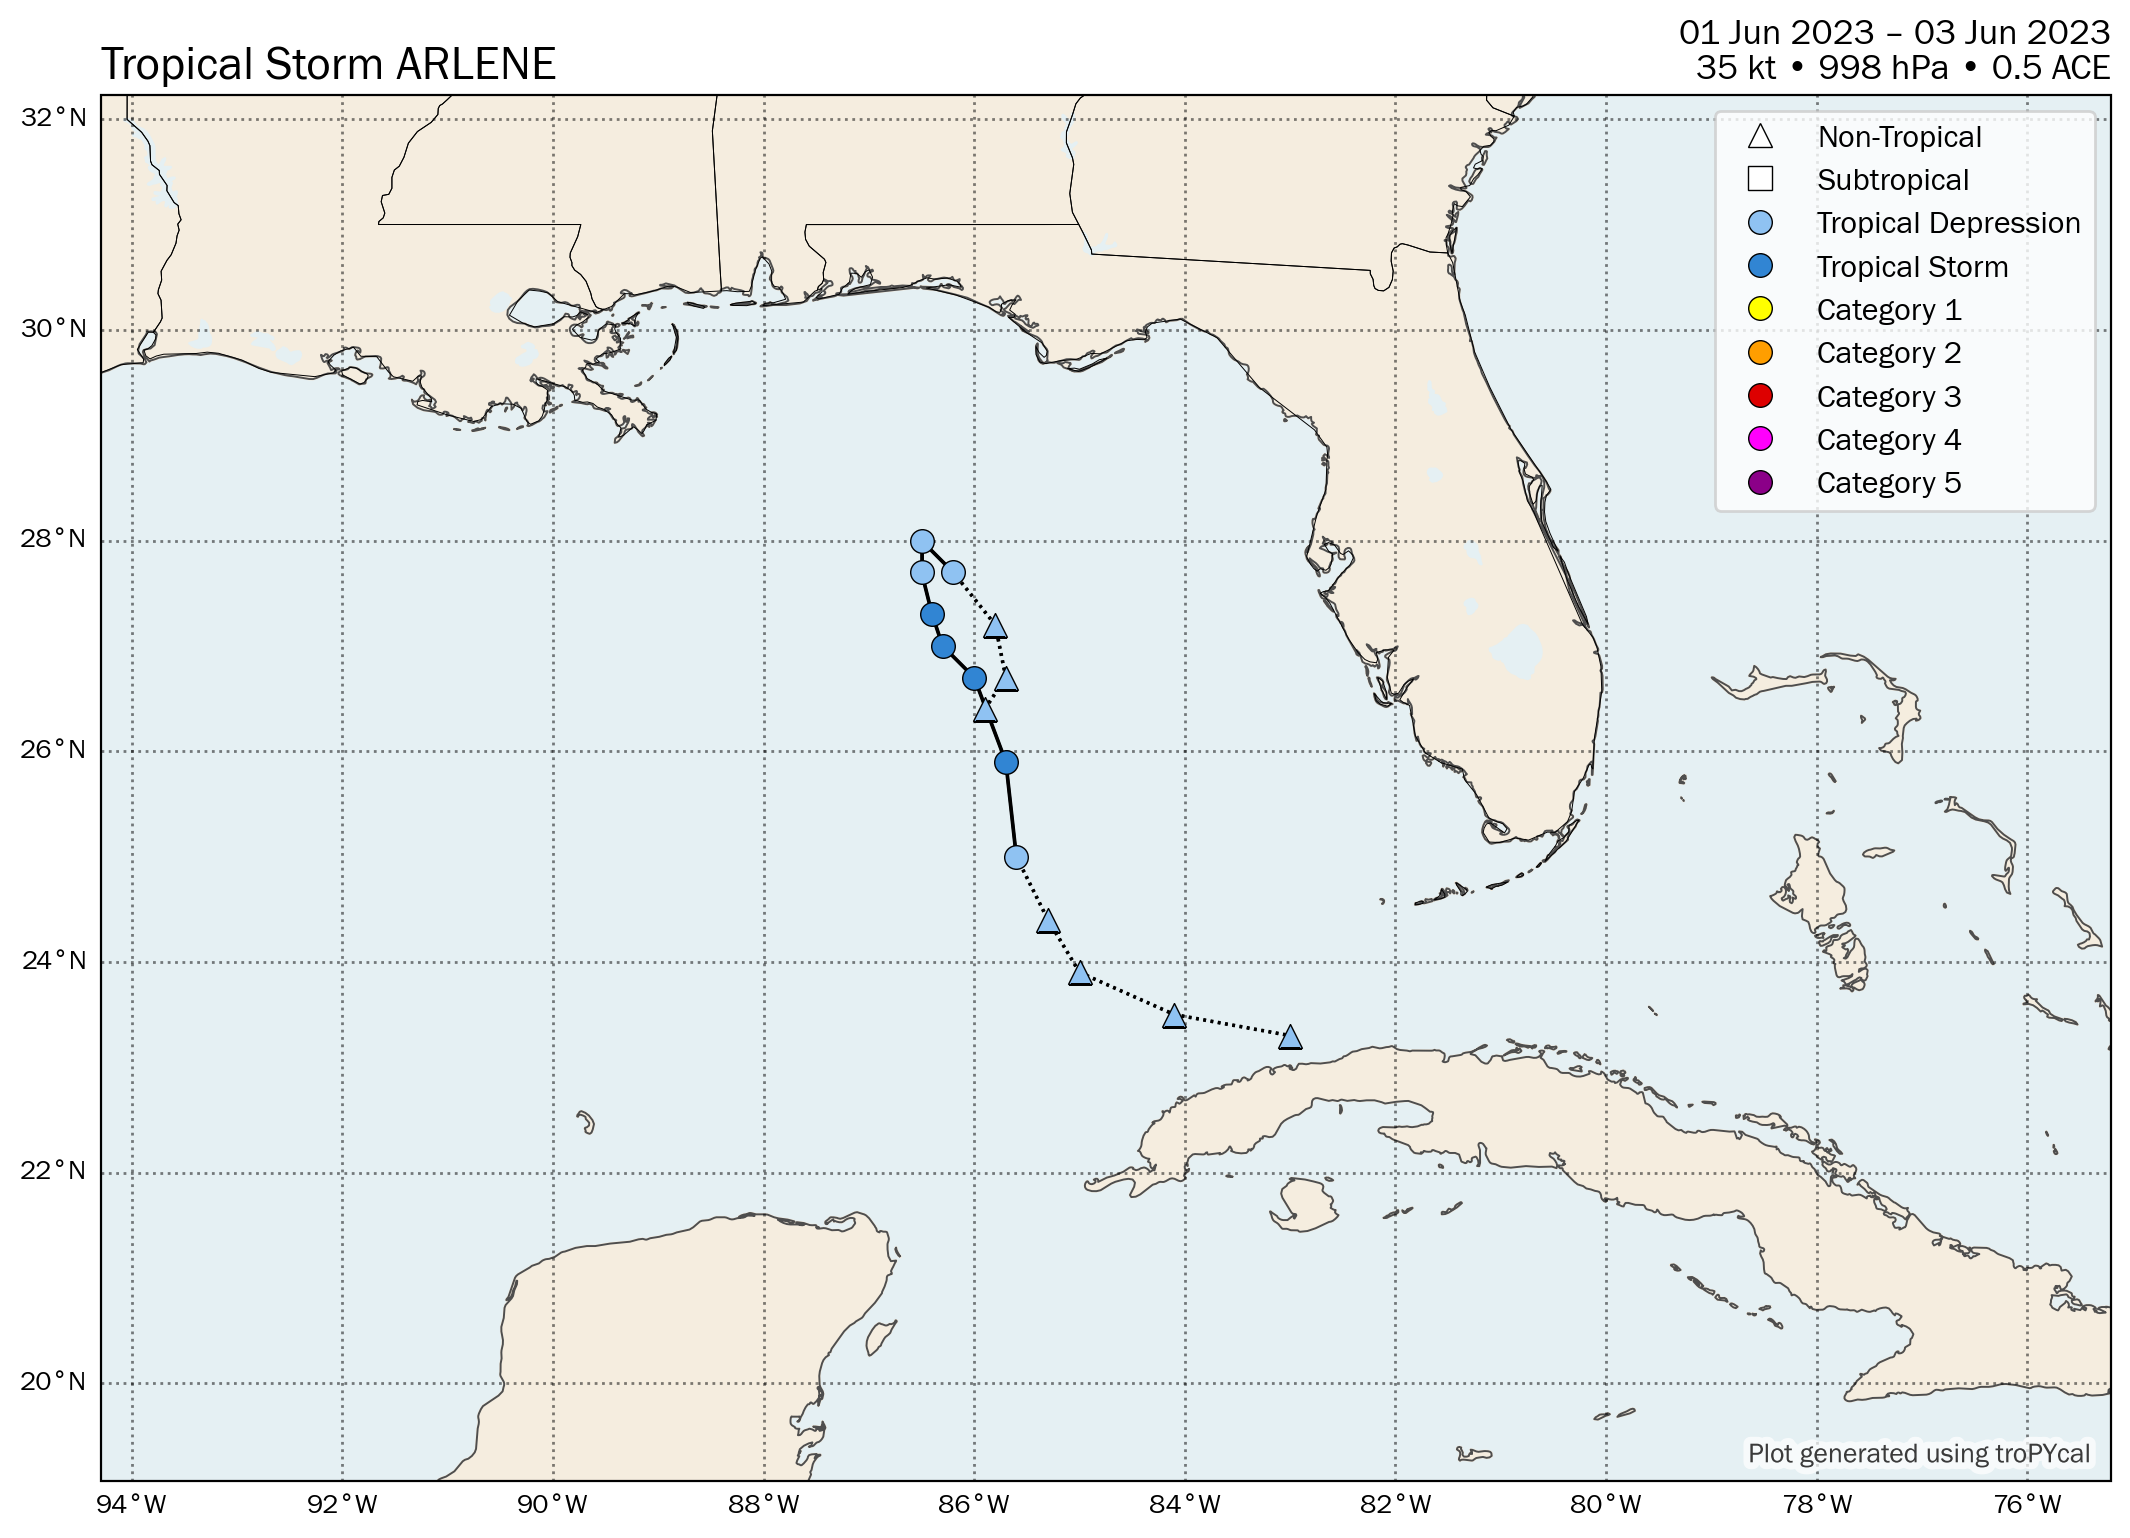
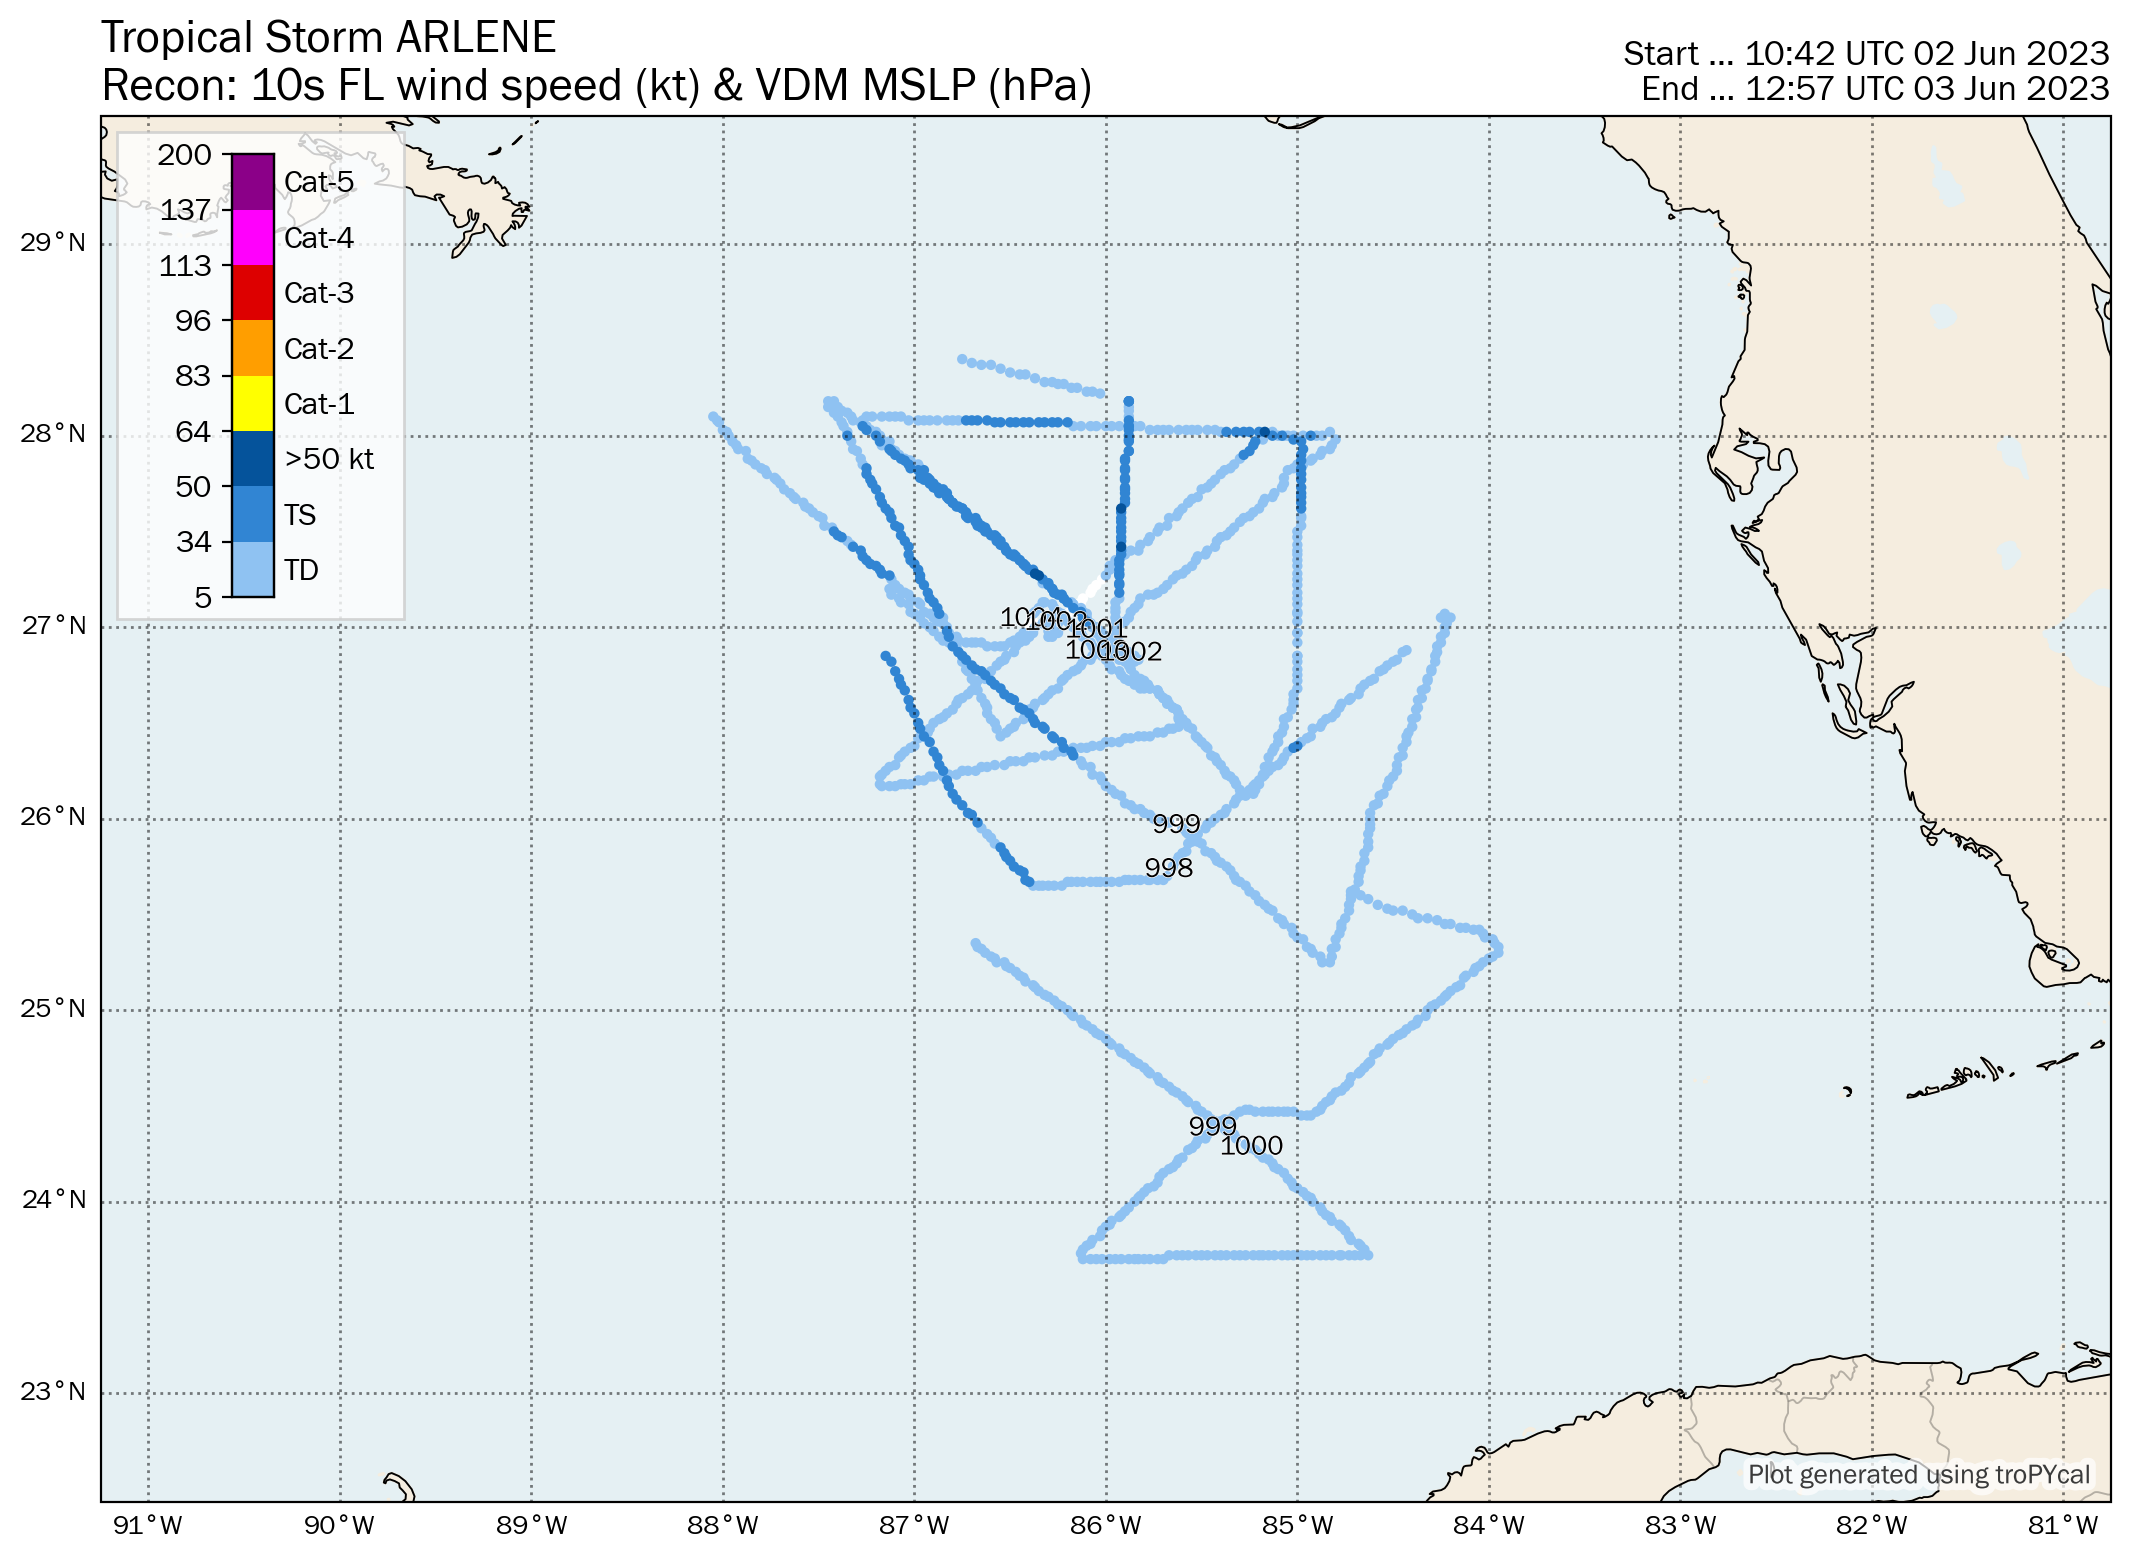
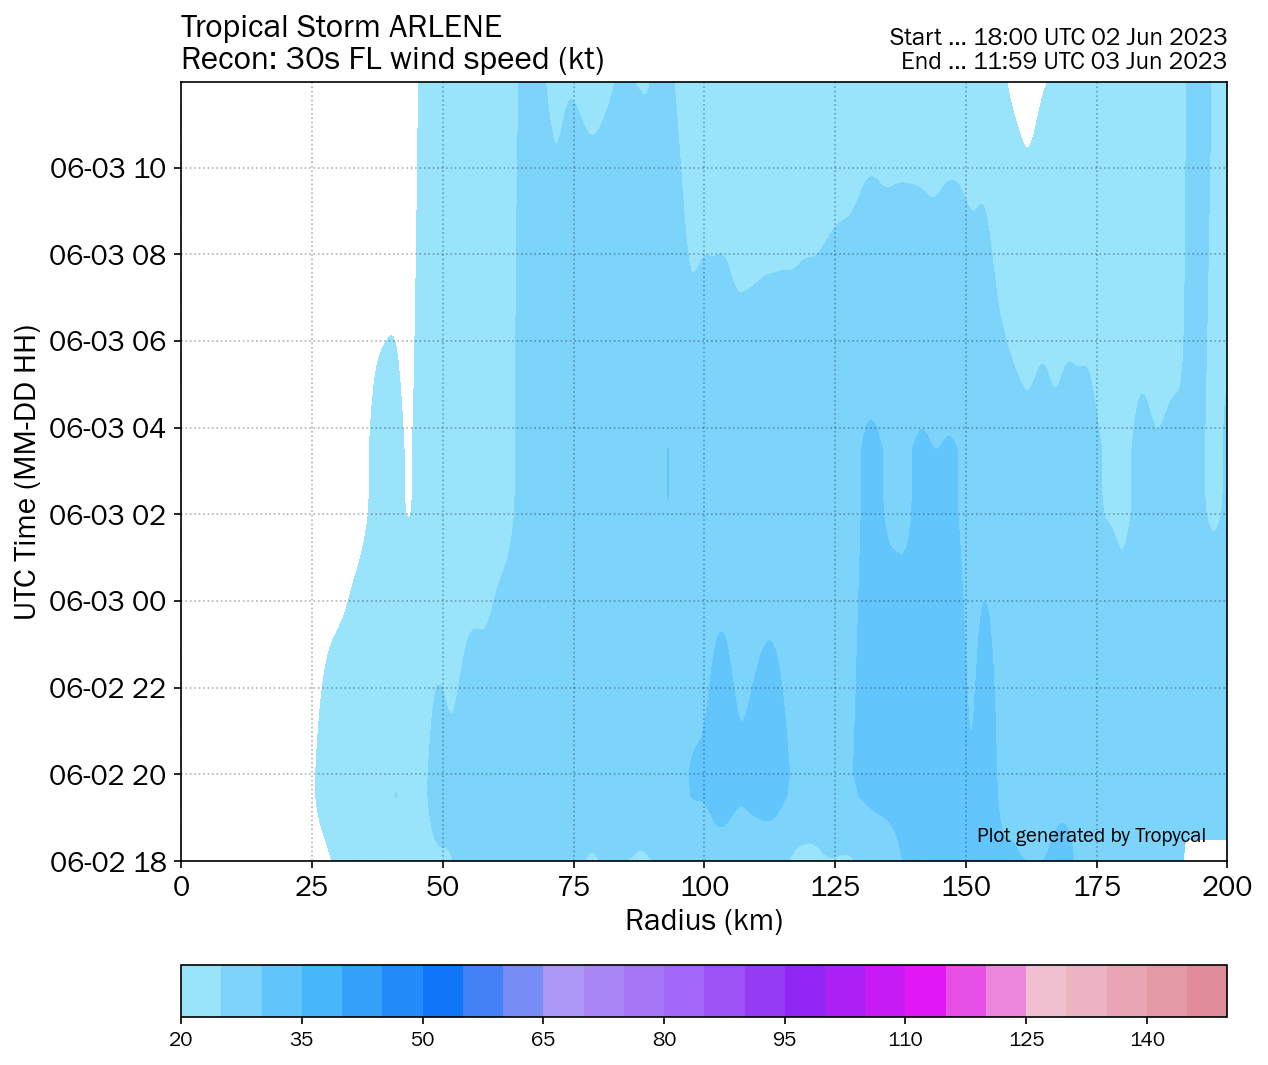
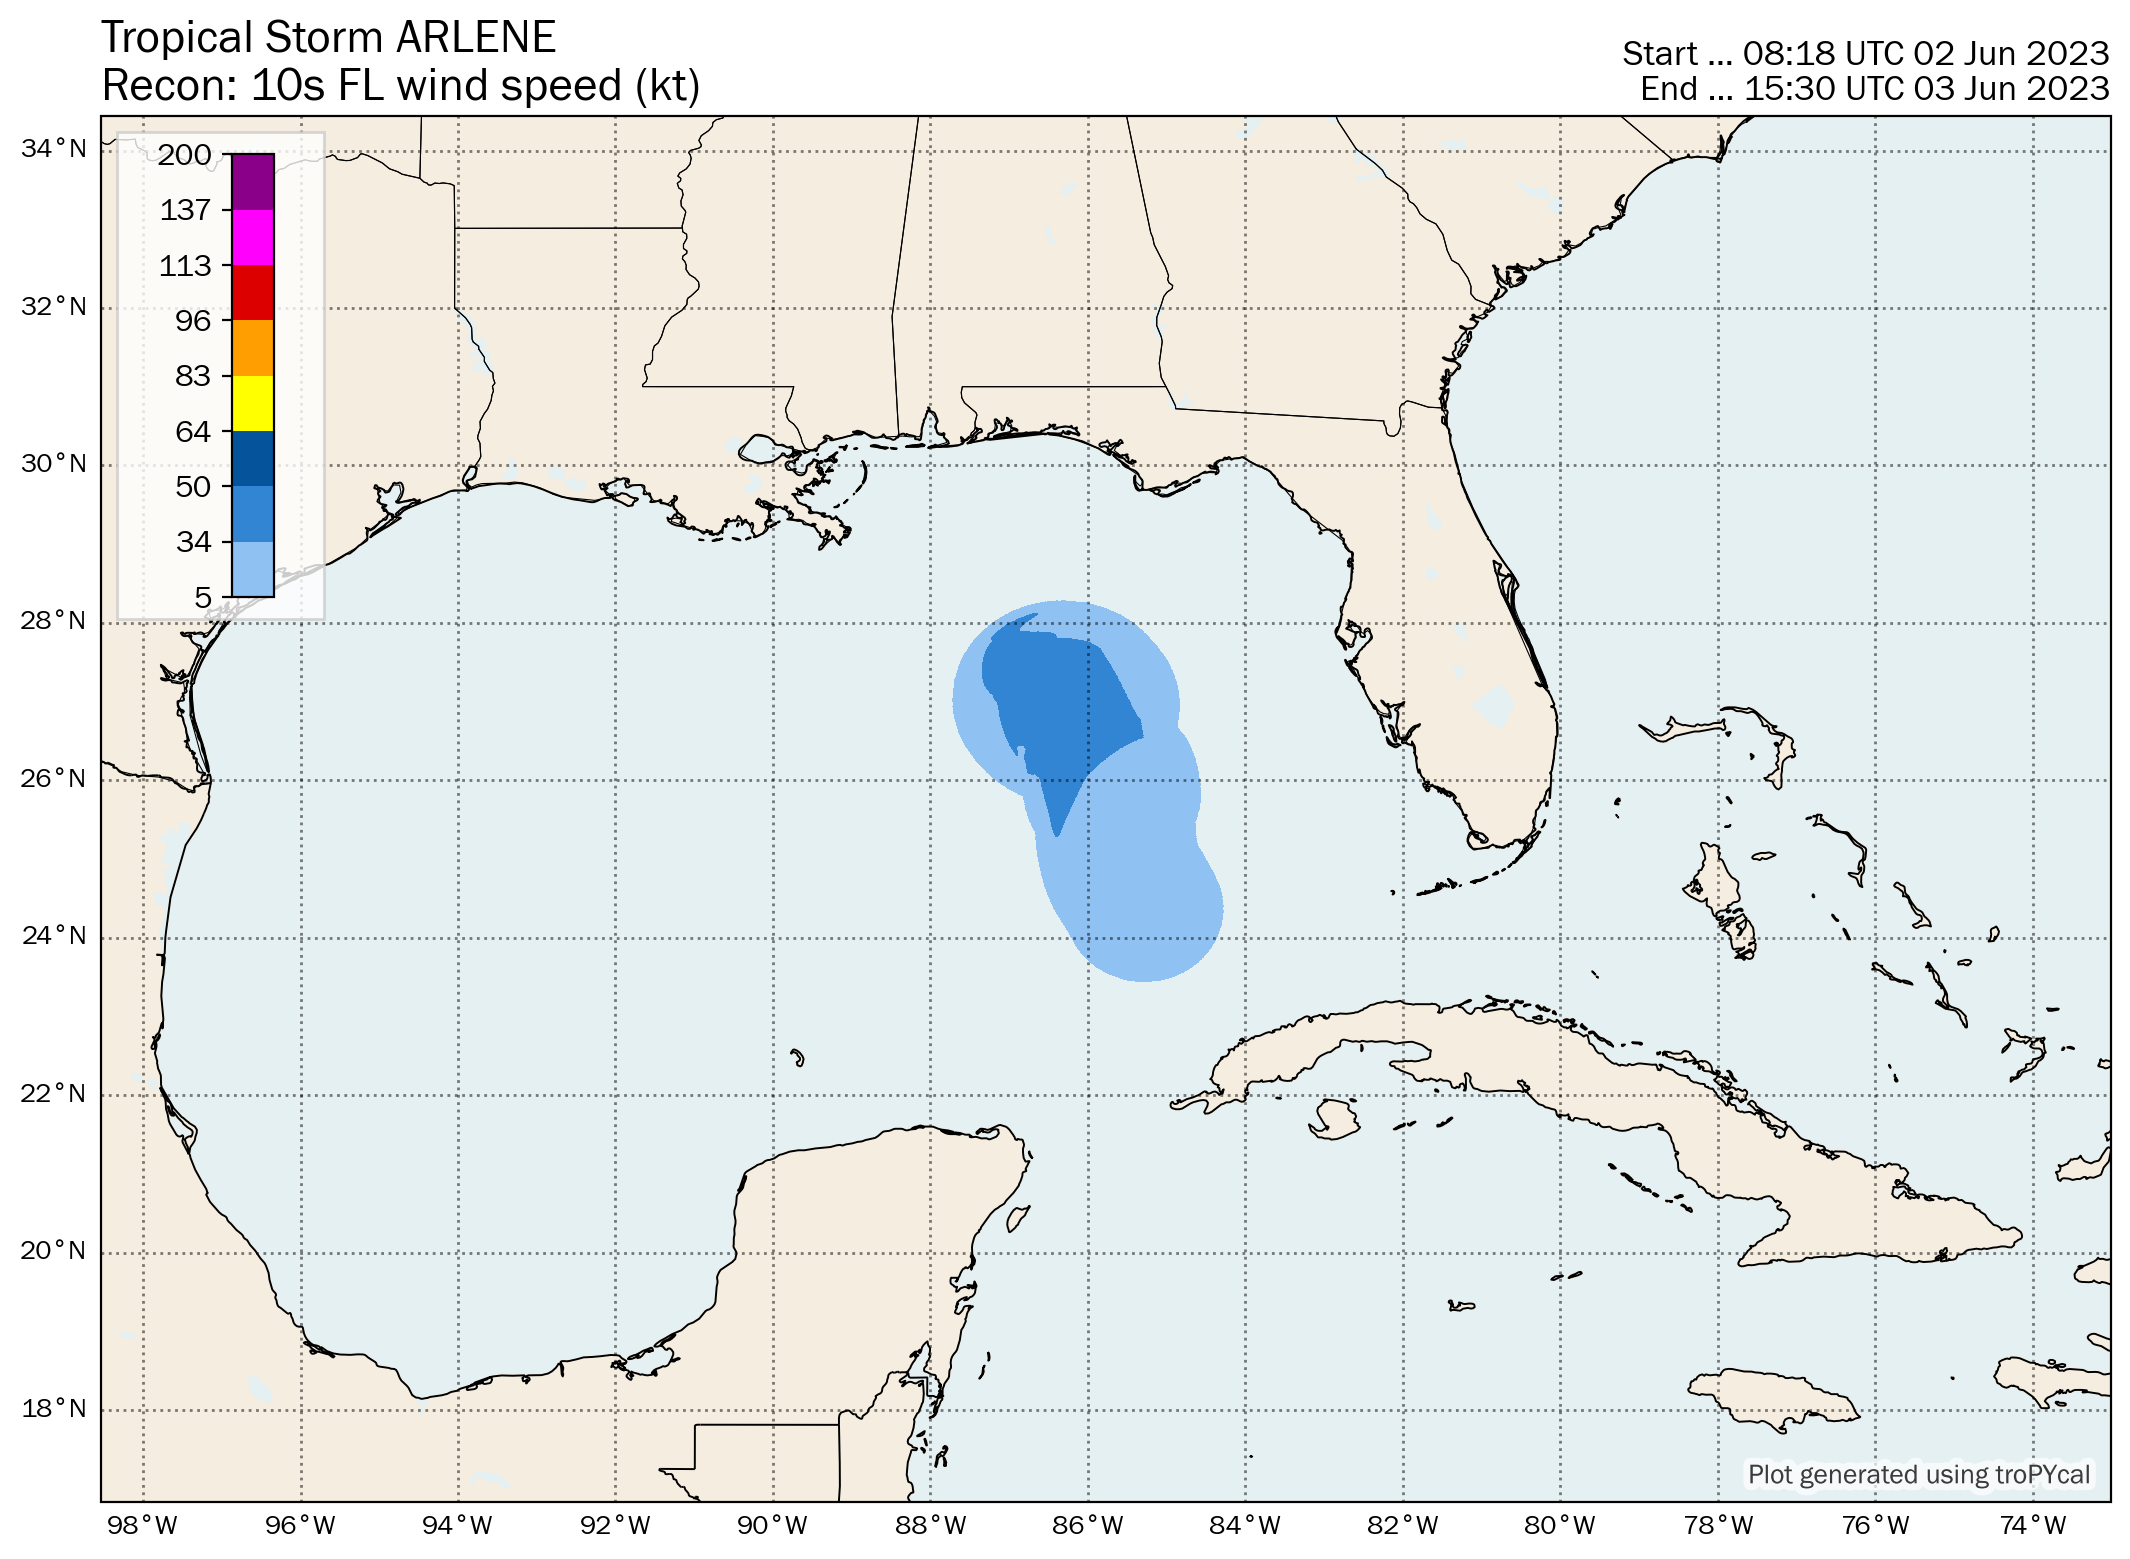
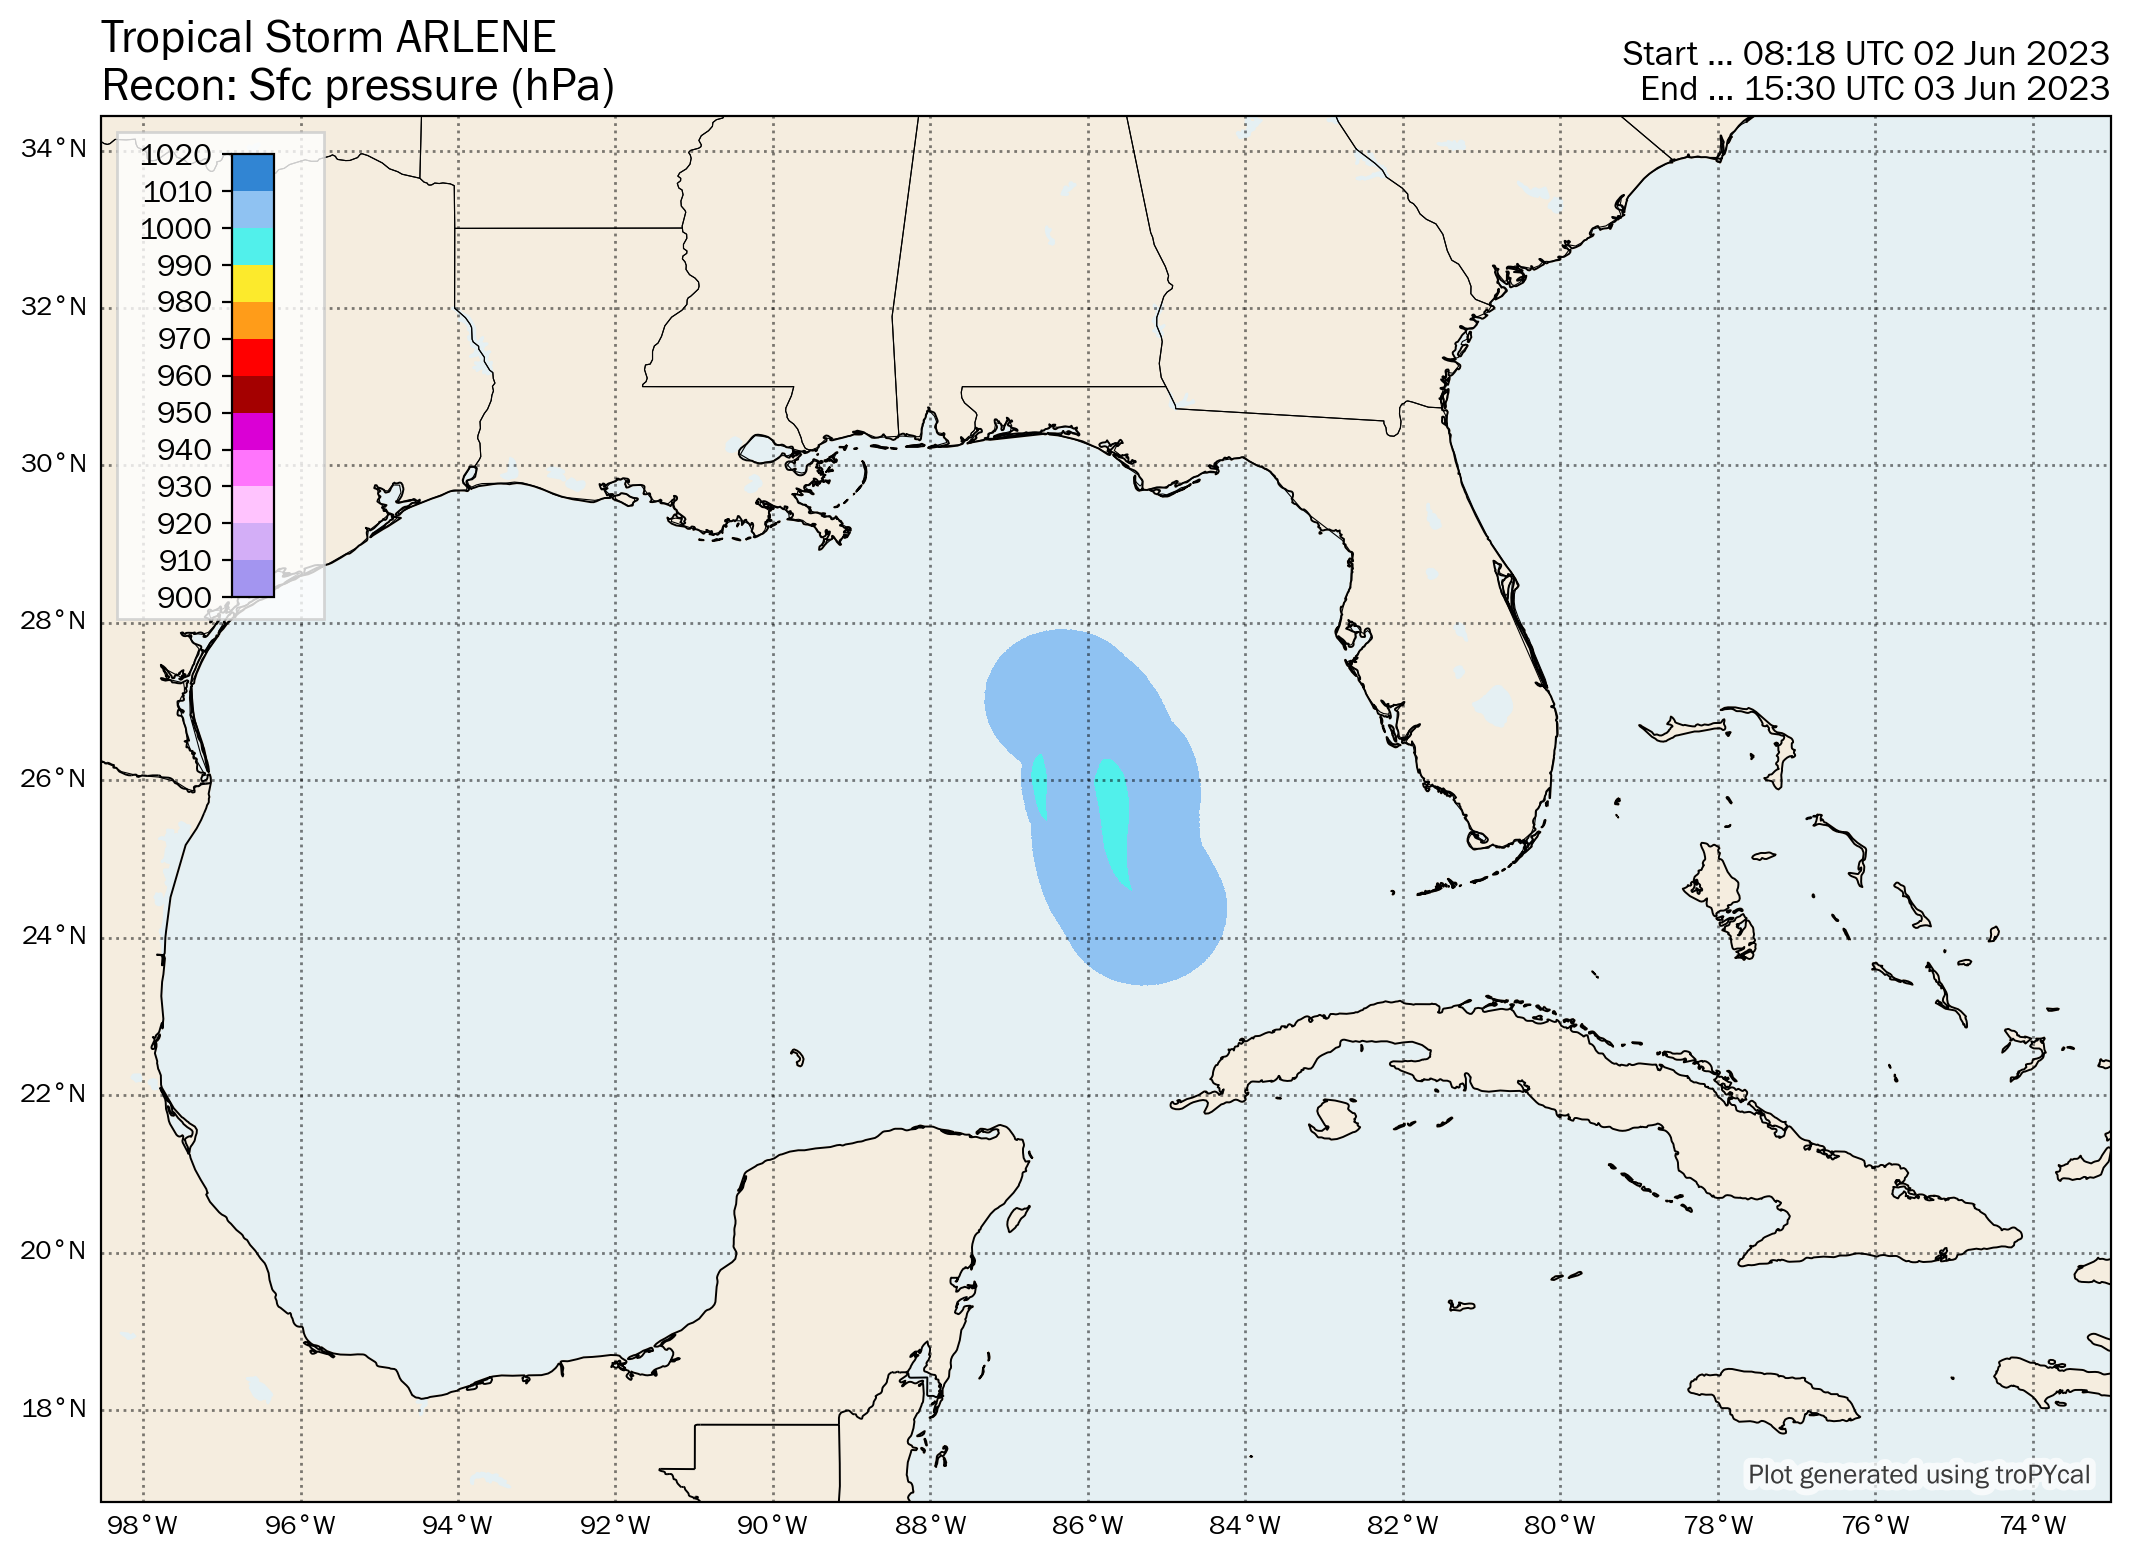
| S | Tropical Storm Arlene | 35 kt | 998 hPa | 12z 06/01 | 06z 06/03 | 0.5 |
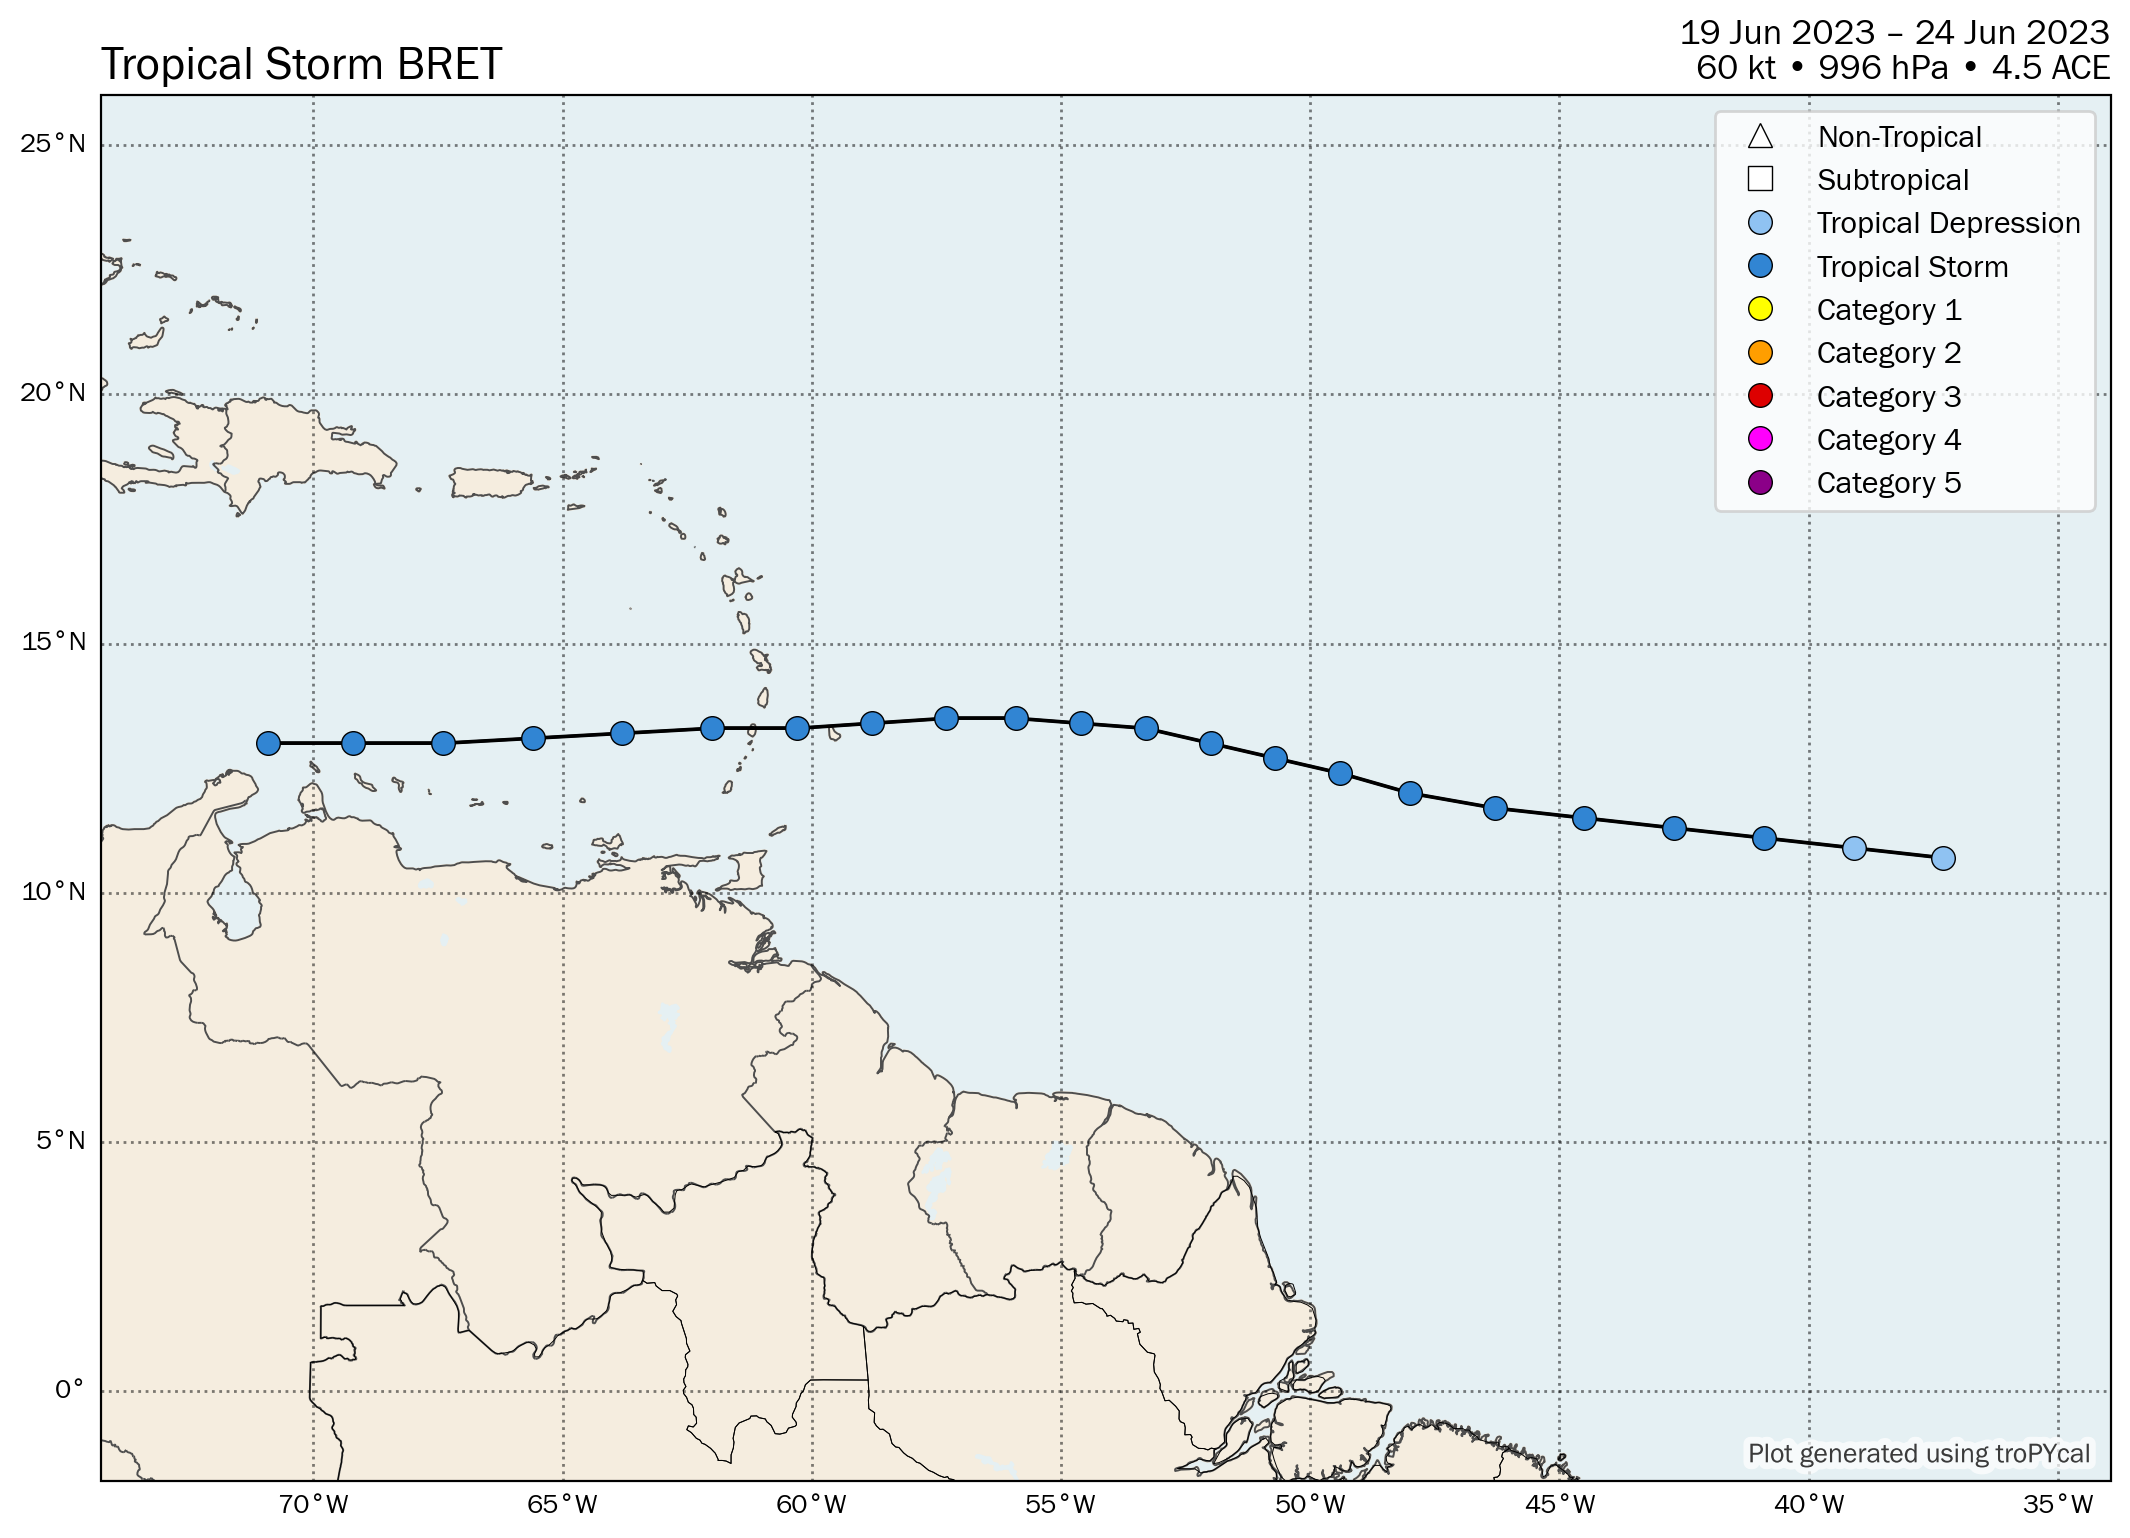
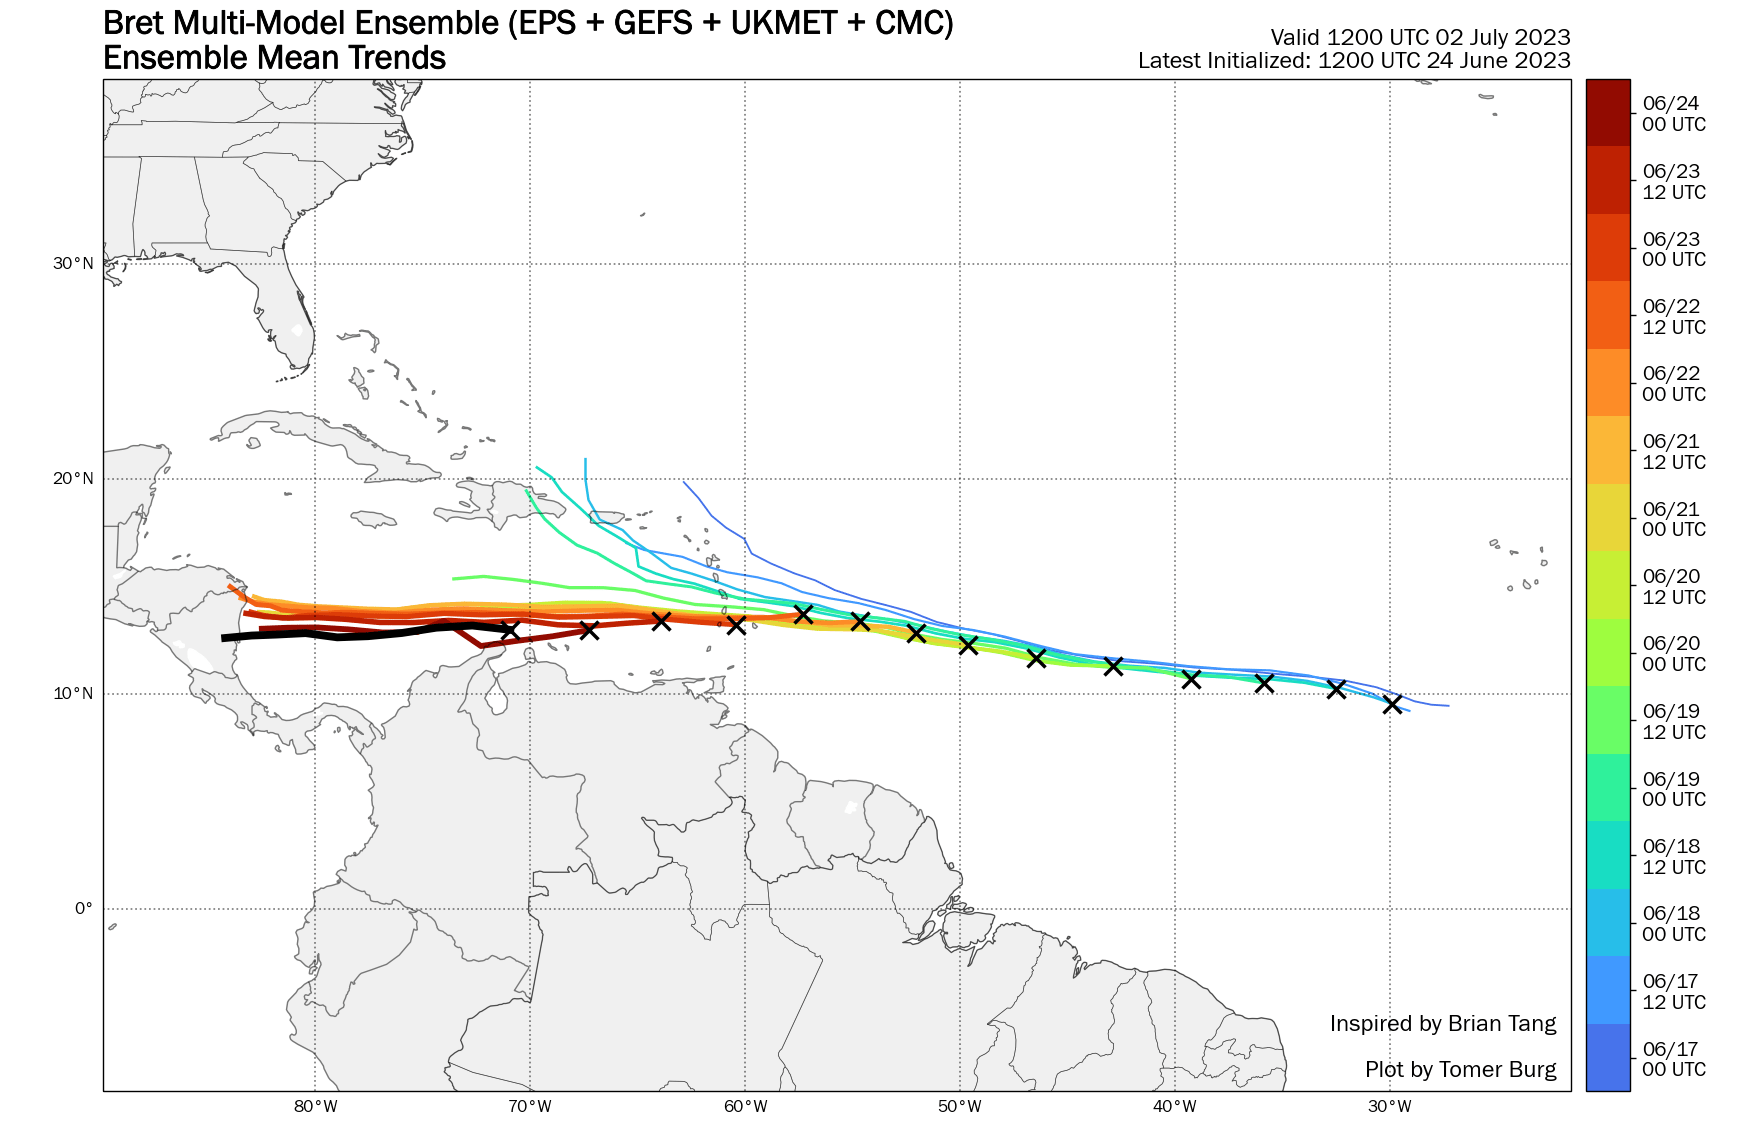
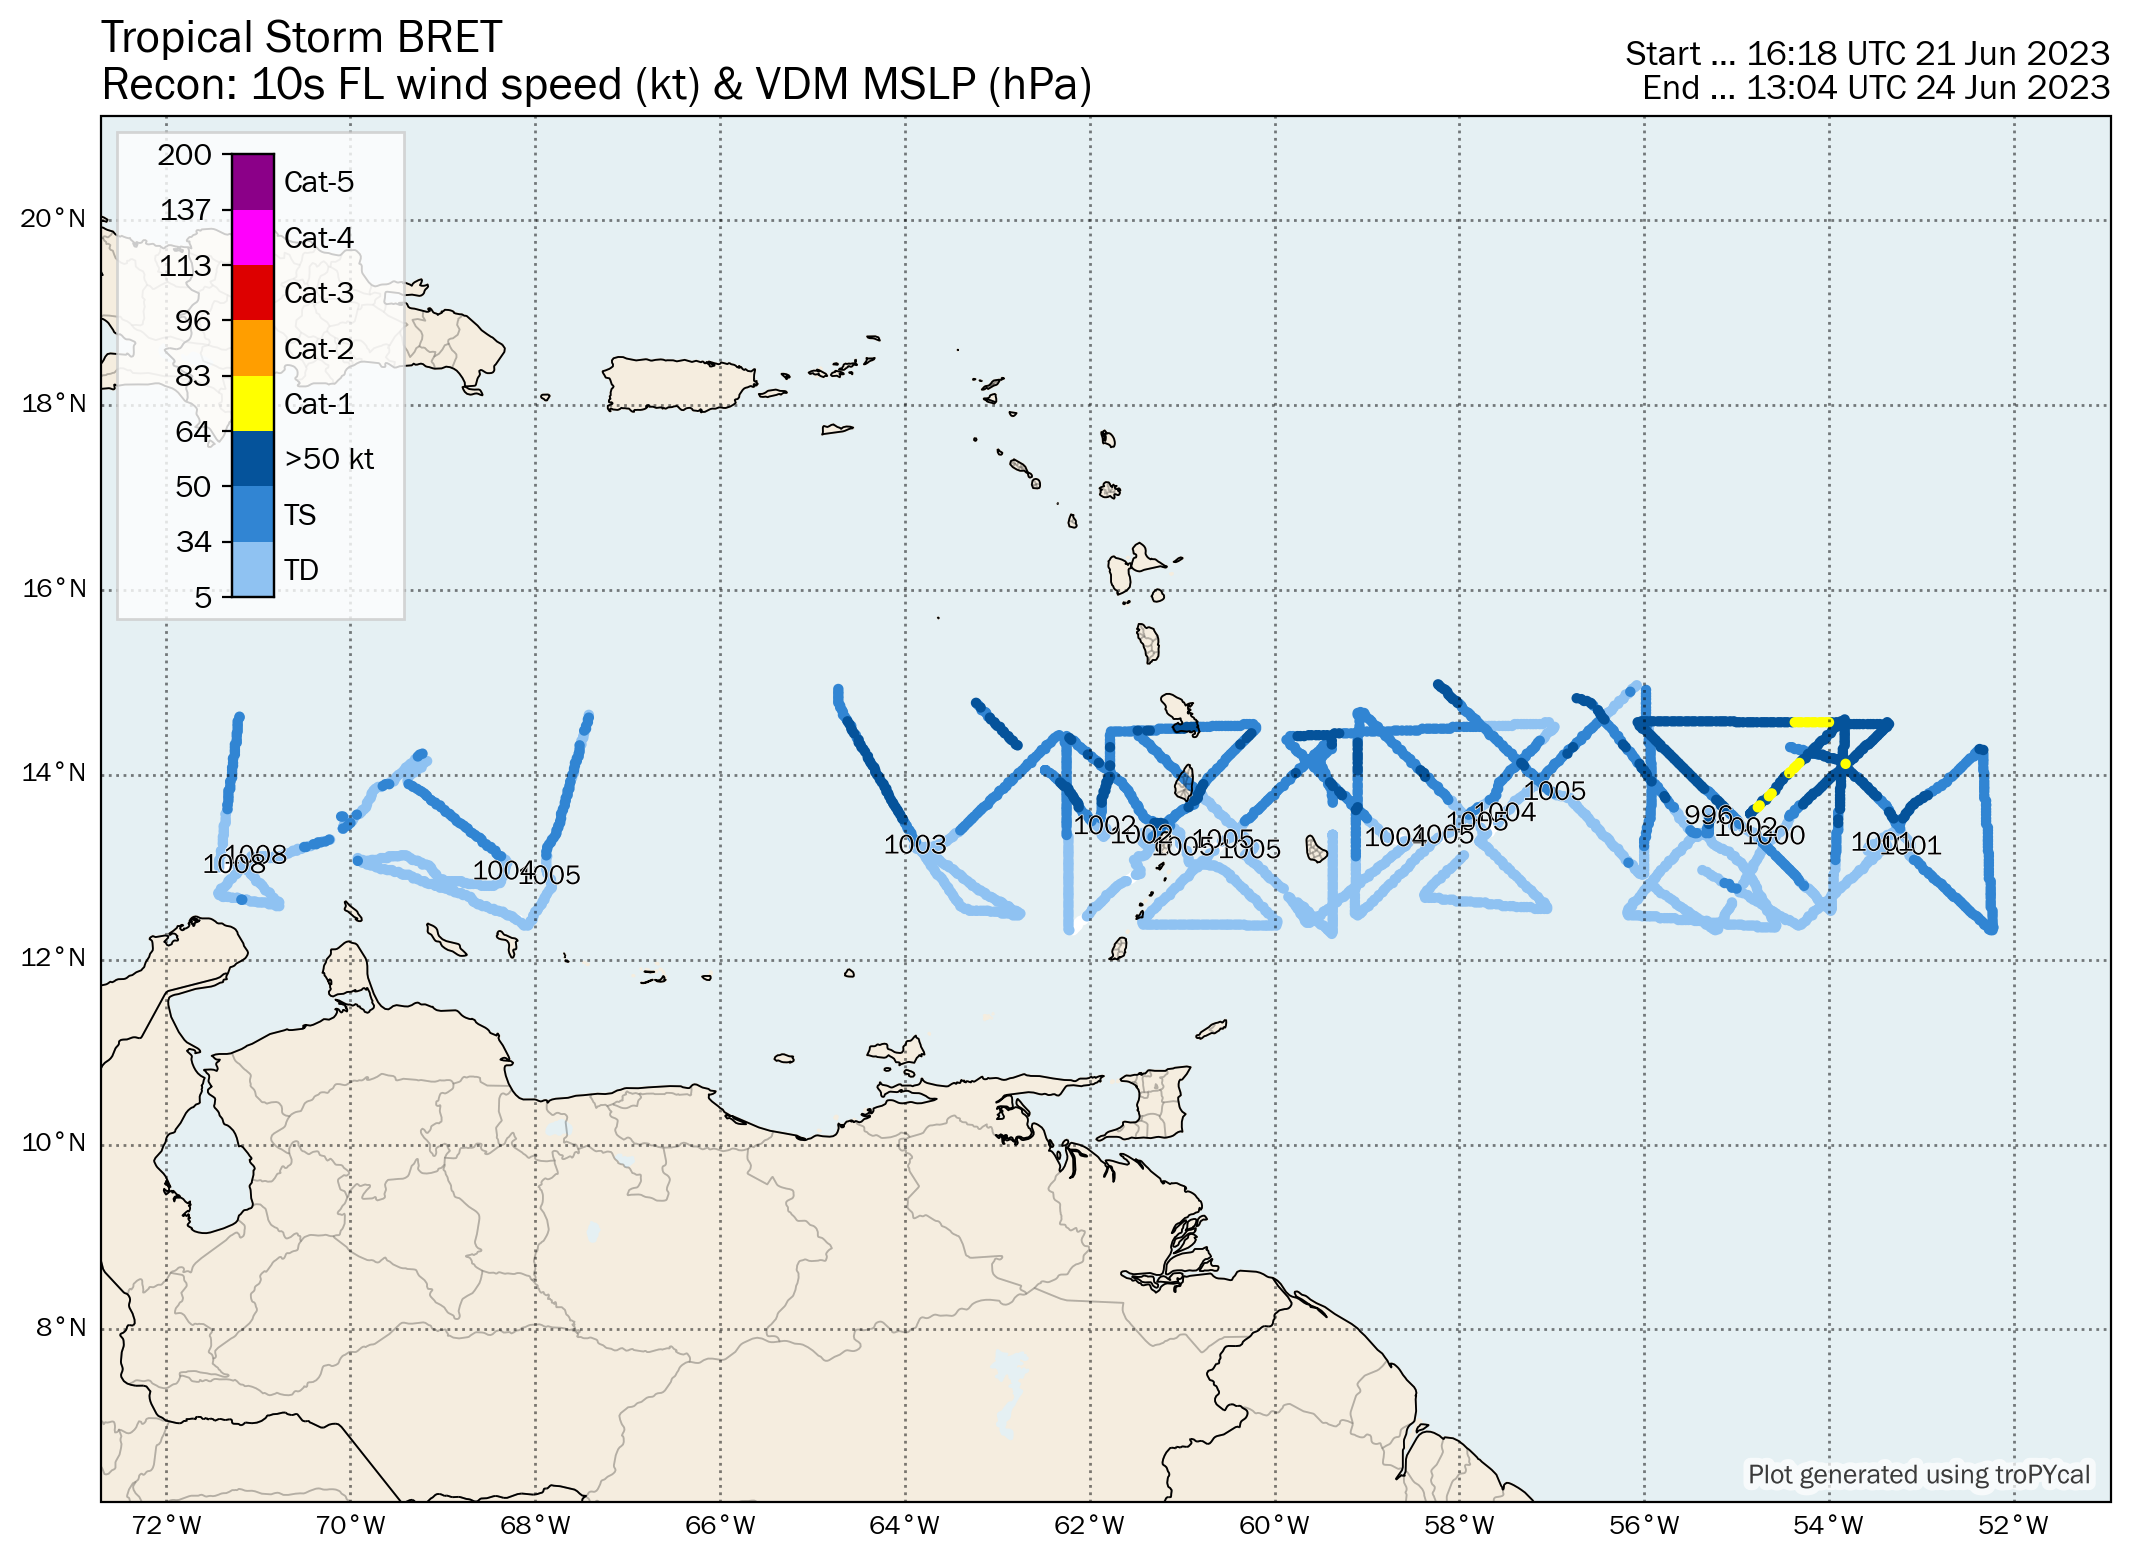
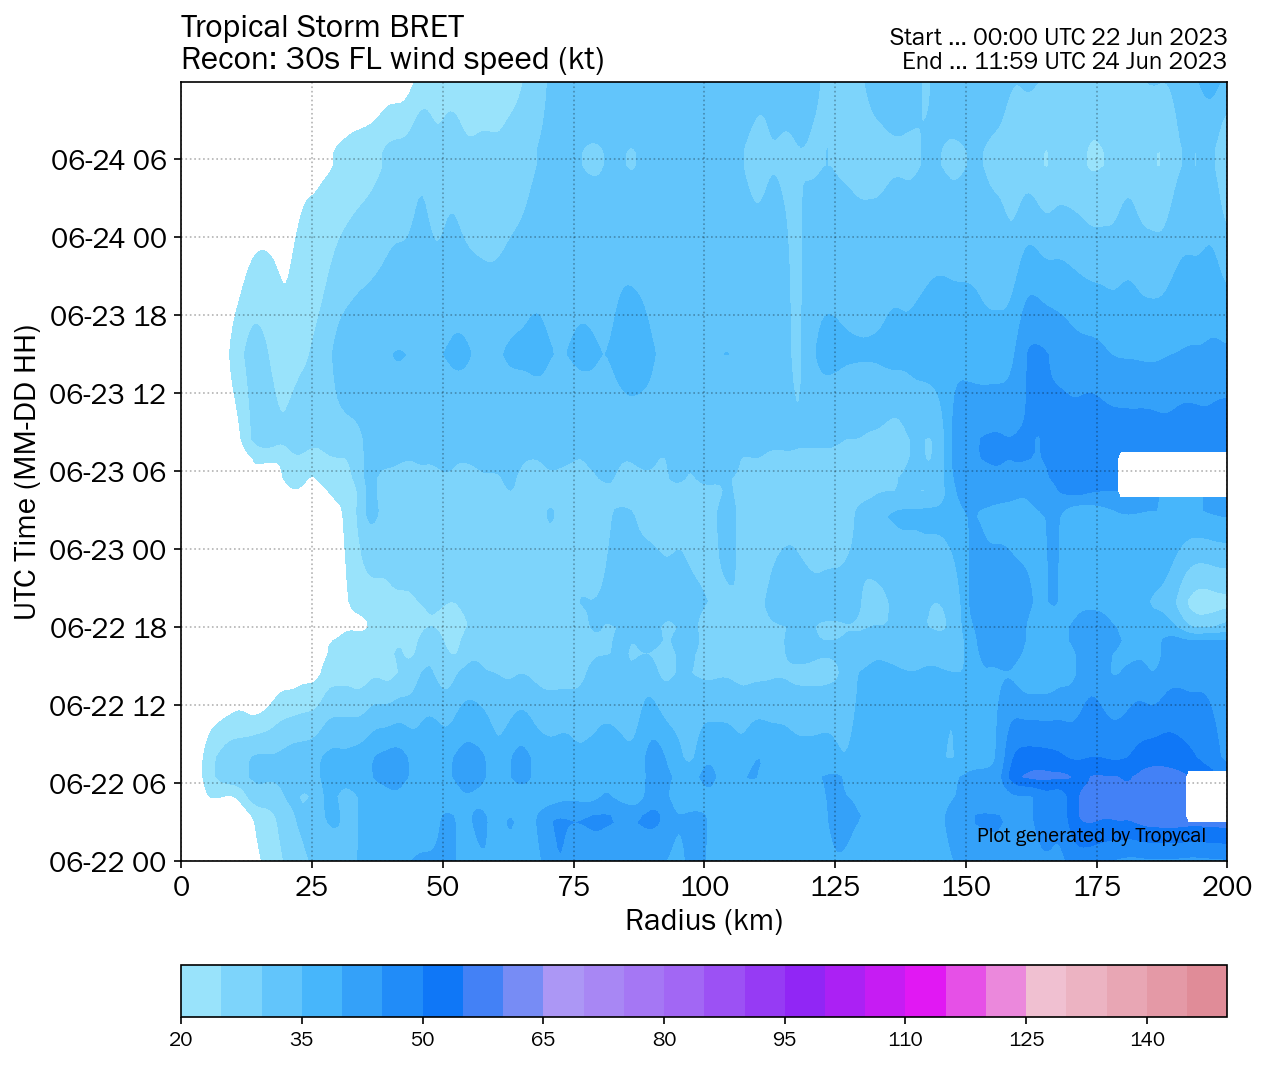
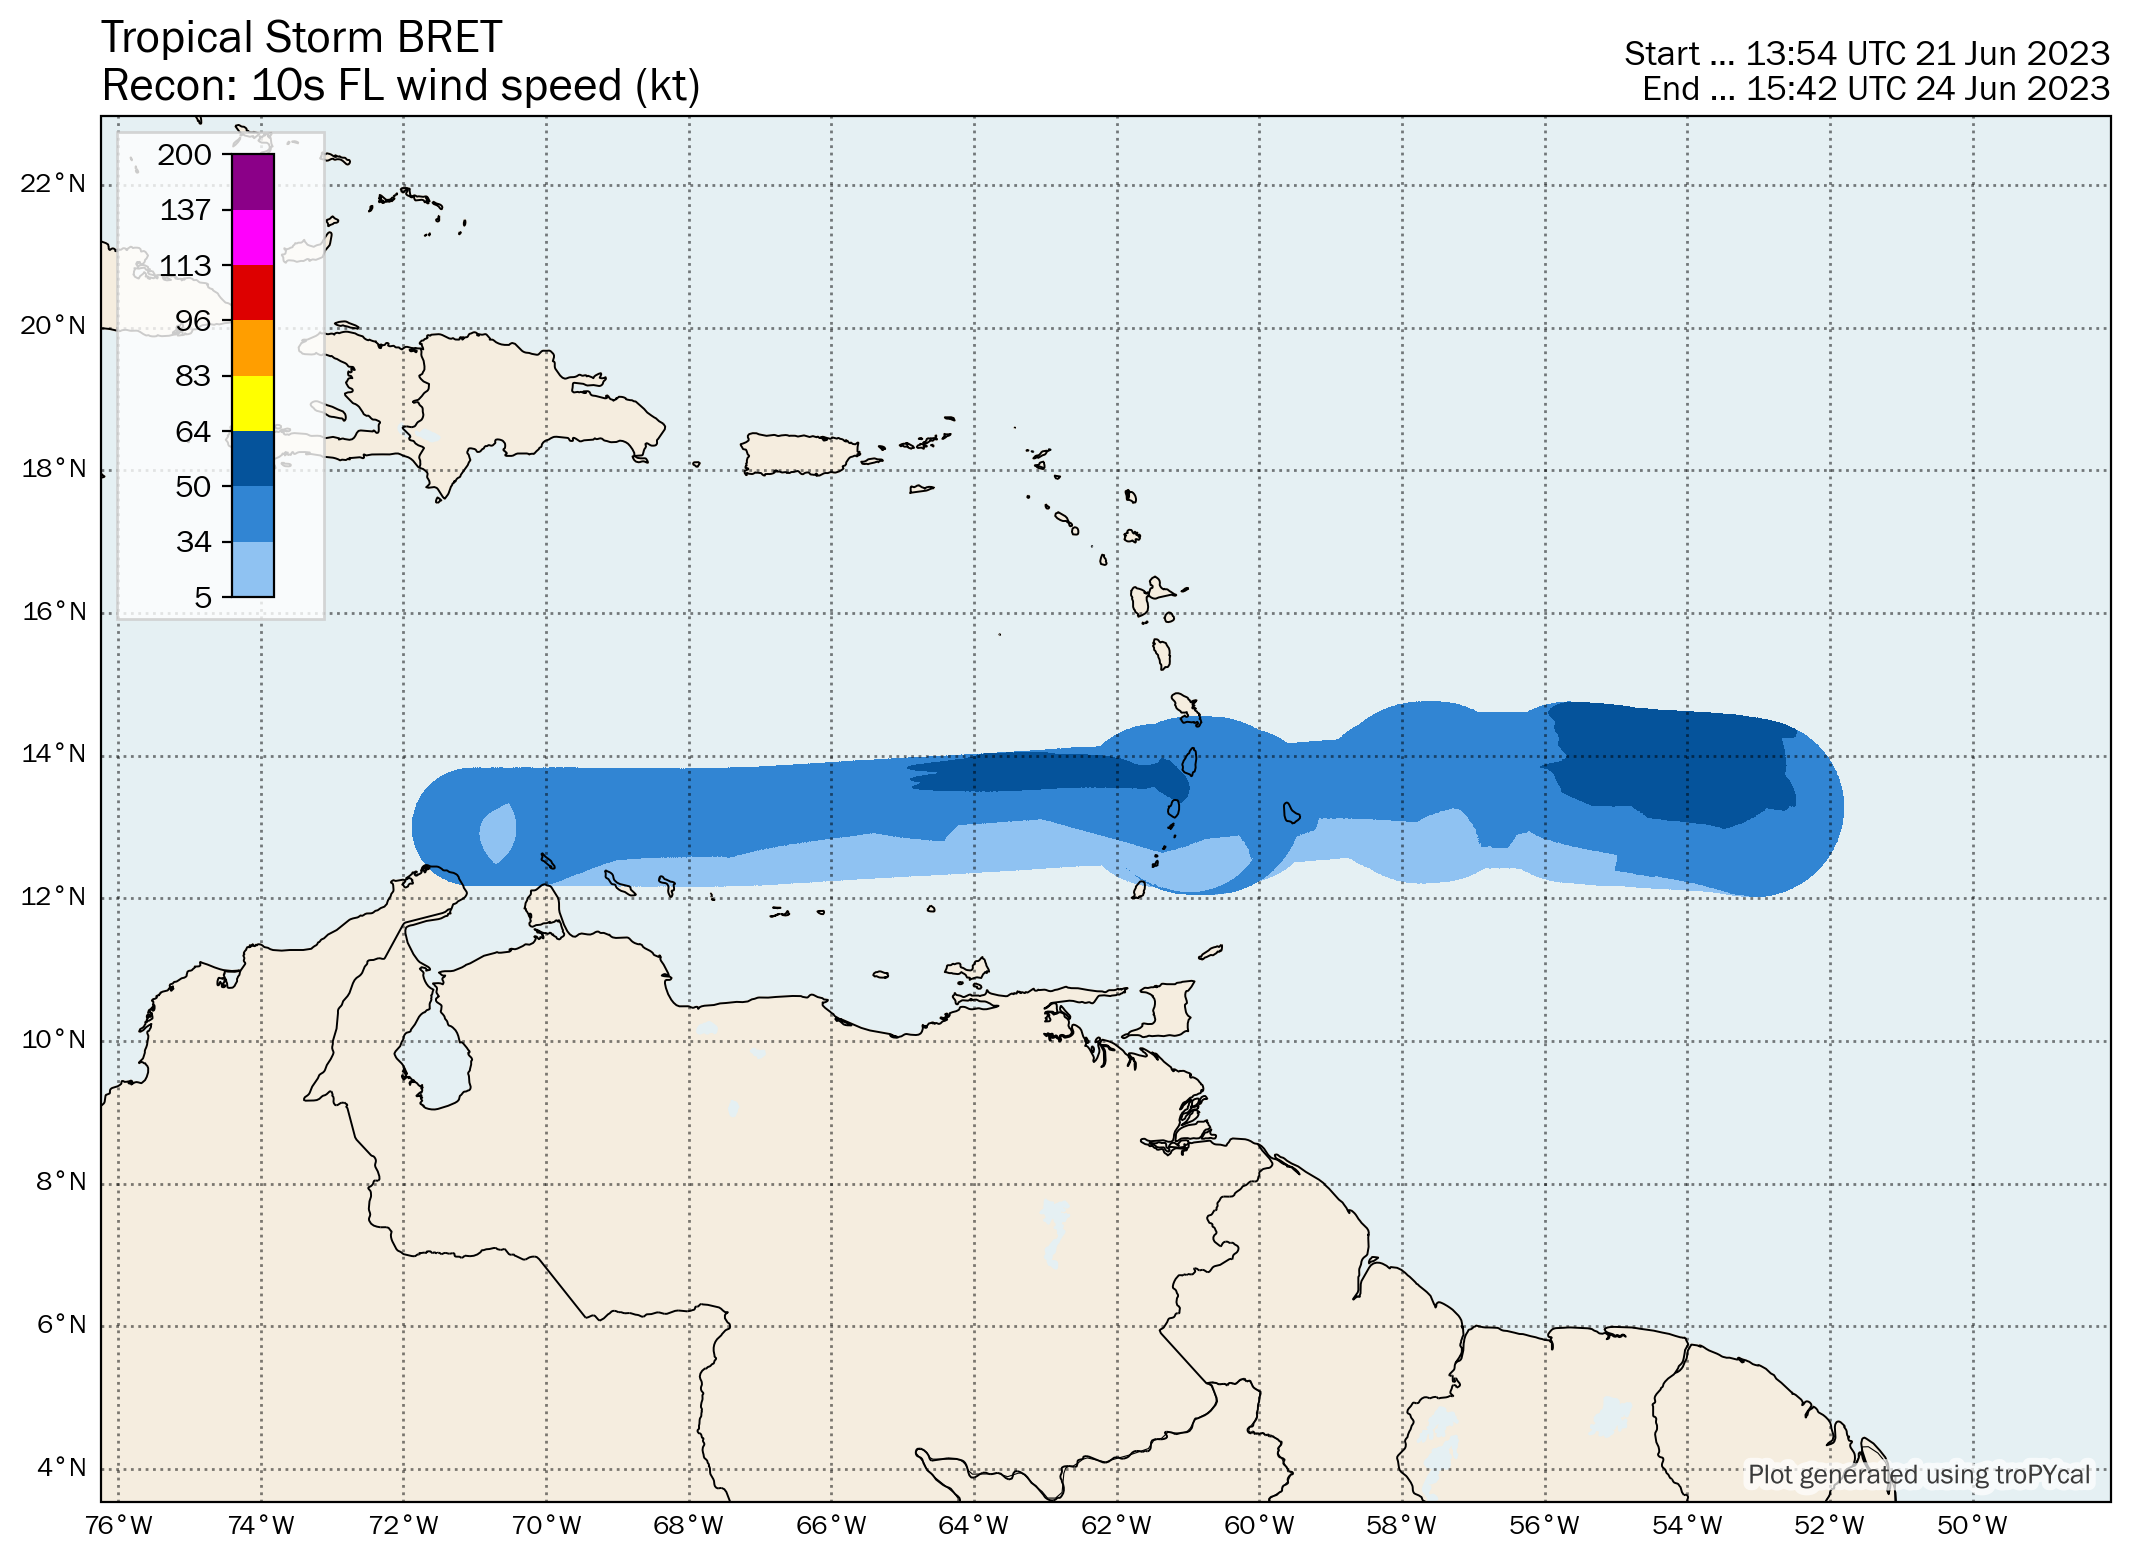
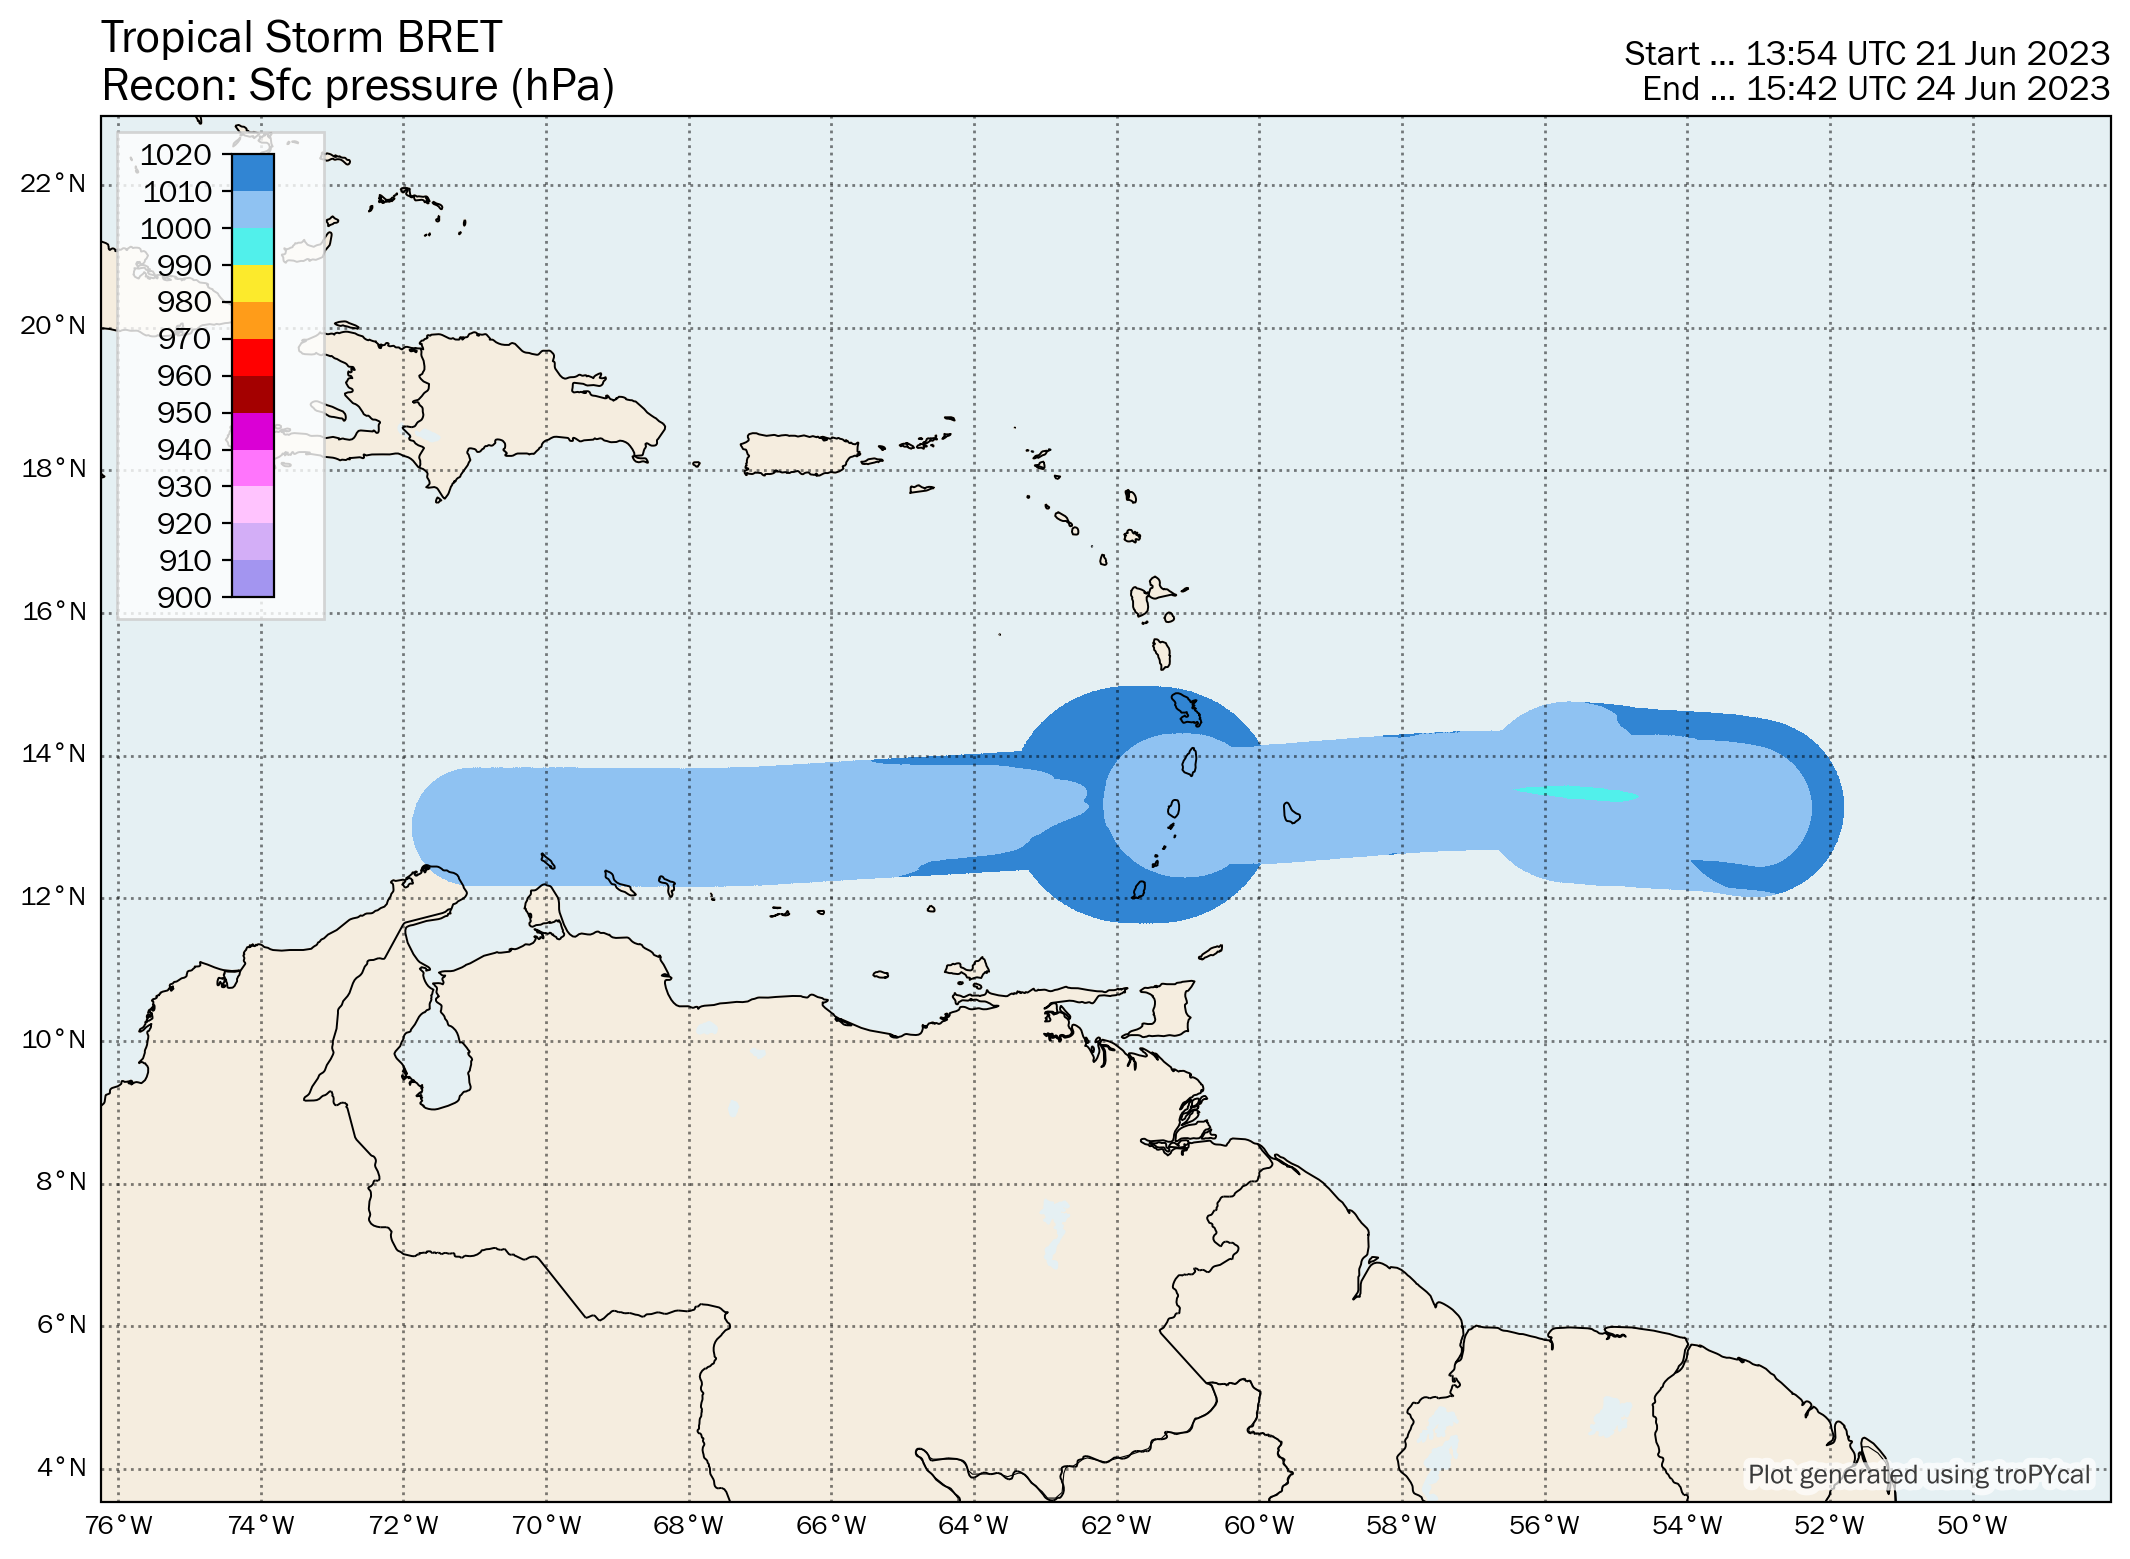
| S | Tropical Storm Bret | 60 kt | 996 hPa | 06z 06/19 | 12z 06/24 | 4.5 |
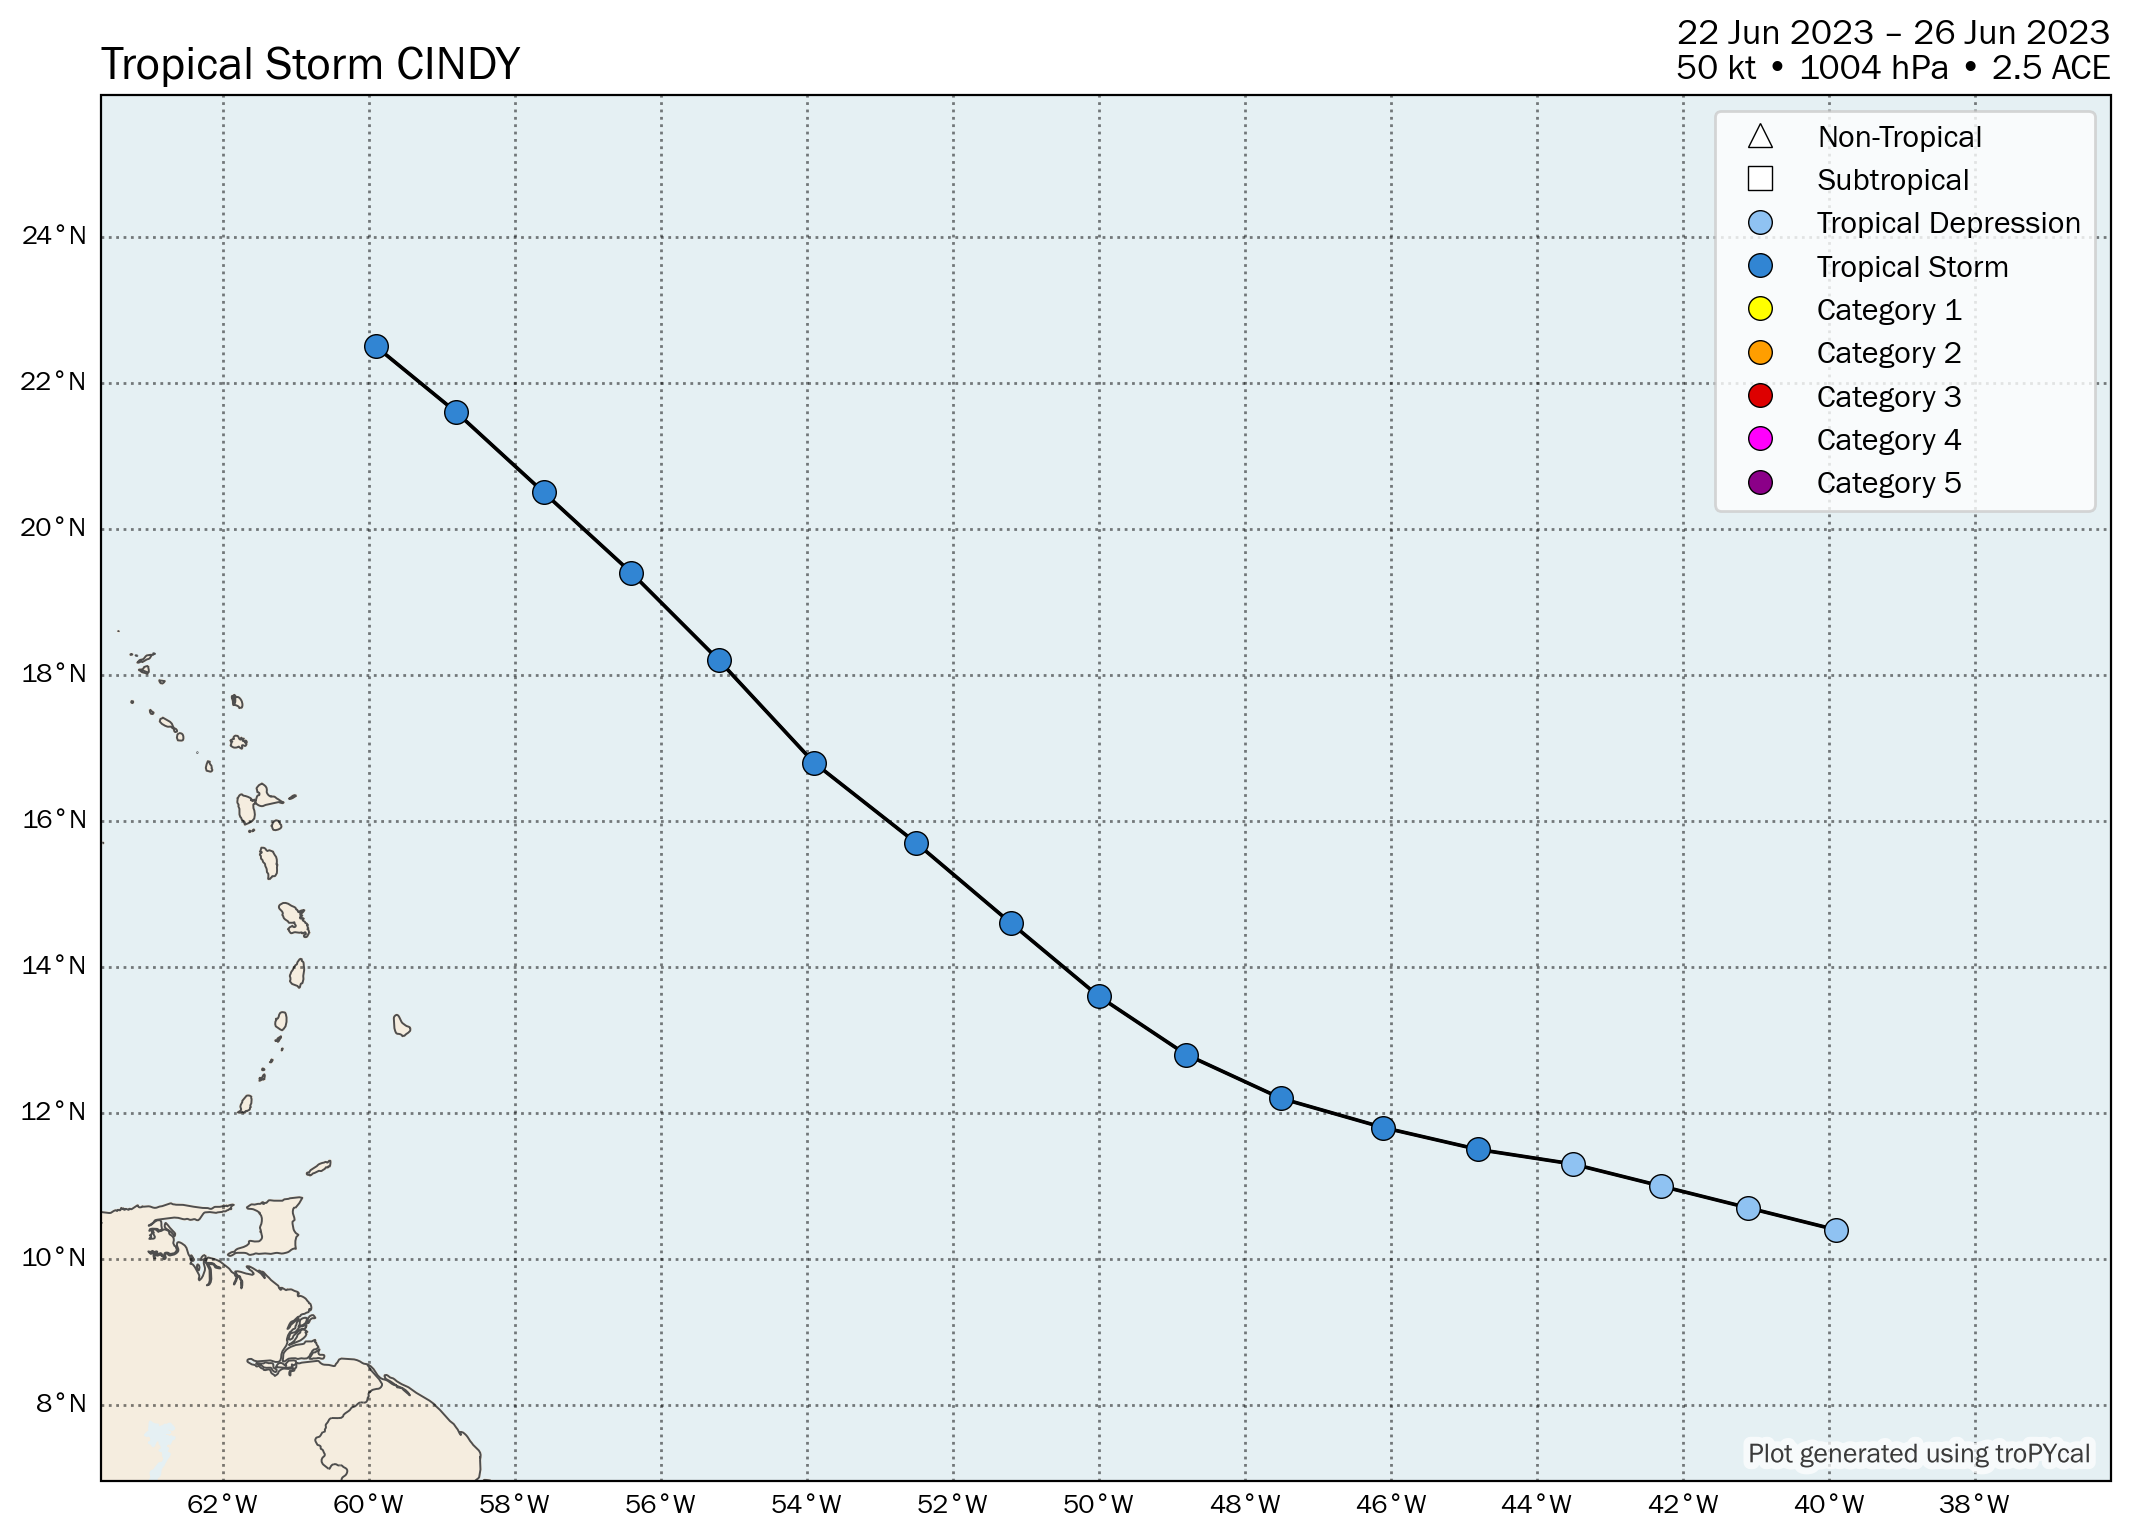
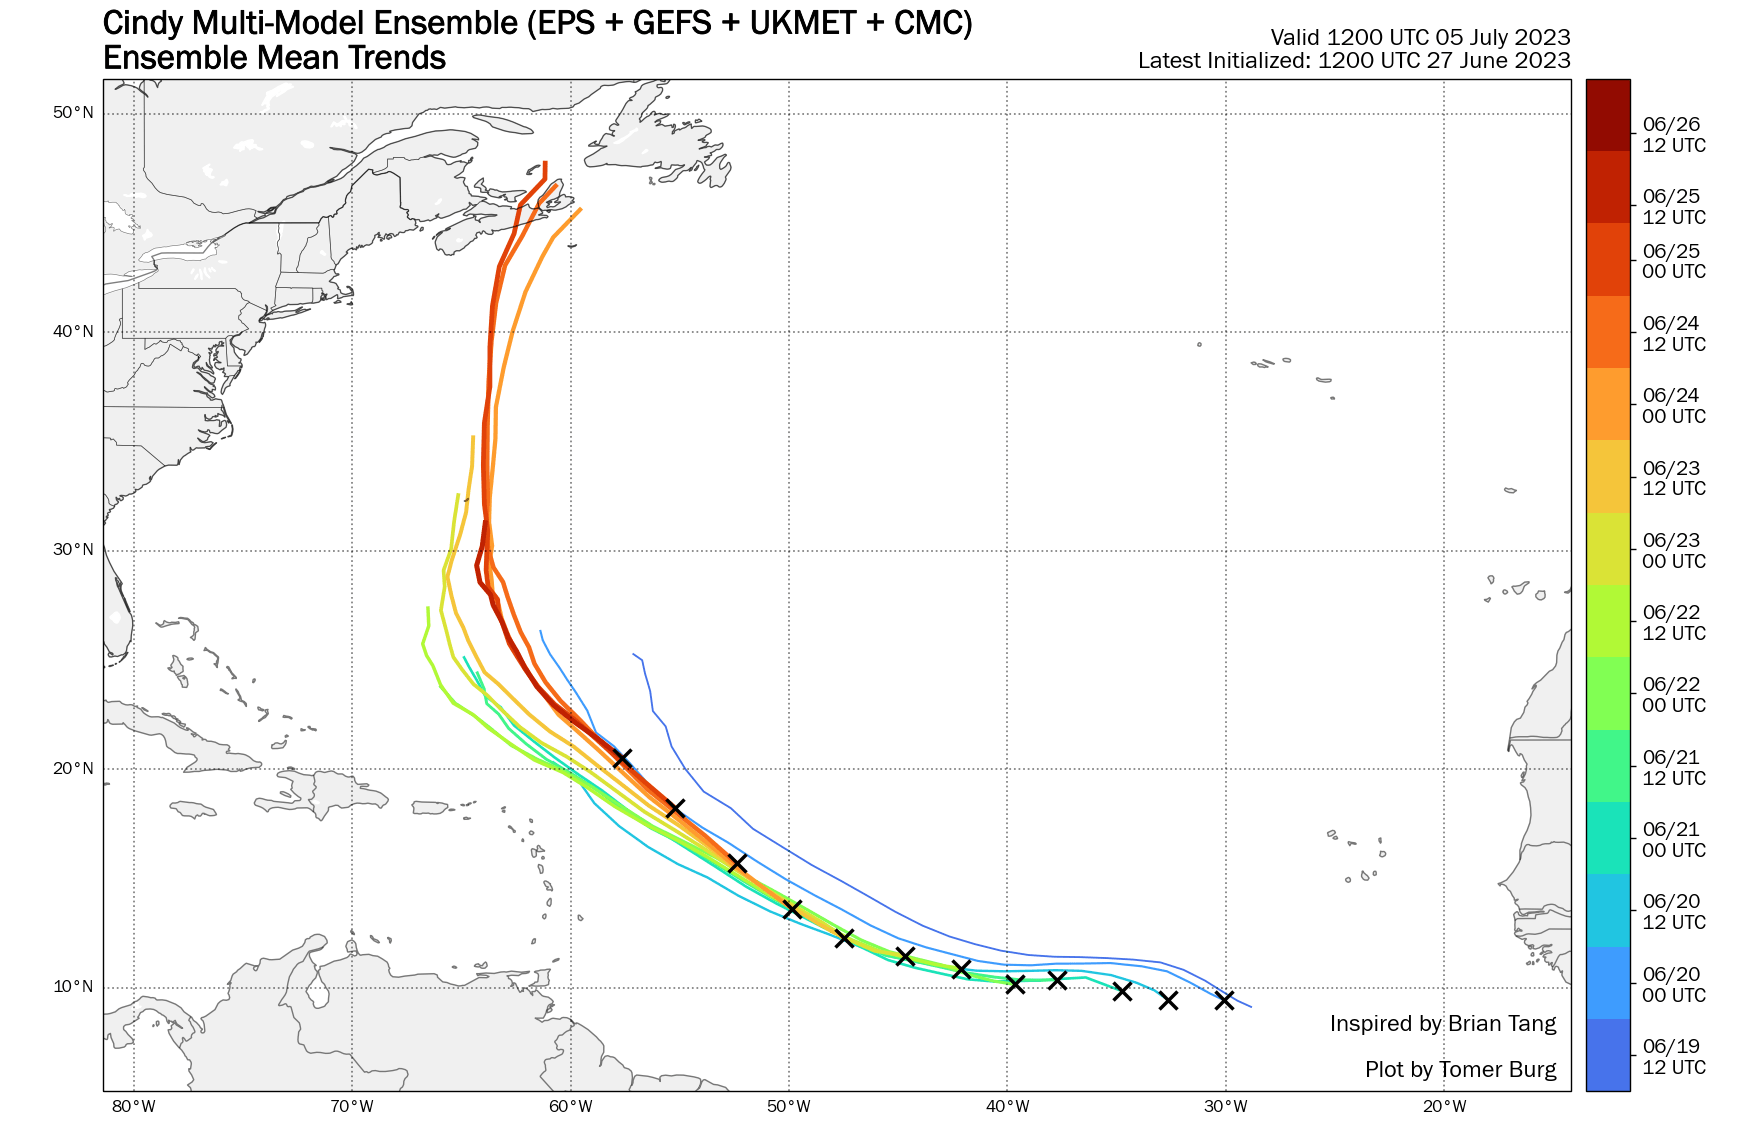
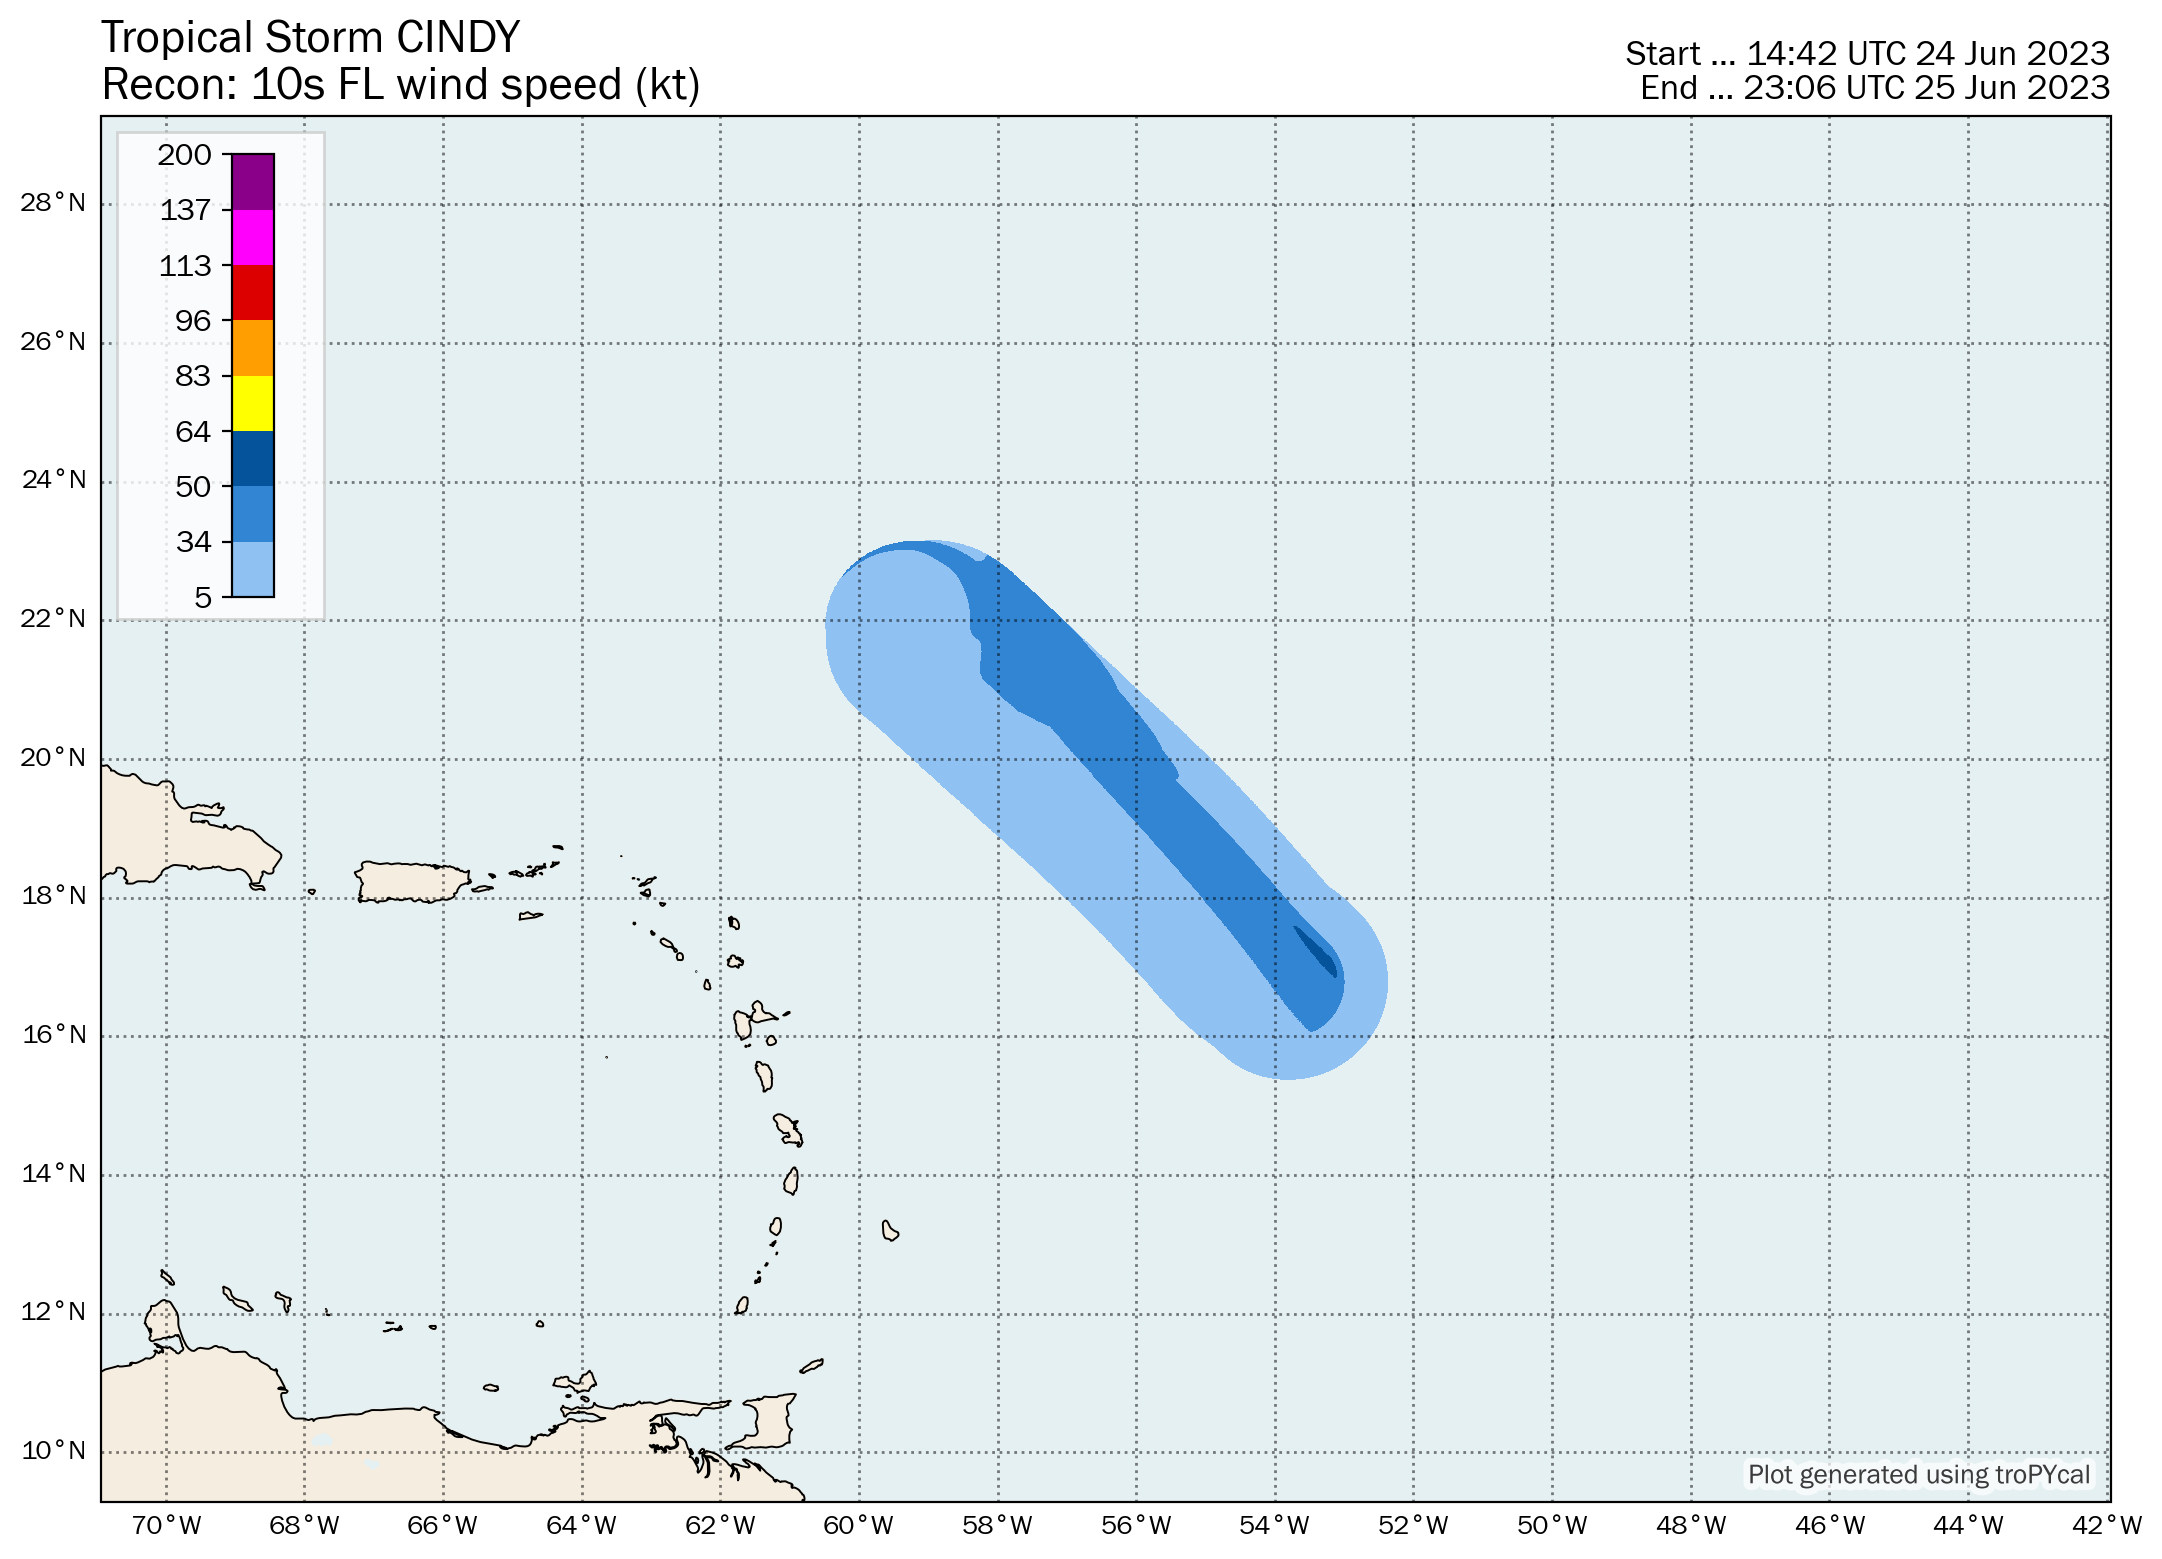
| S | Tropical Storm Cindy | 50 kt | 1004 hPa | 00z 06/22 | 00z 06/26 | 2.5 |
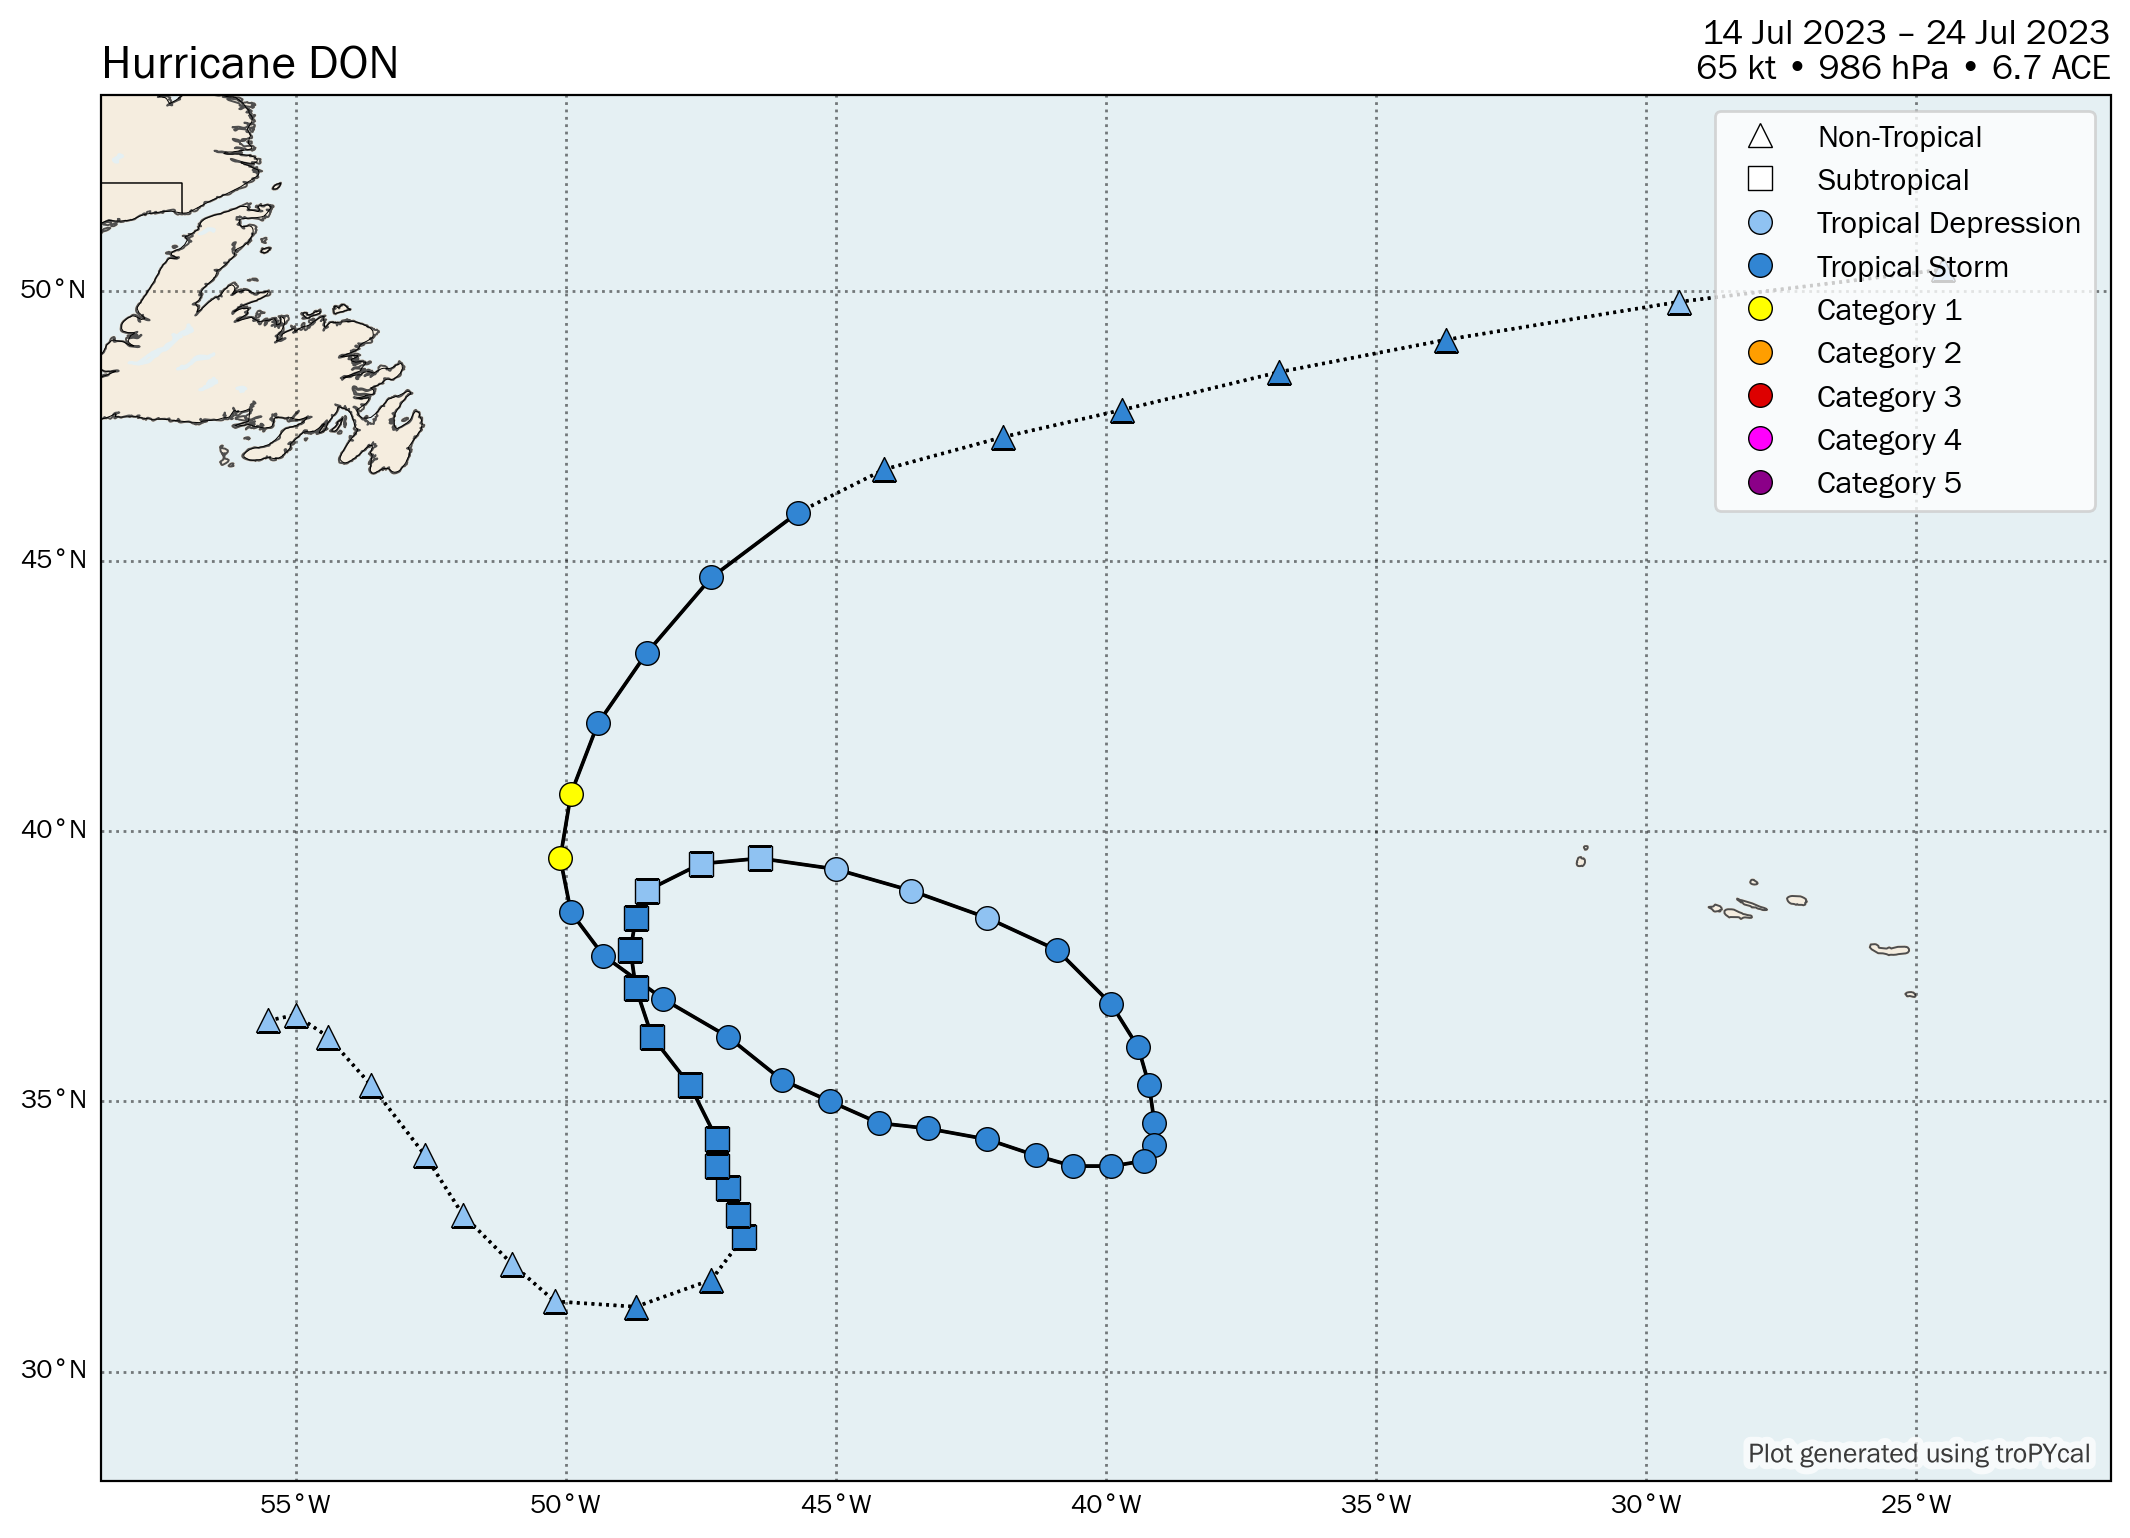
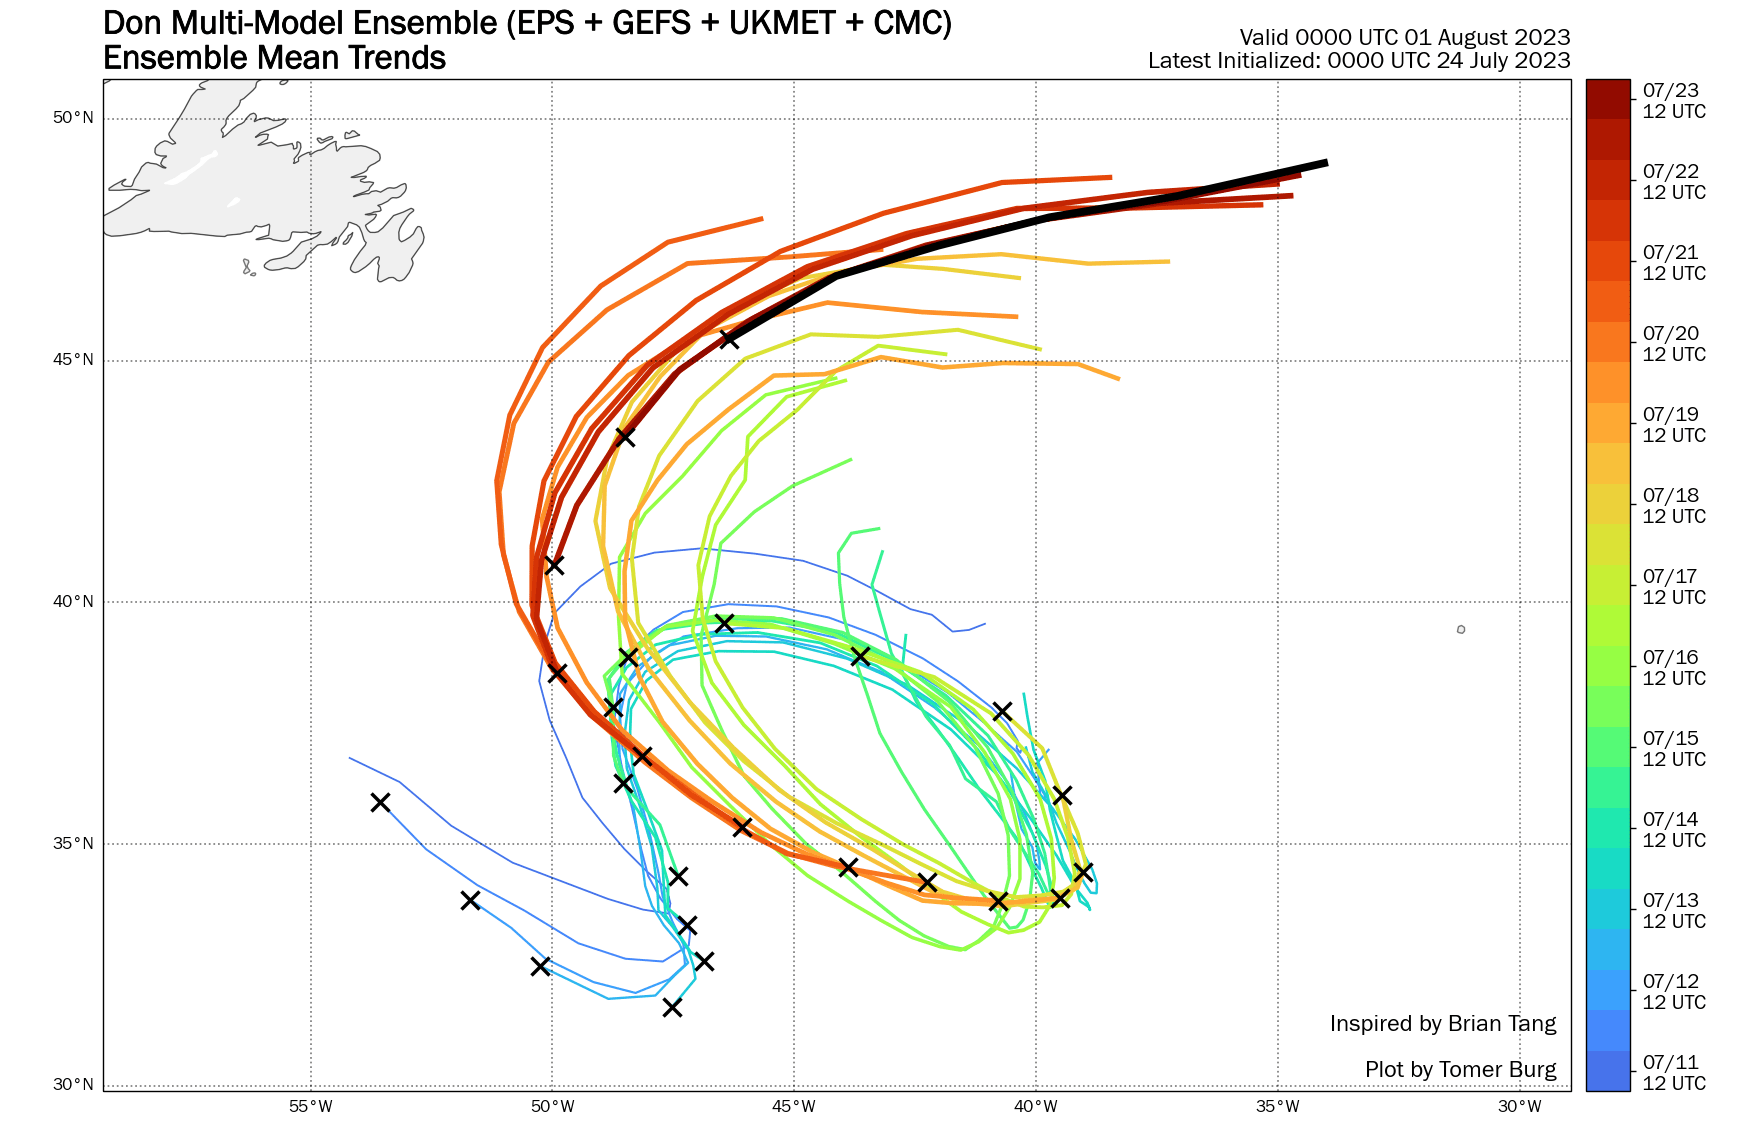
| 1 | Hurricane Don | 65 kt | 986 hPa | 00z 07/14 | 00z 07/24 | 6.7 |
| S | Tropical Storm Gert | 50 kt | 998 hPa | 06z 08/19 | 06z 09/04 | 2.7 |
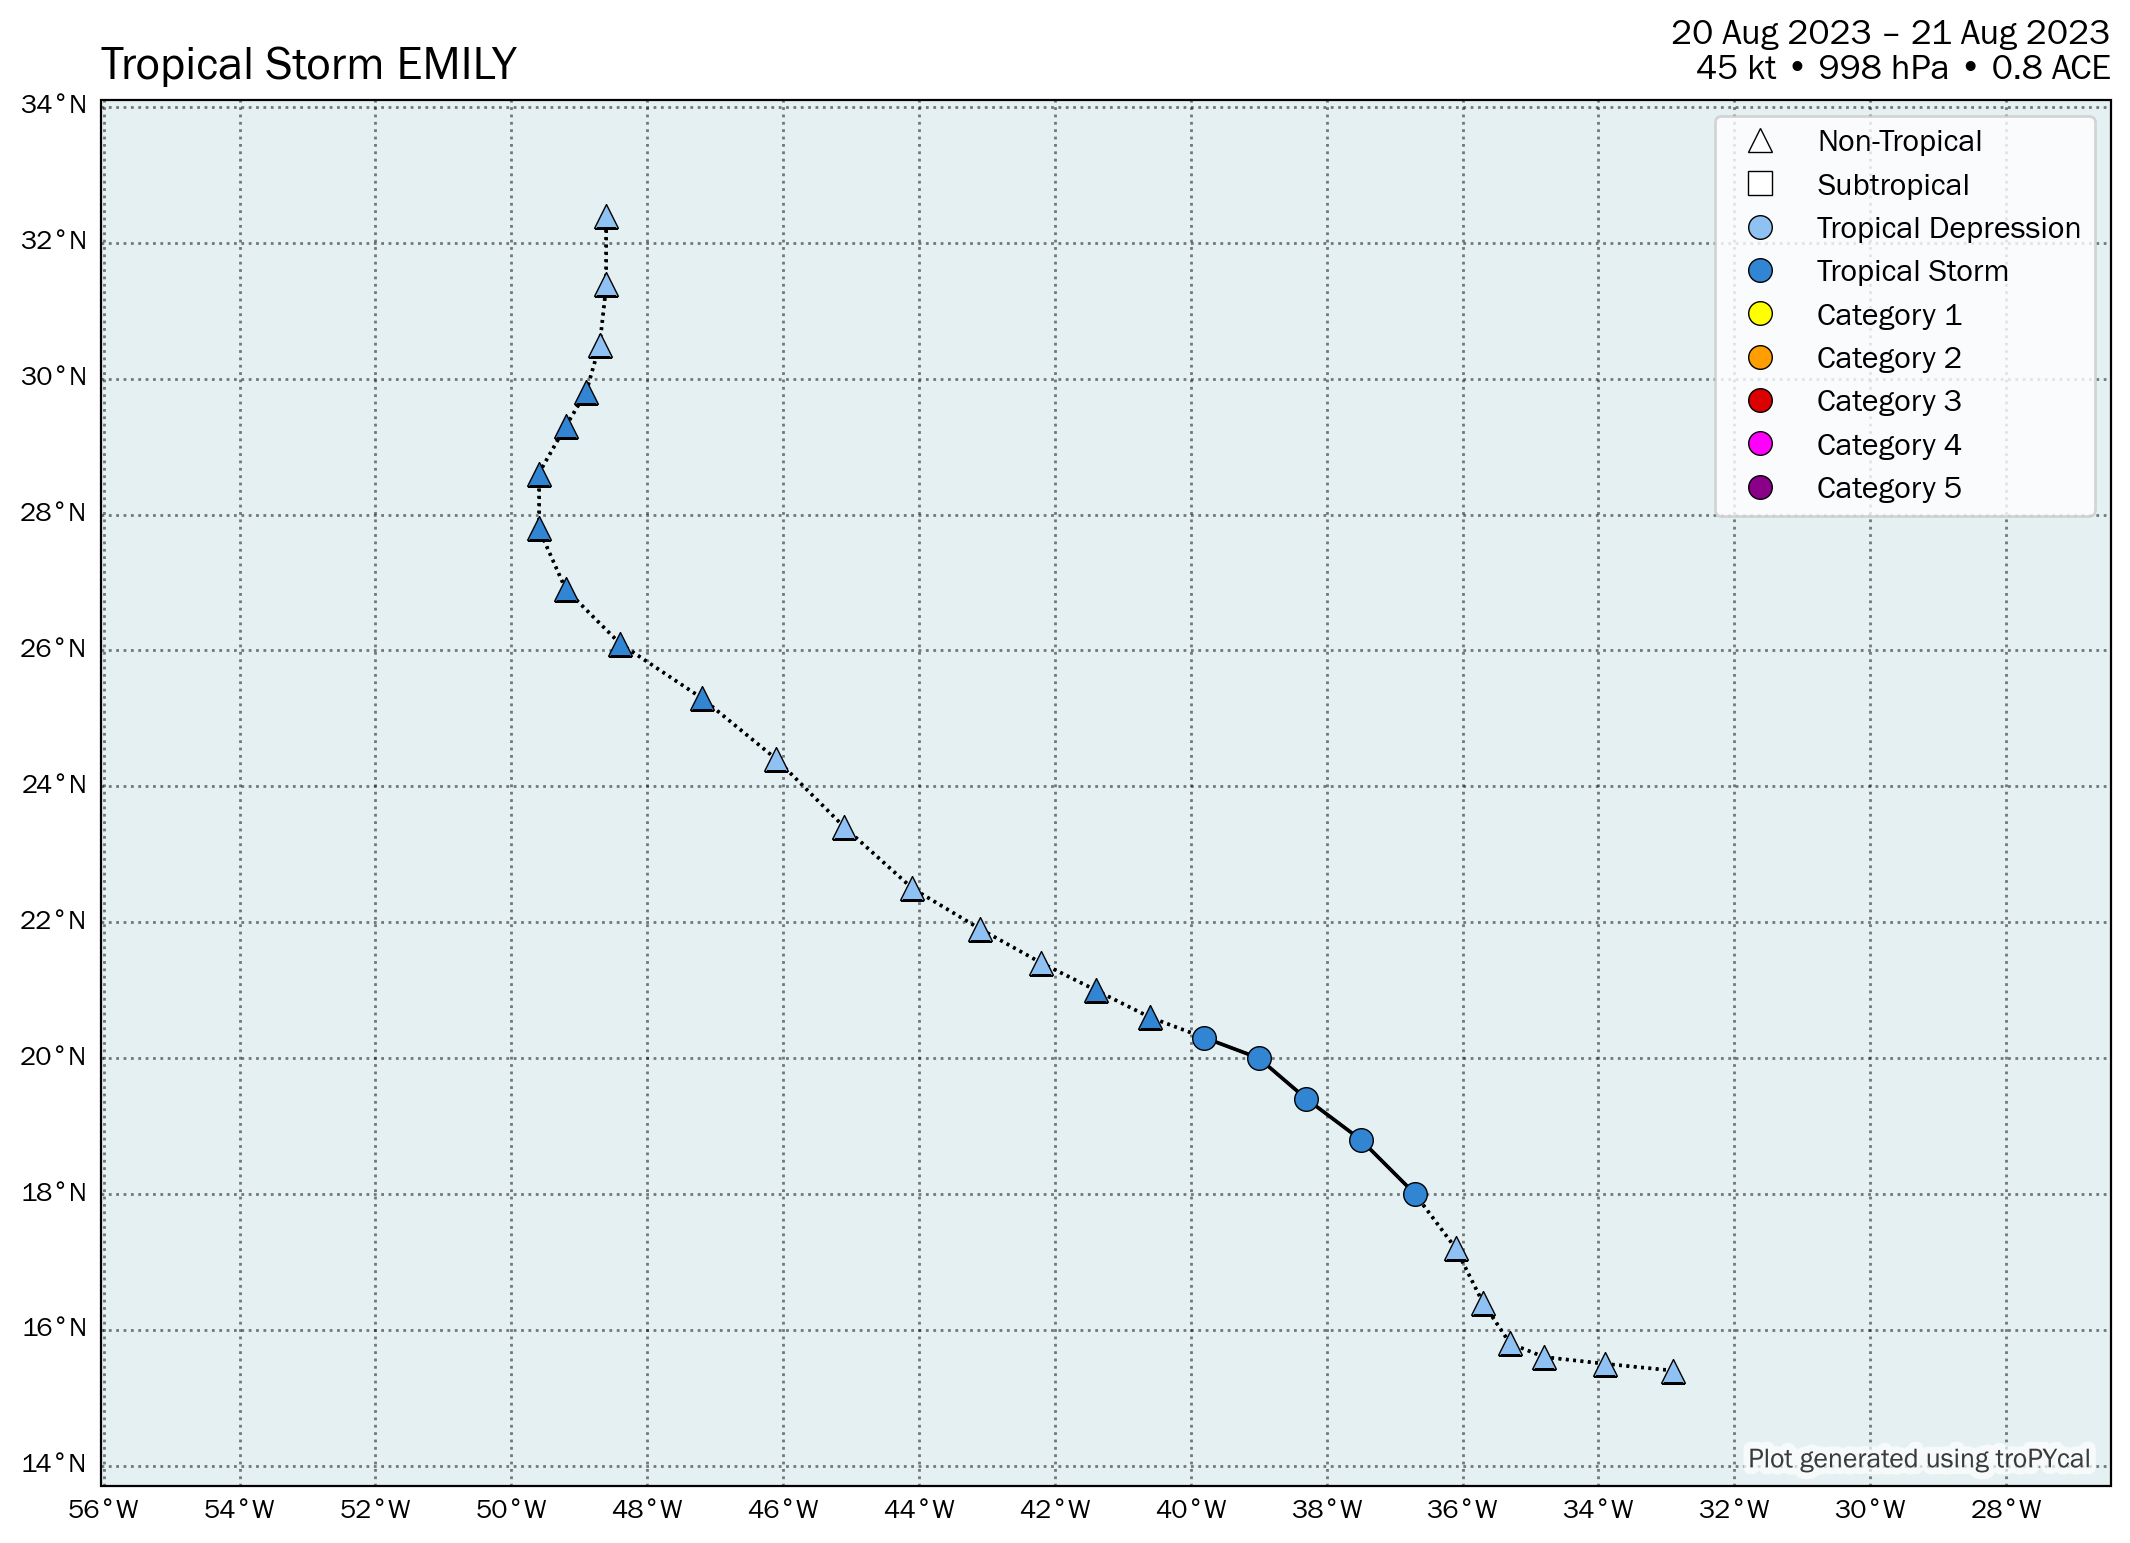
| S | Tropical Storm Emily | 45 kt | 998 hPa | 00z 08/20 | 00z 08/21 | 0.8 |
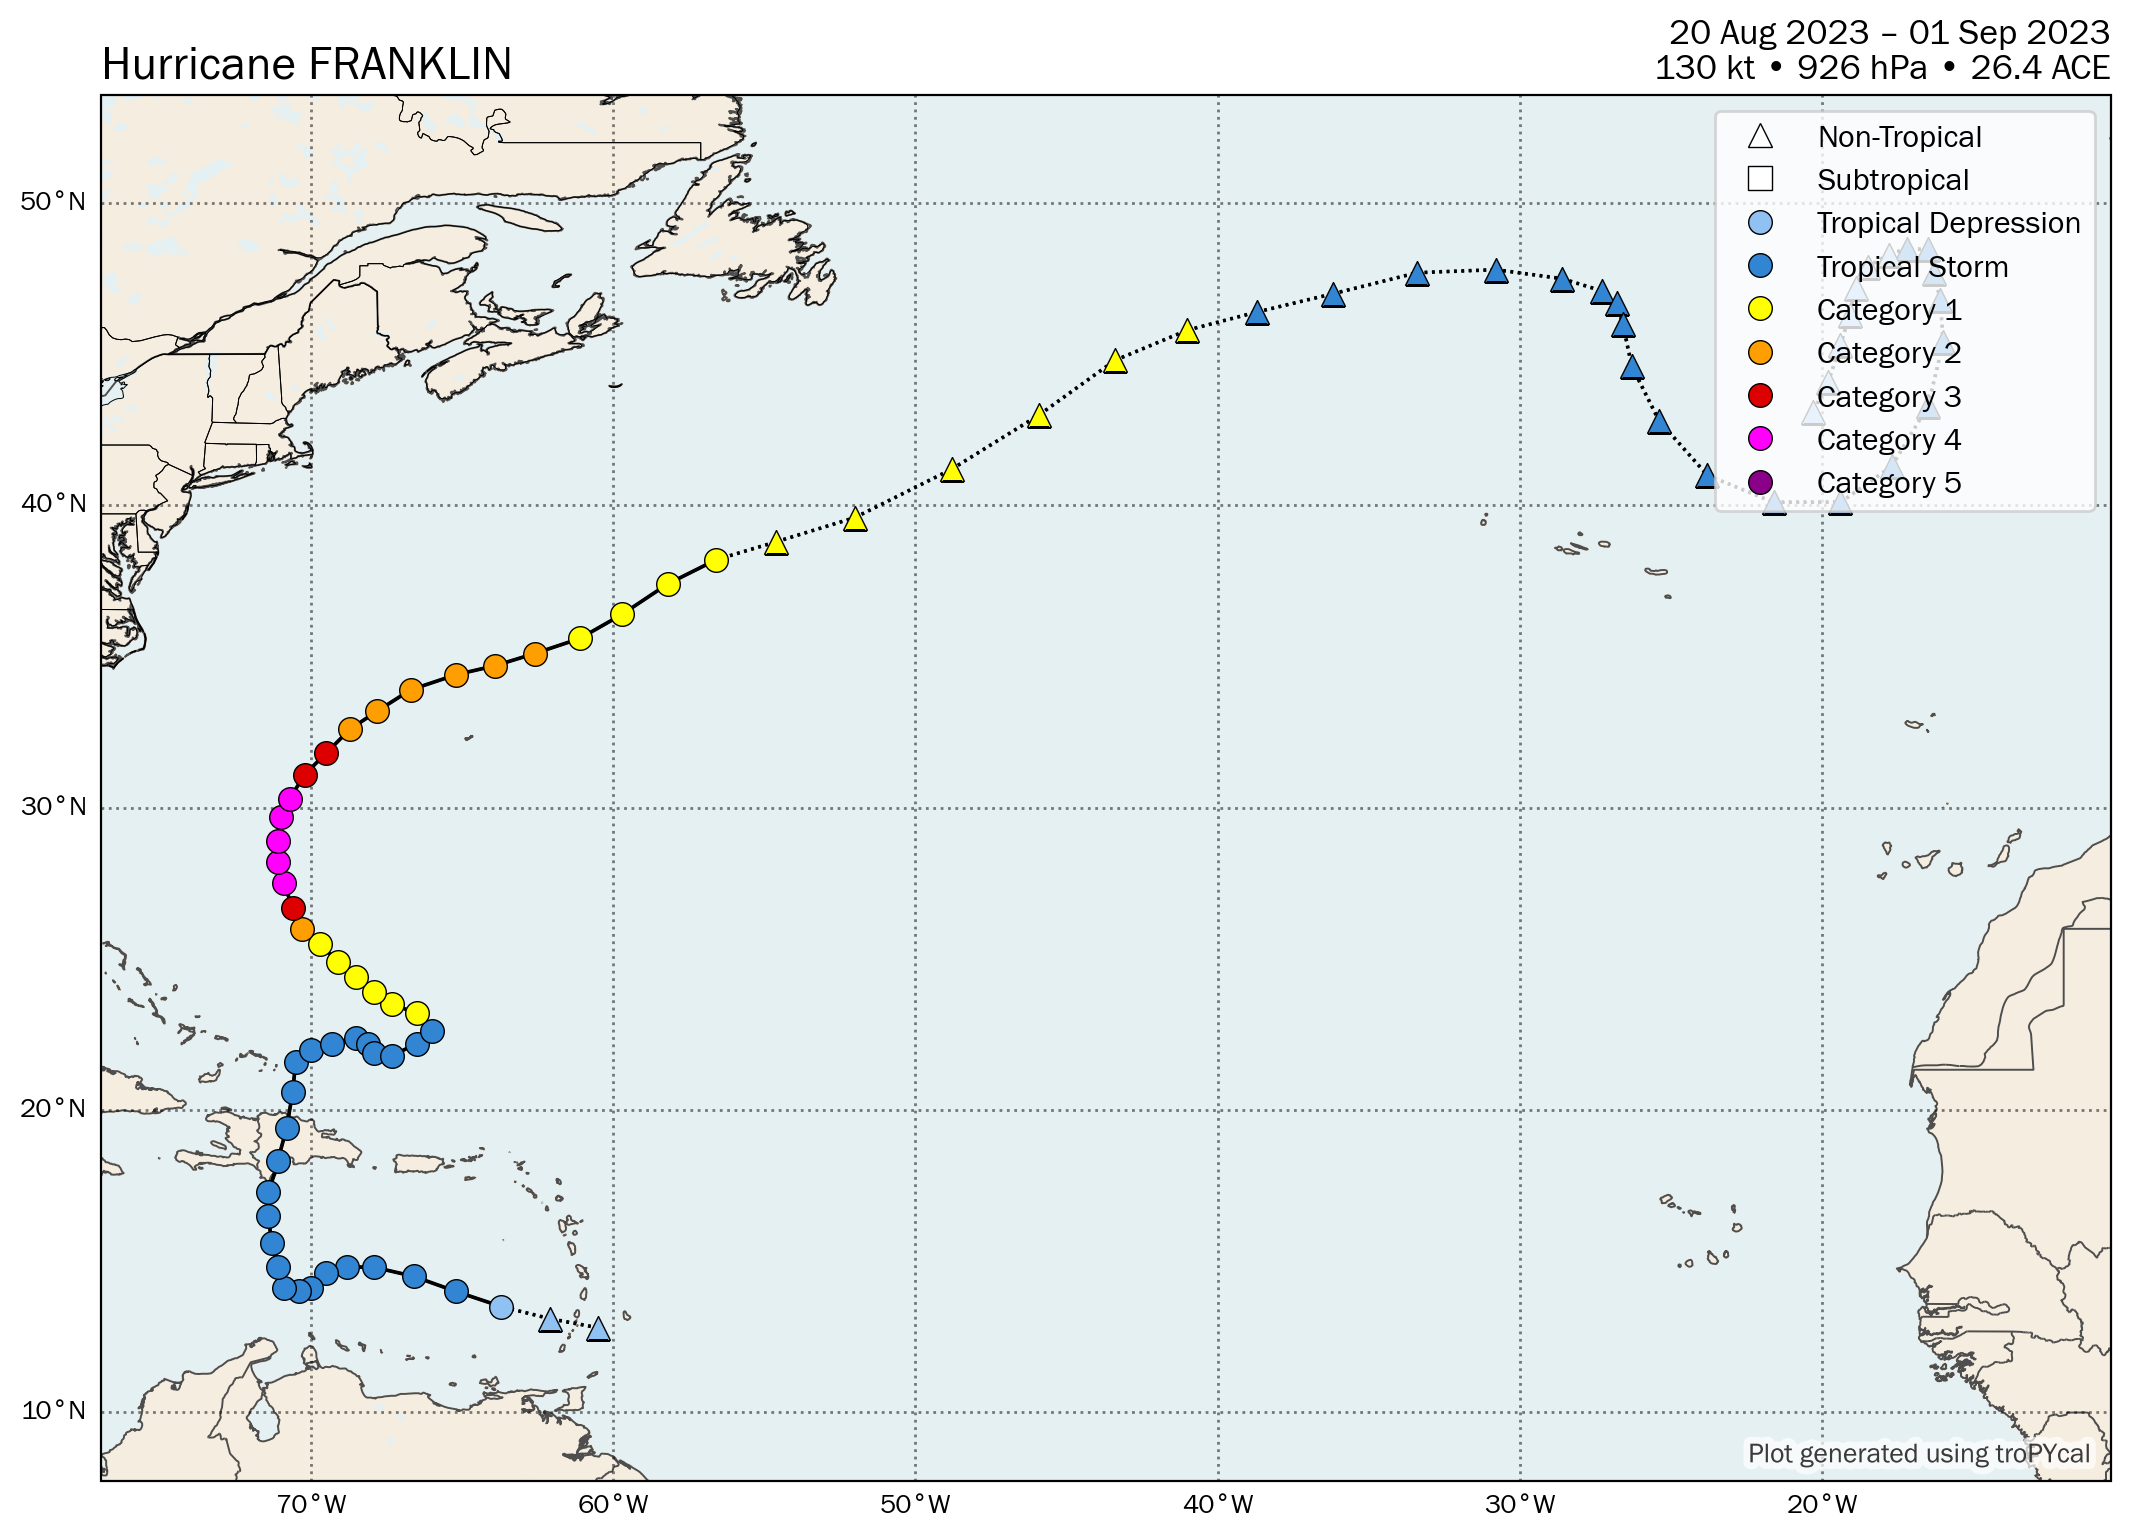
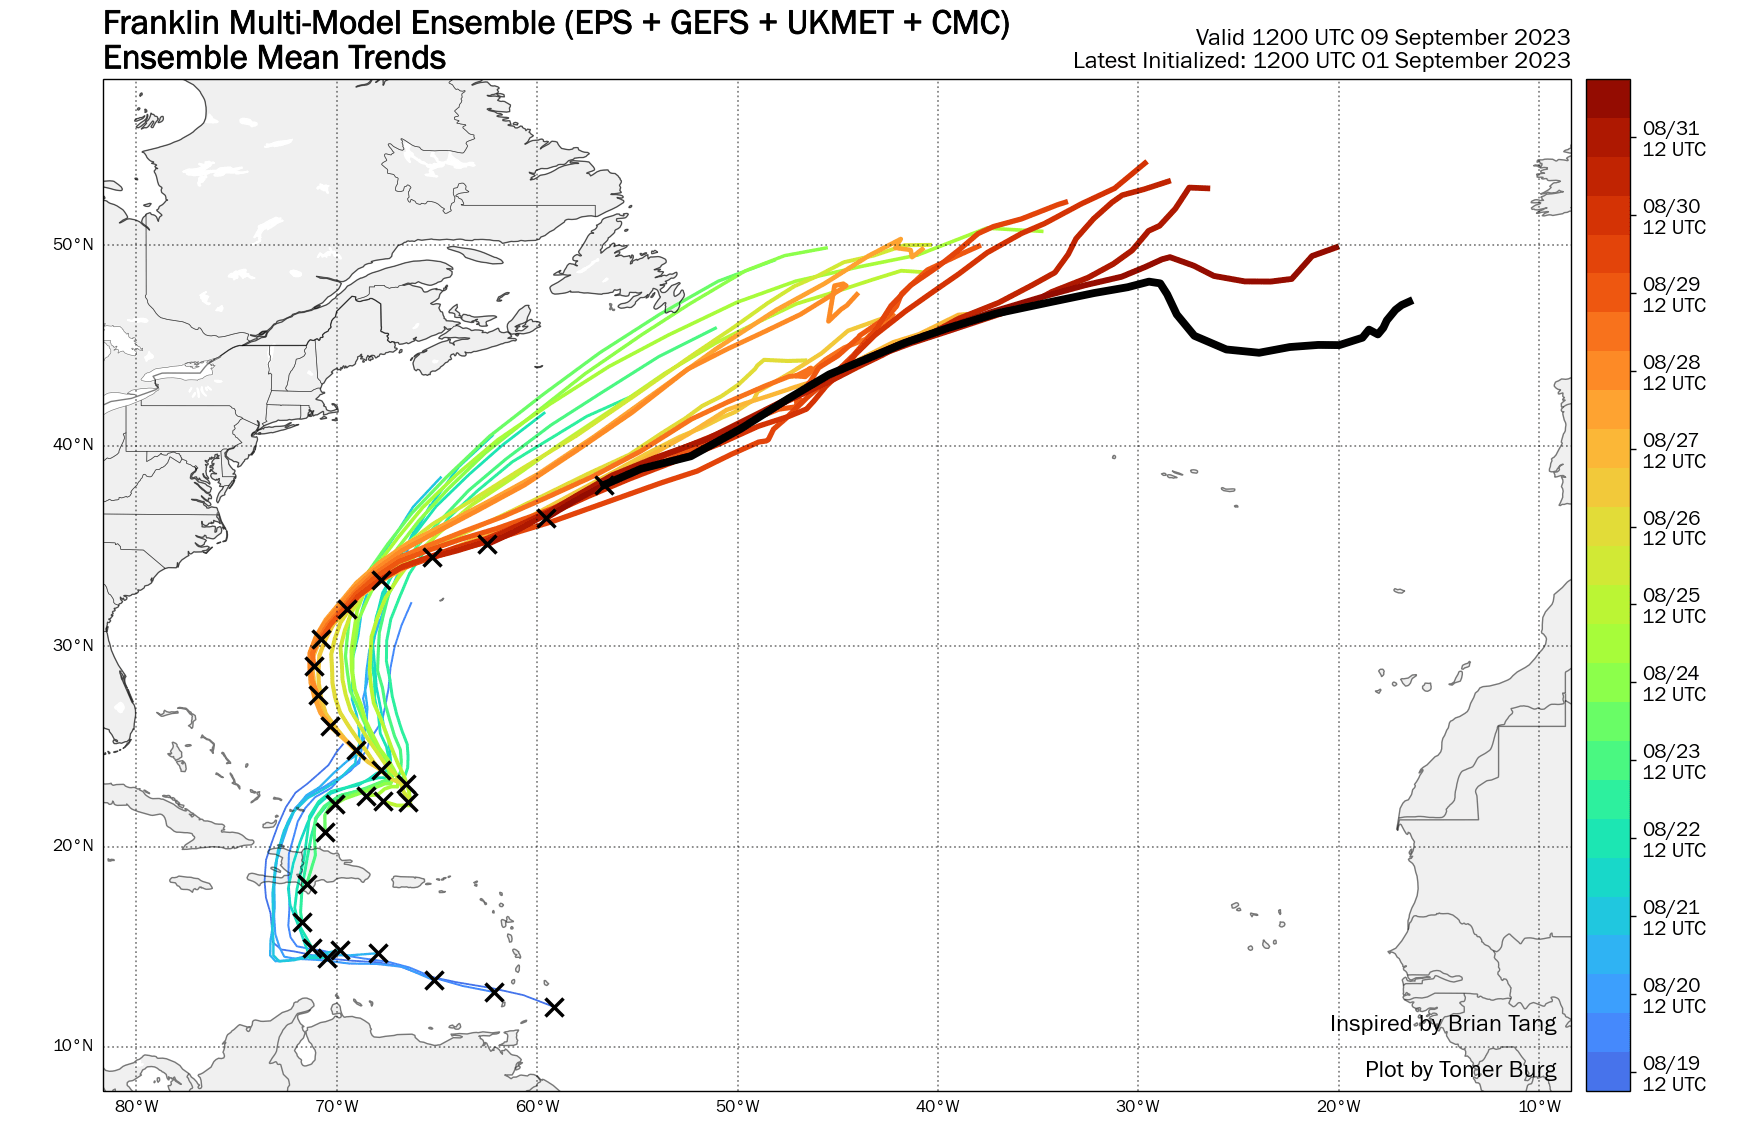
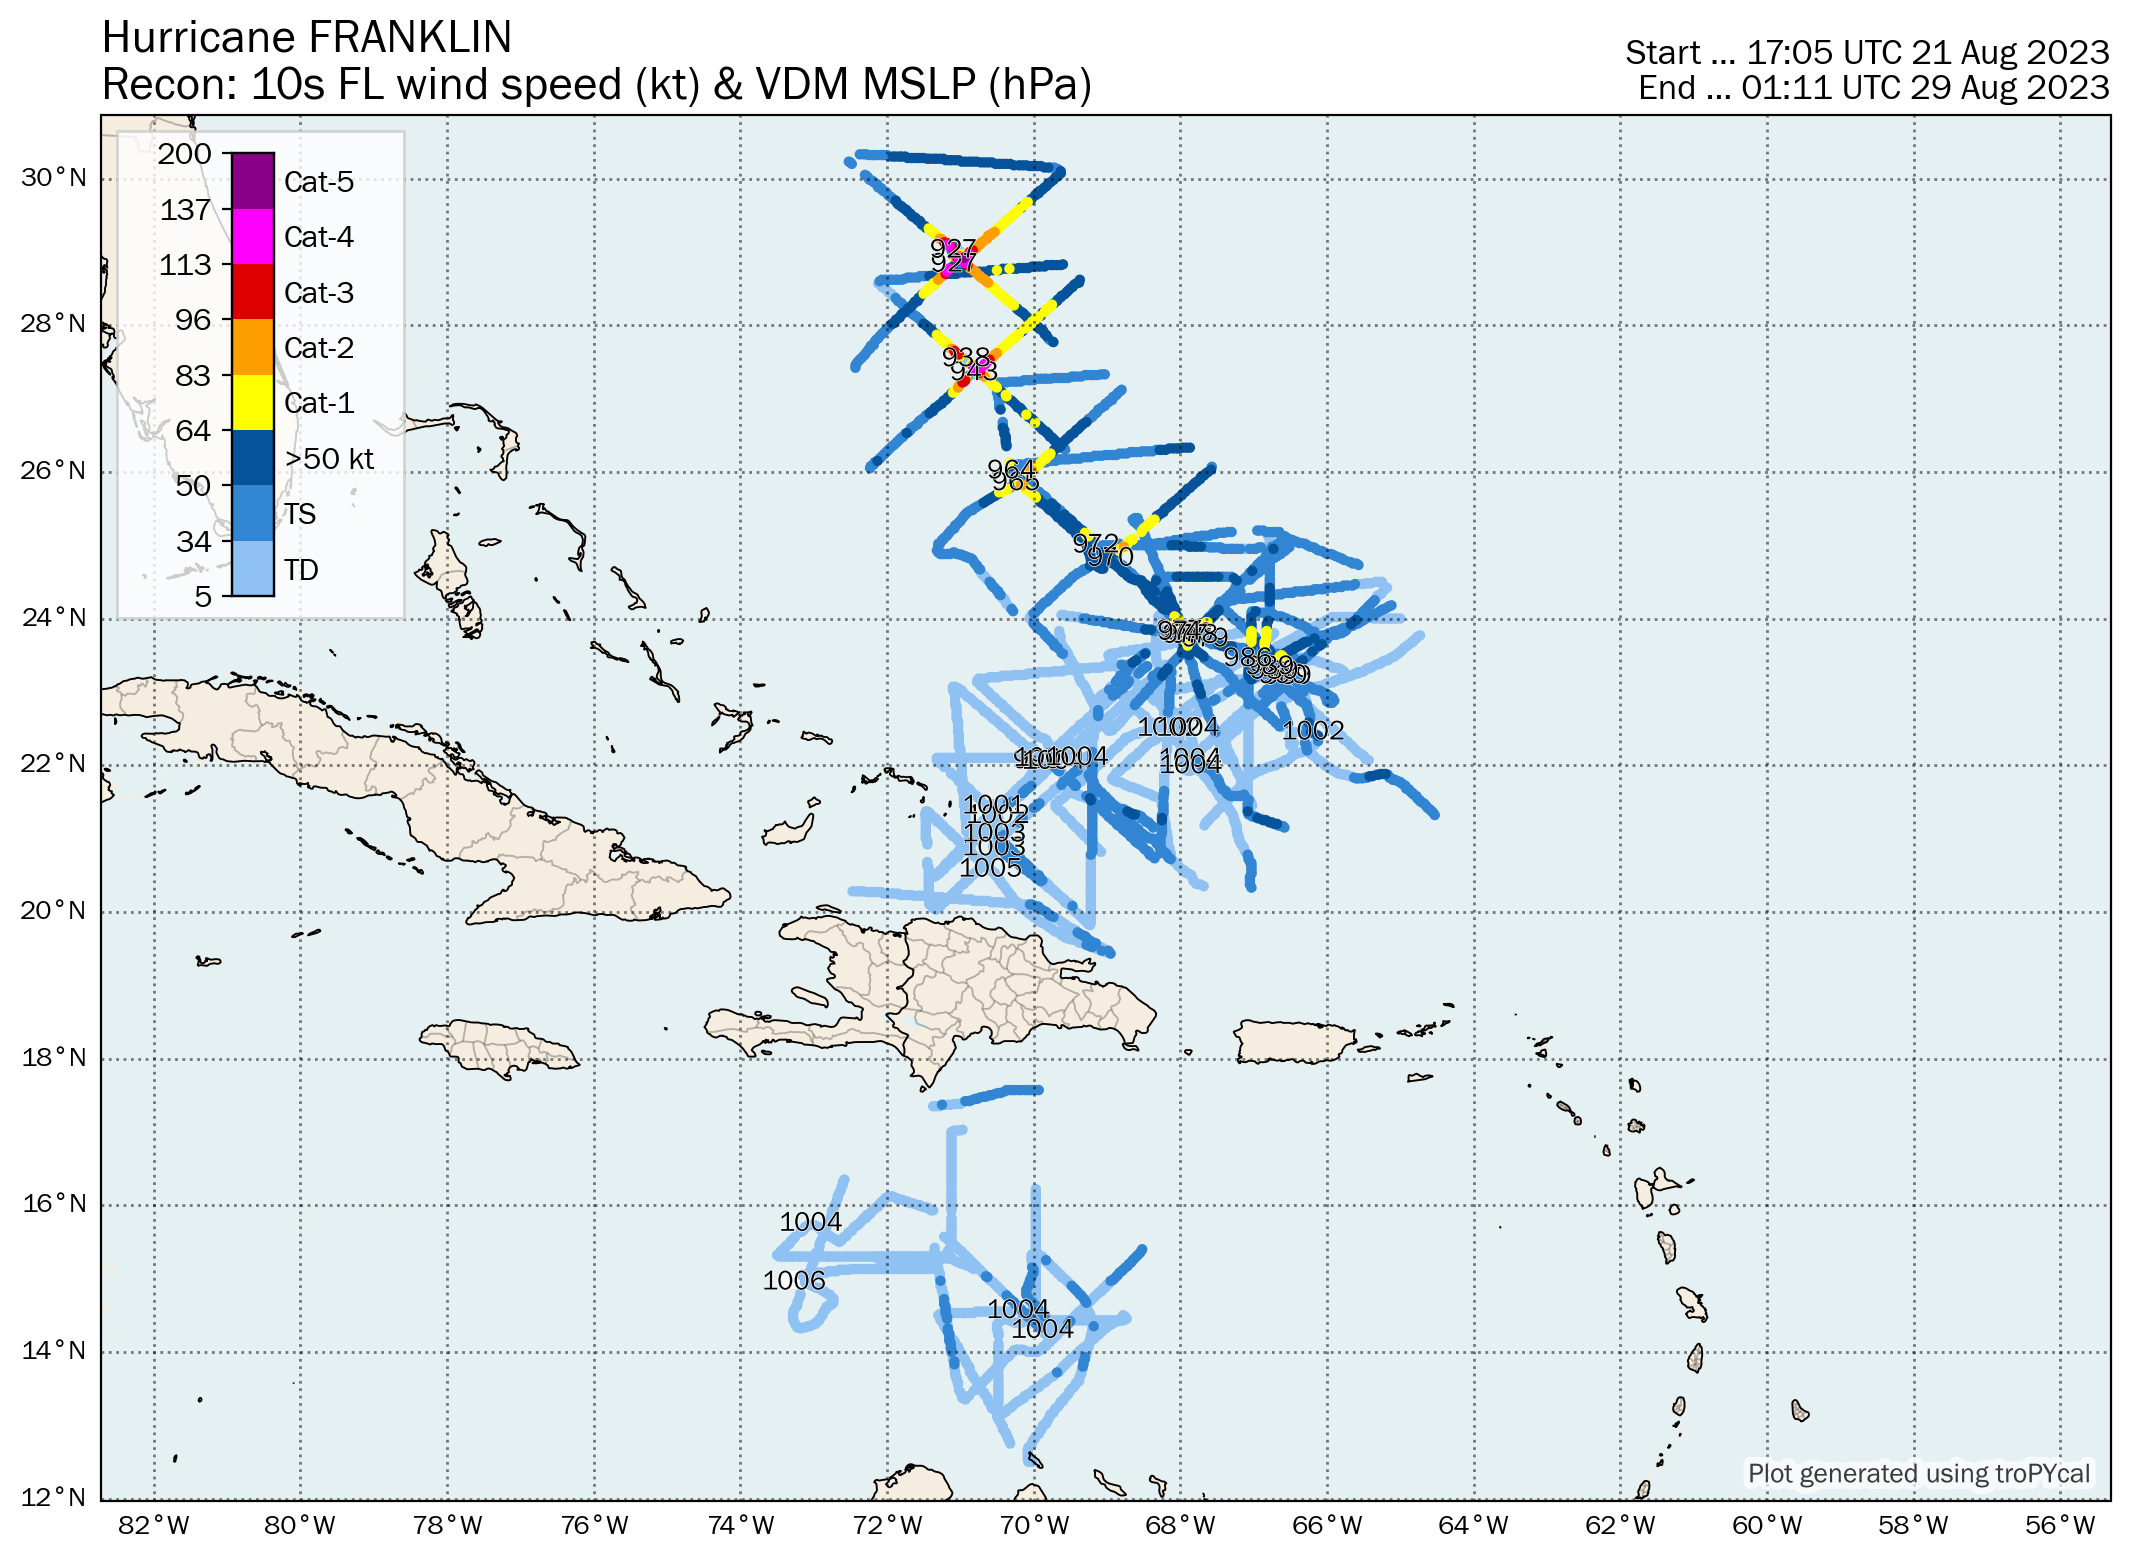
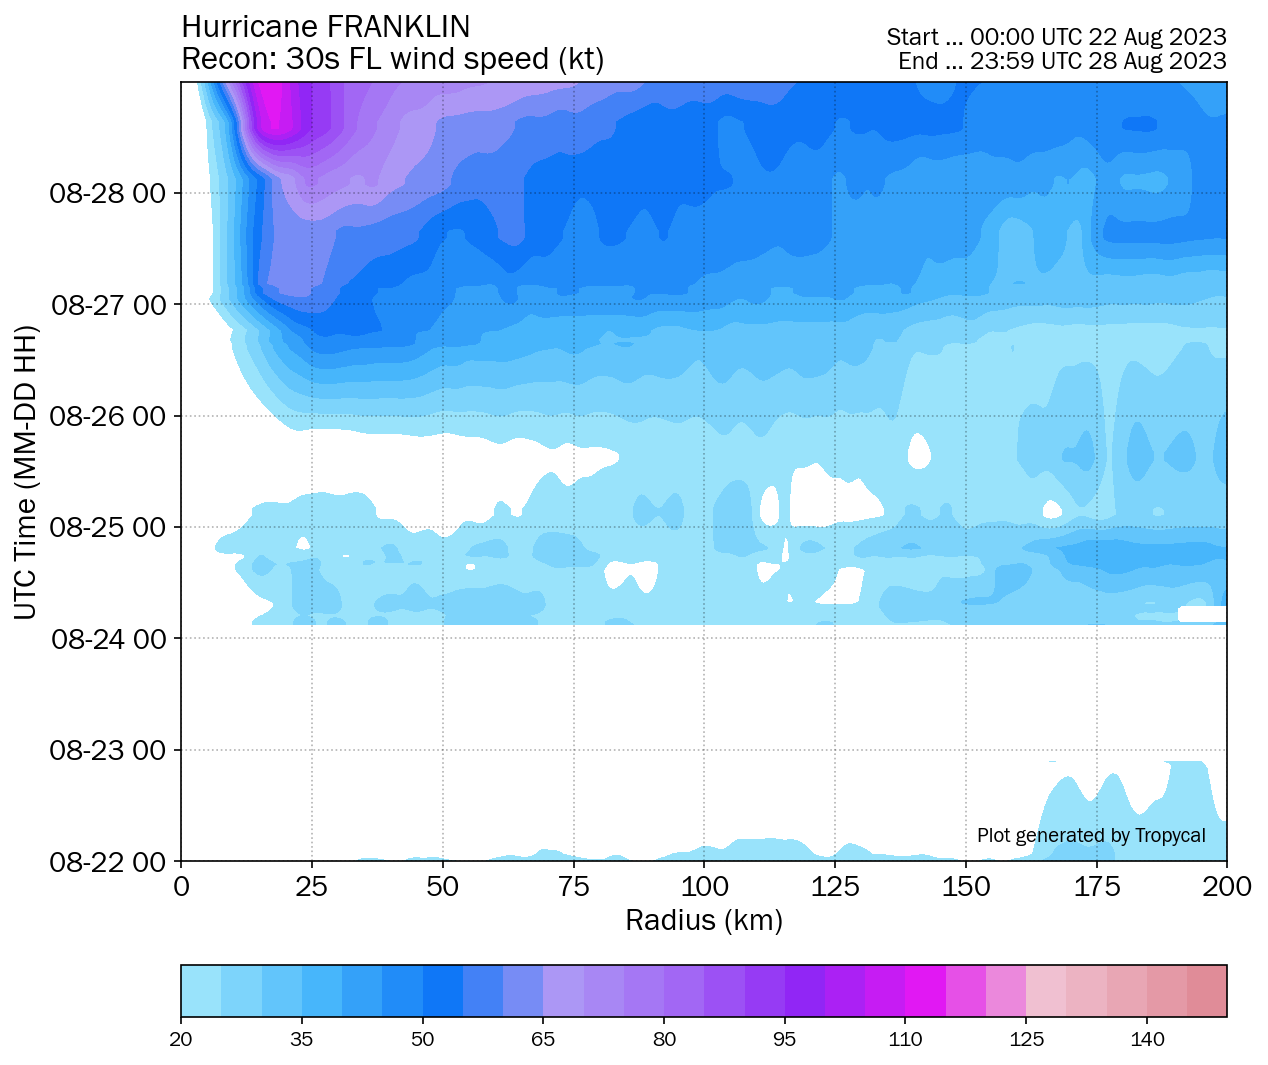
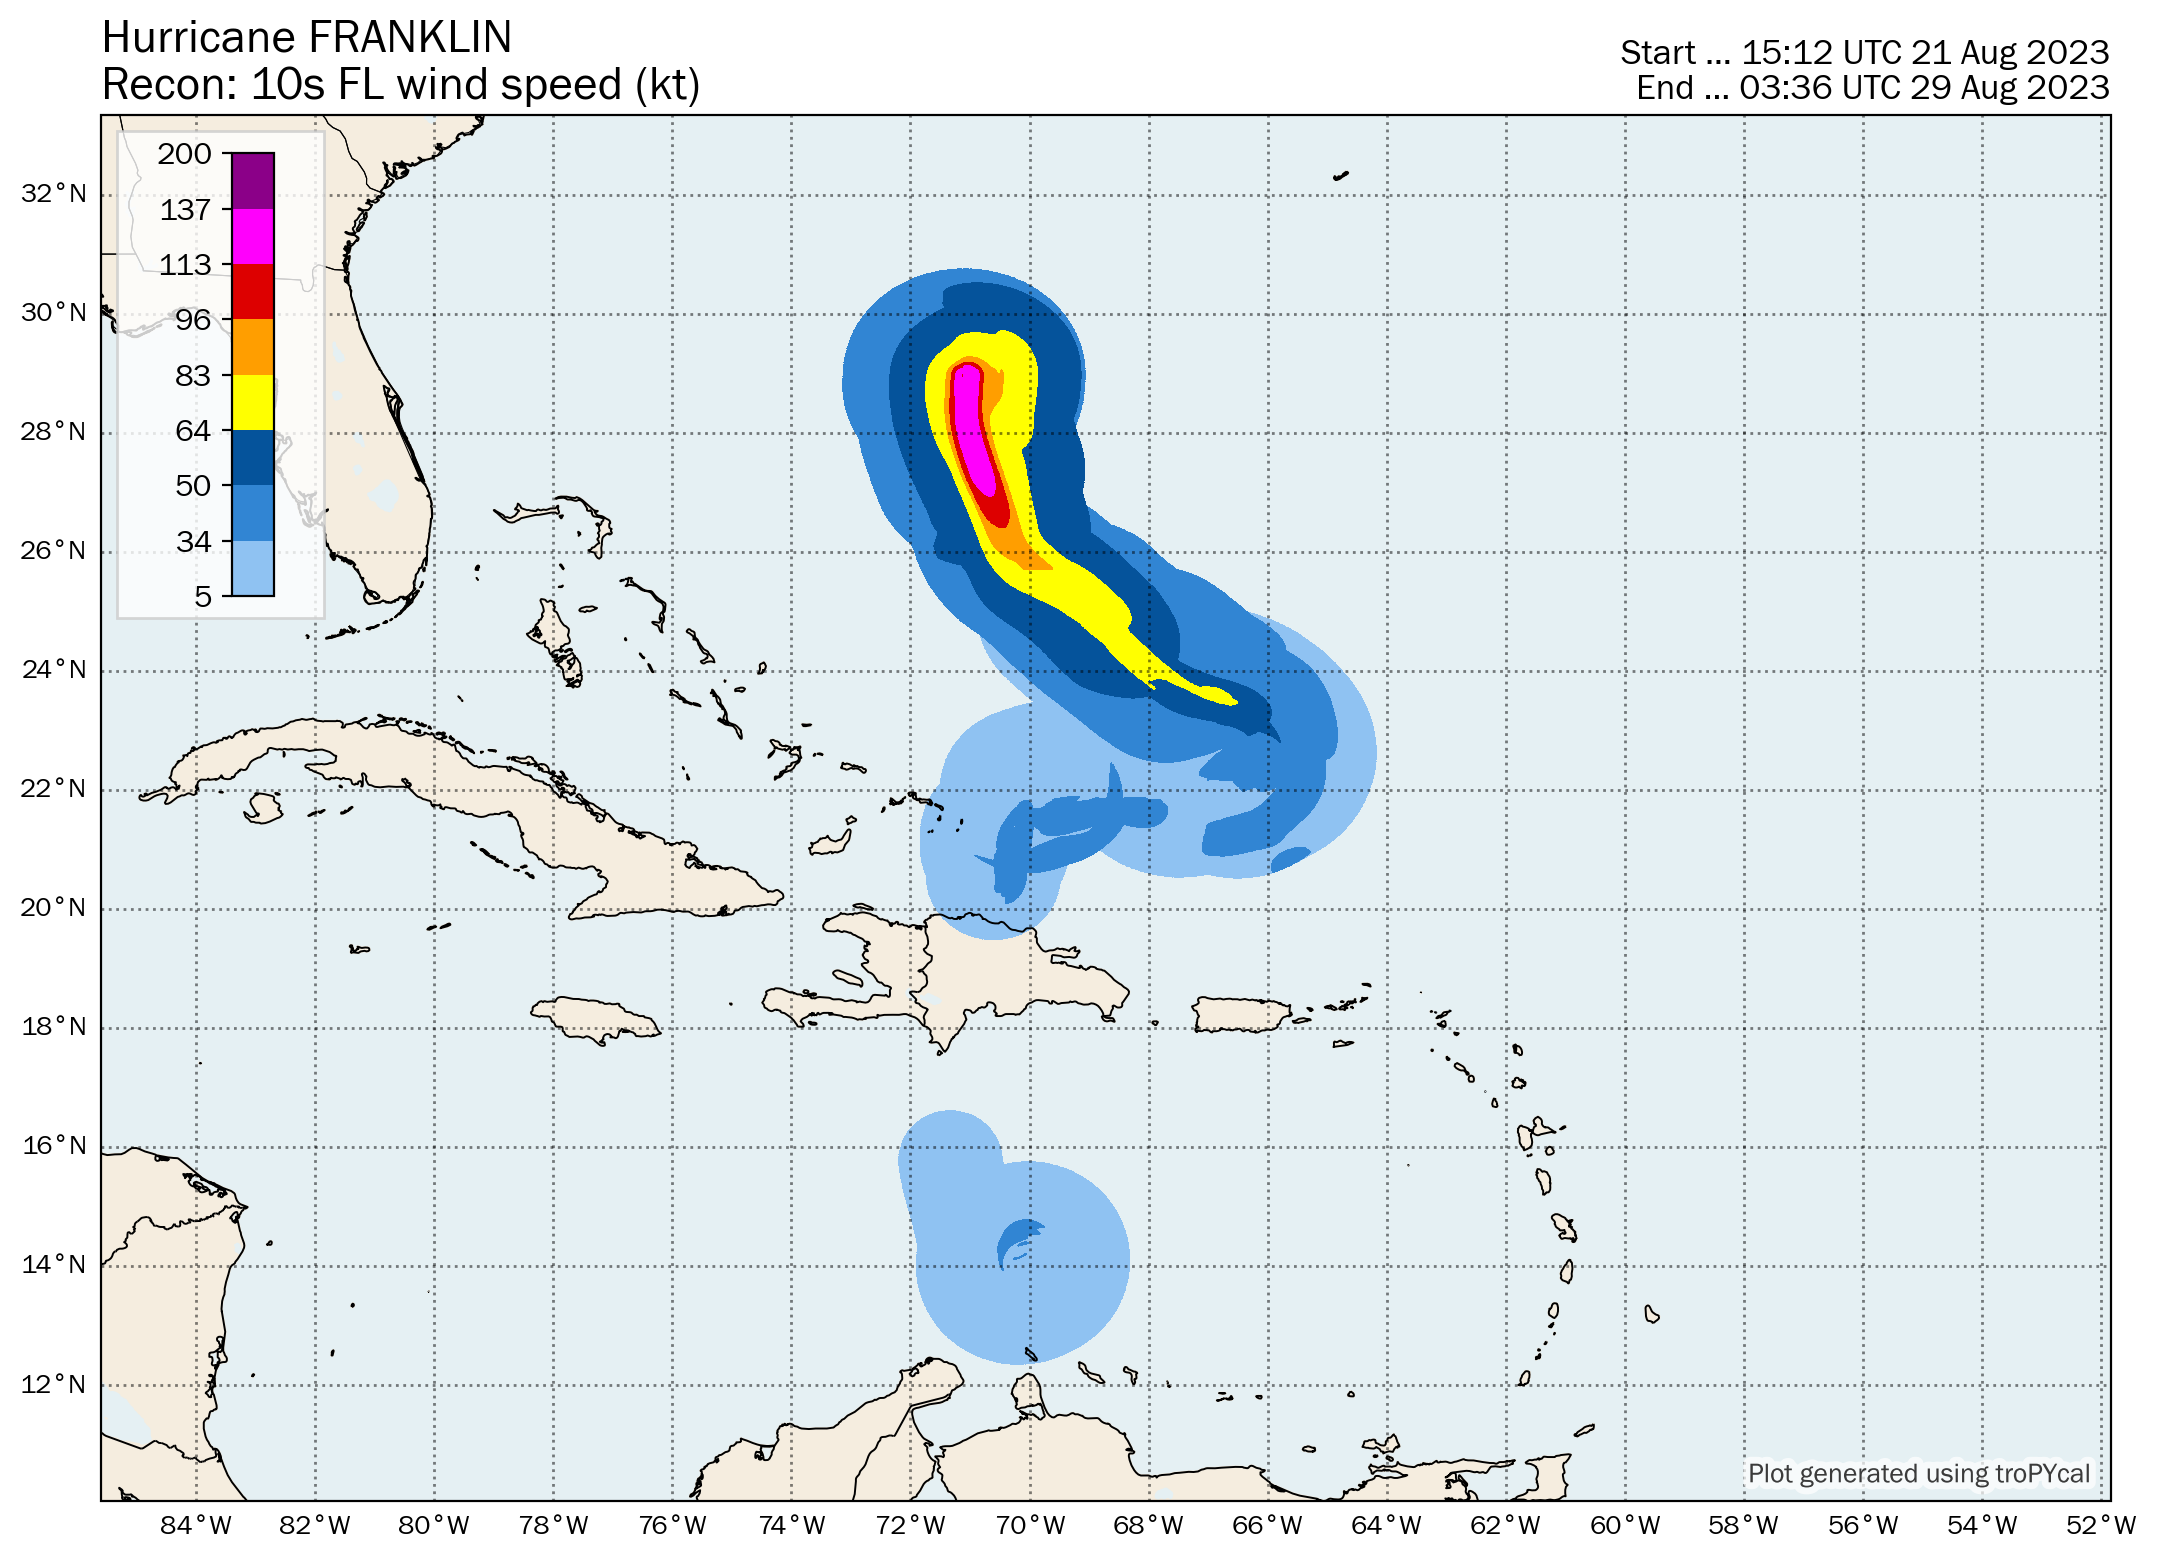
| 4 | Hurricane Franklin | 130 kt | 926 hPa | 06z 08/20 | 12z 09/01 | 26.4 |
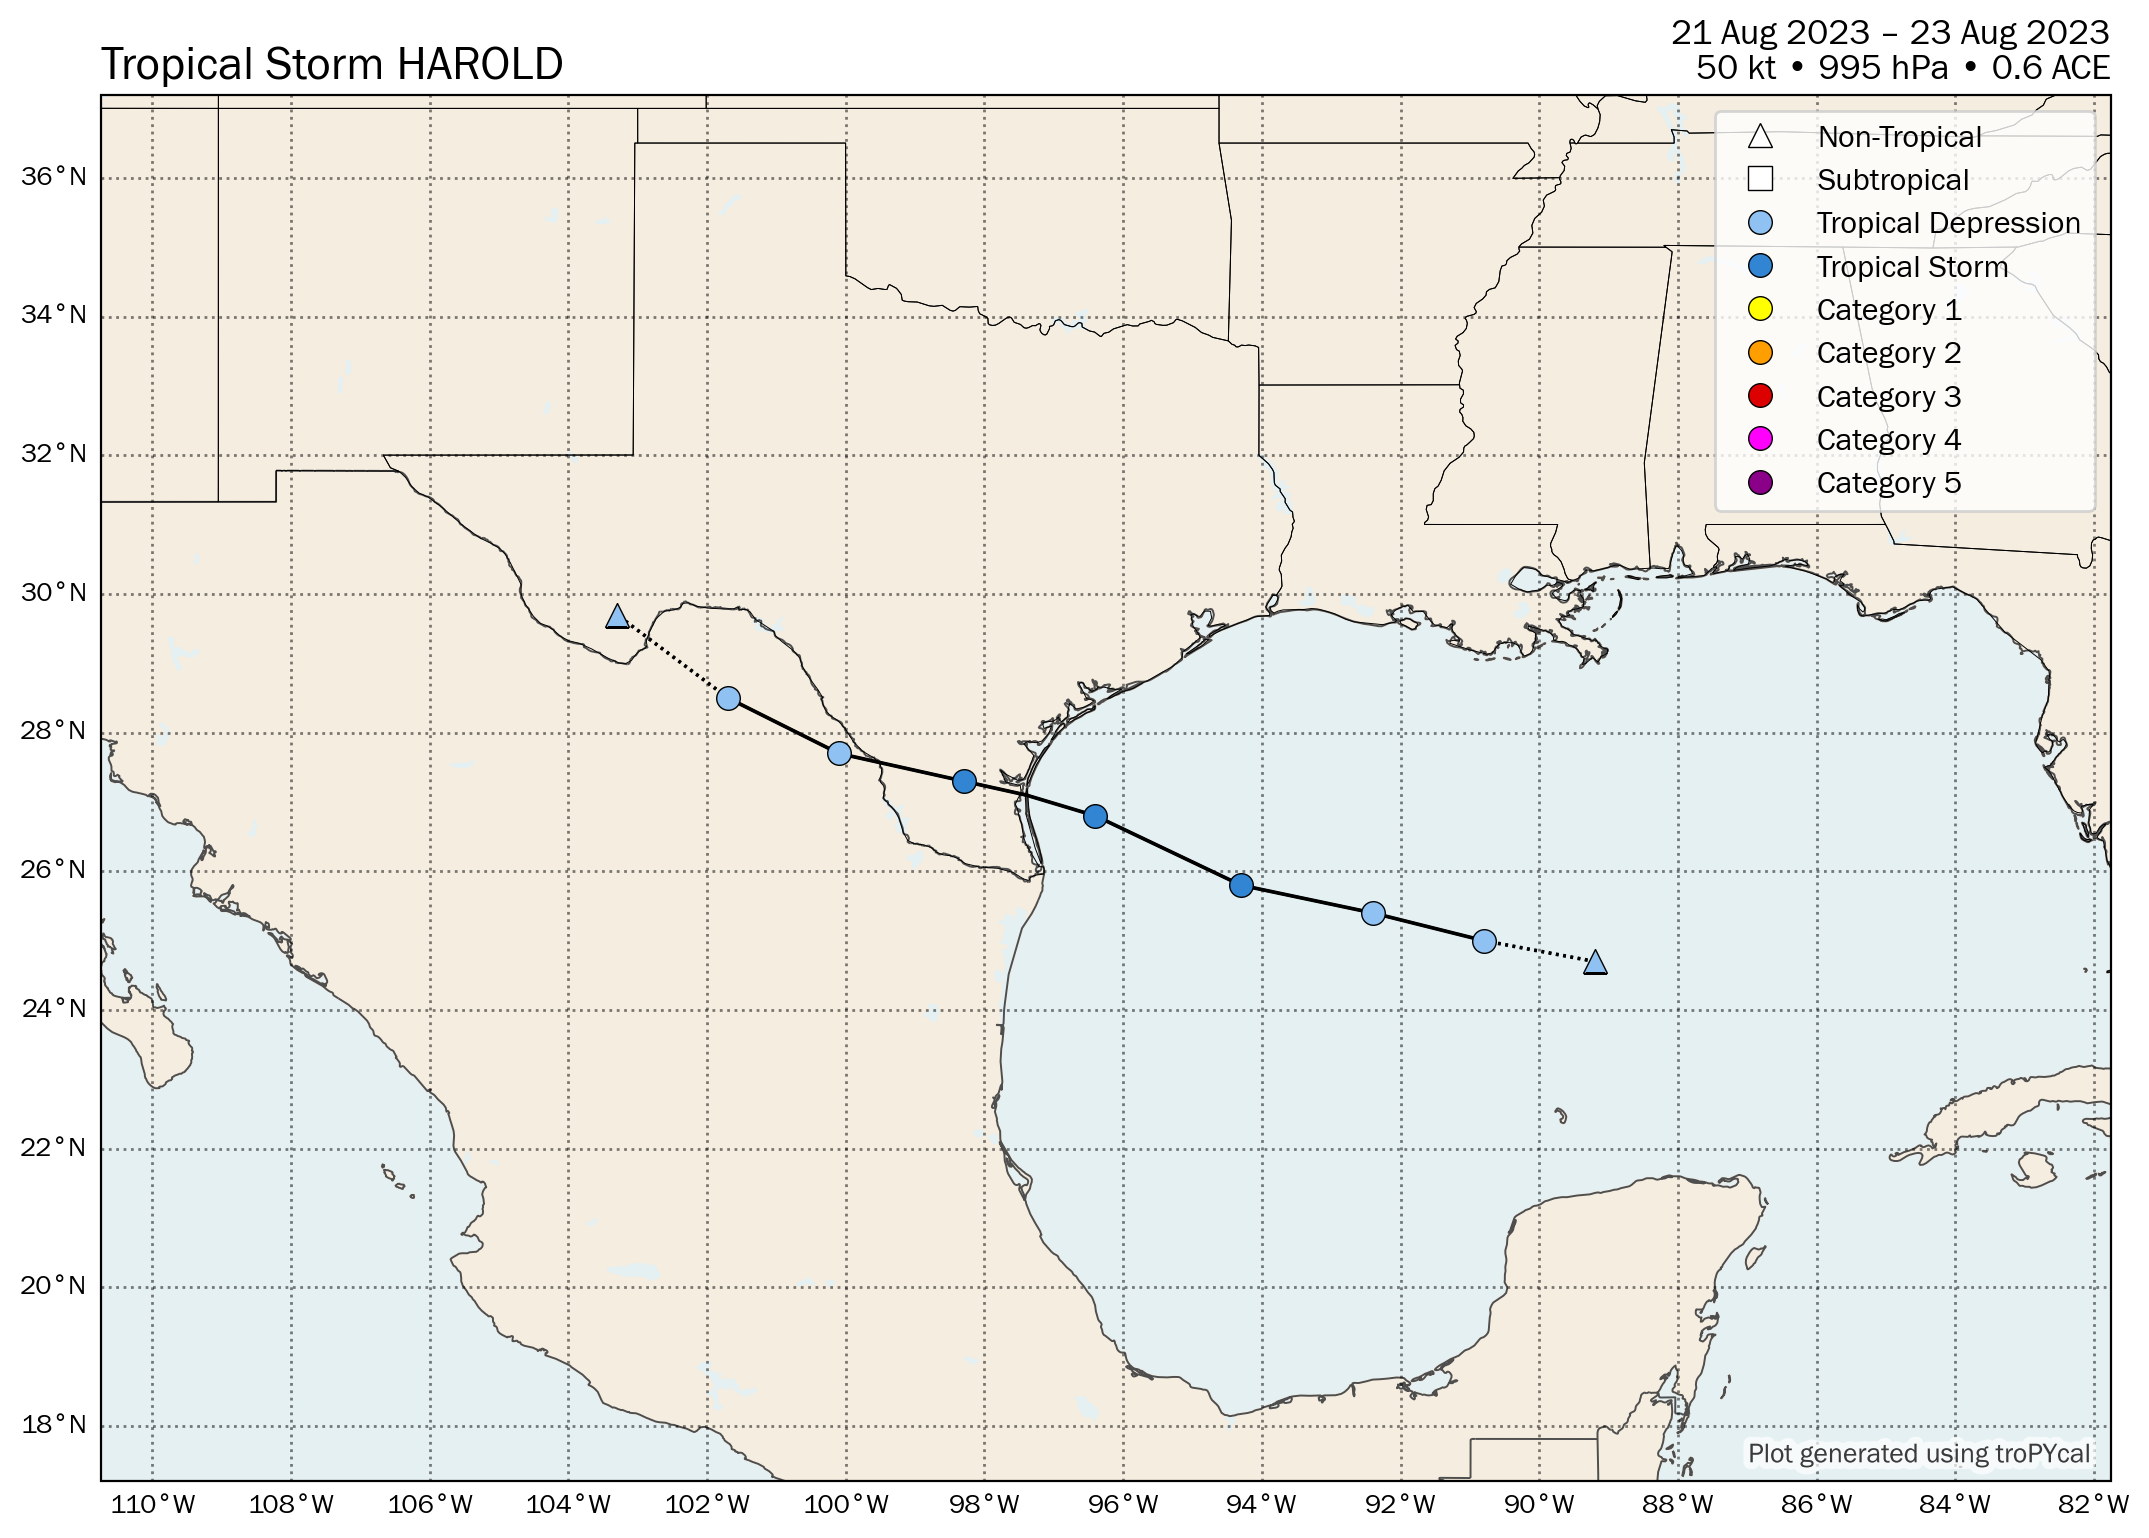
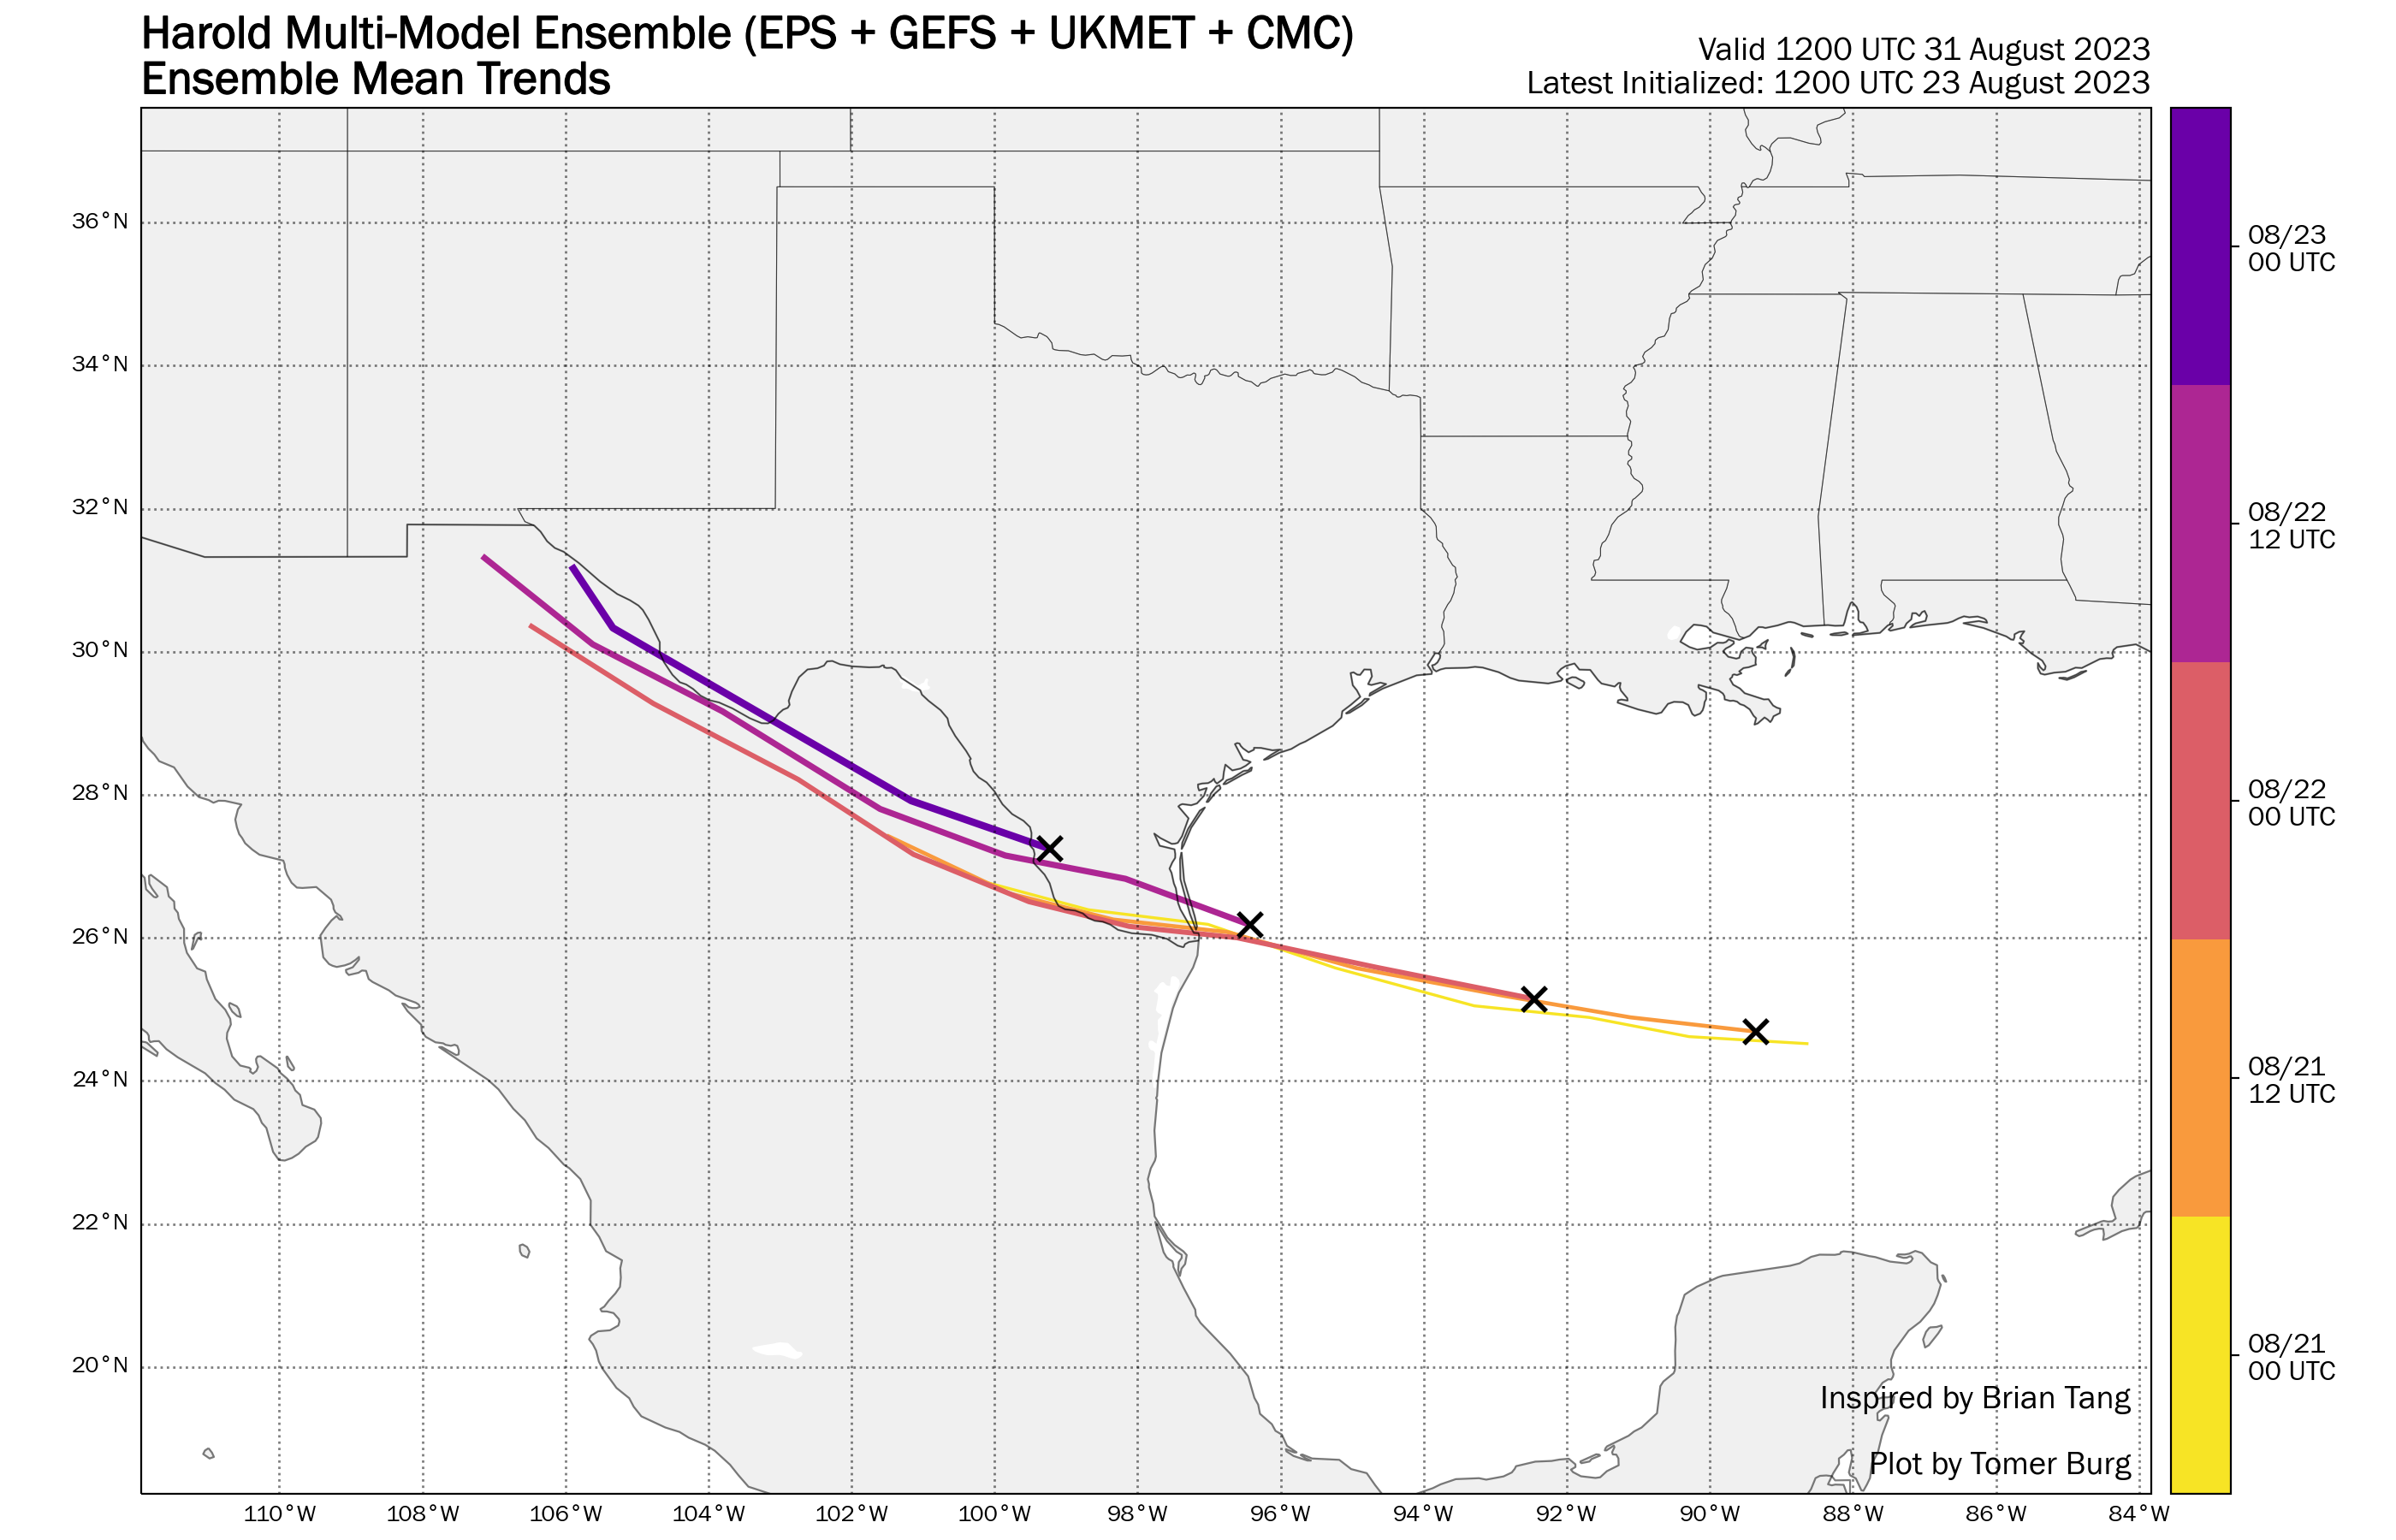
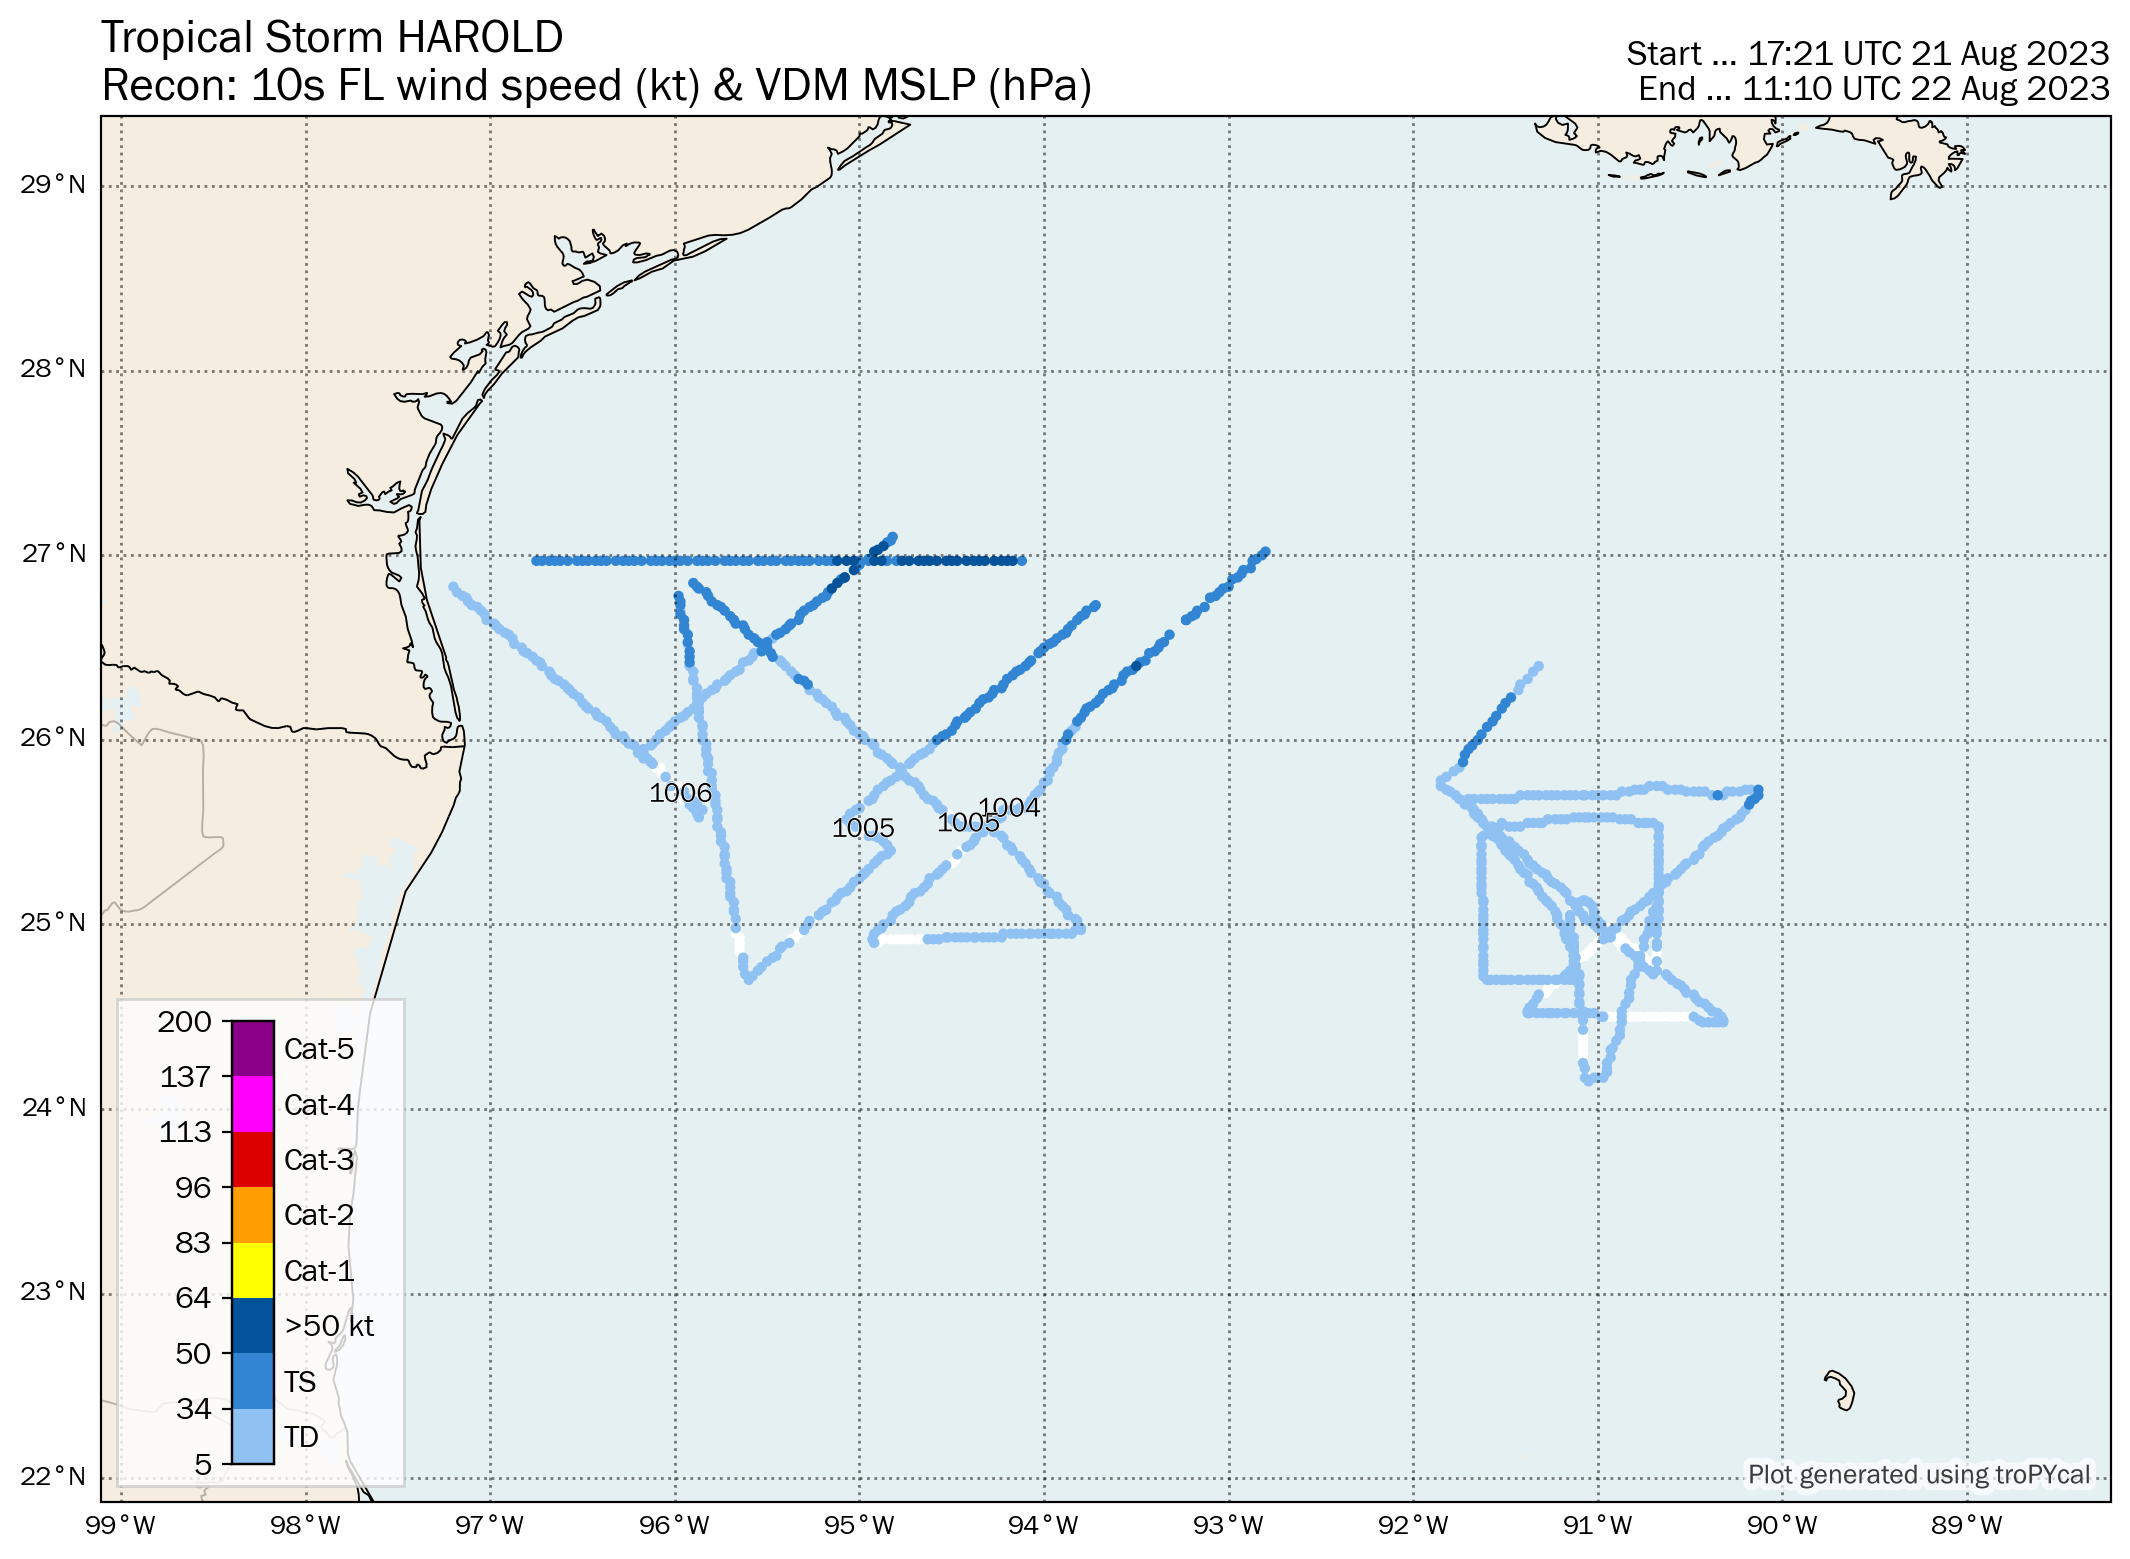
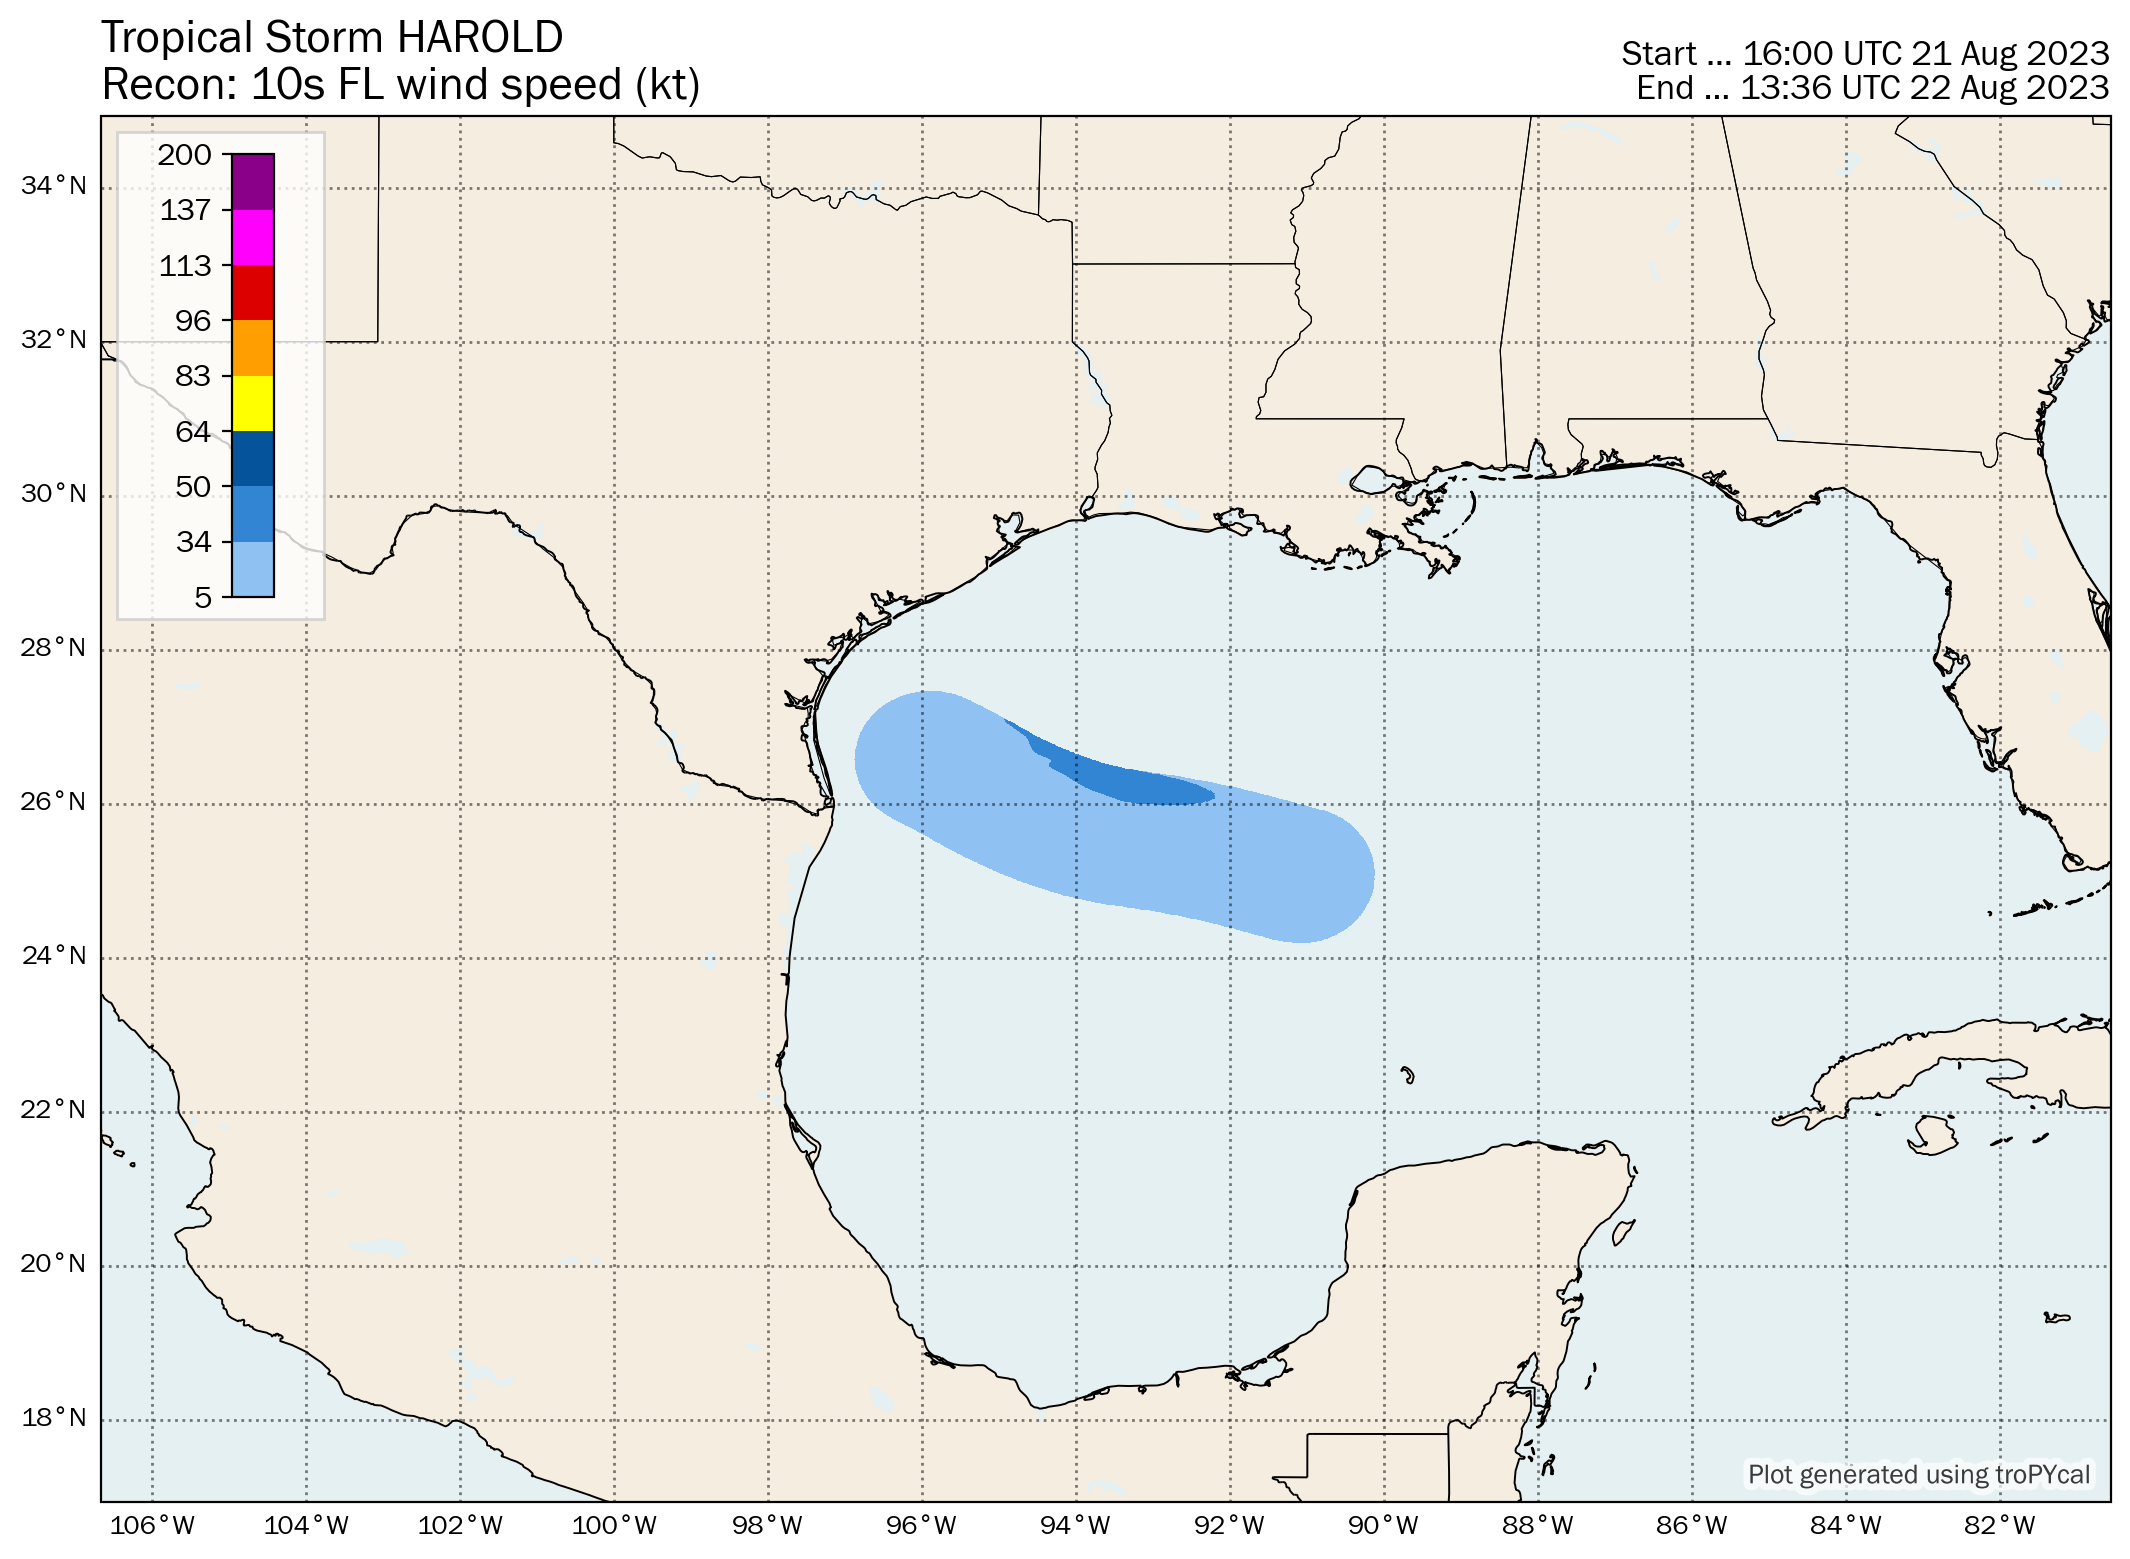
| S | Tropical Storm Harold | 50 kt | 995 hPa | 18z 08/21 | 06z 08/23 | 0.6 |
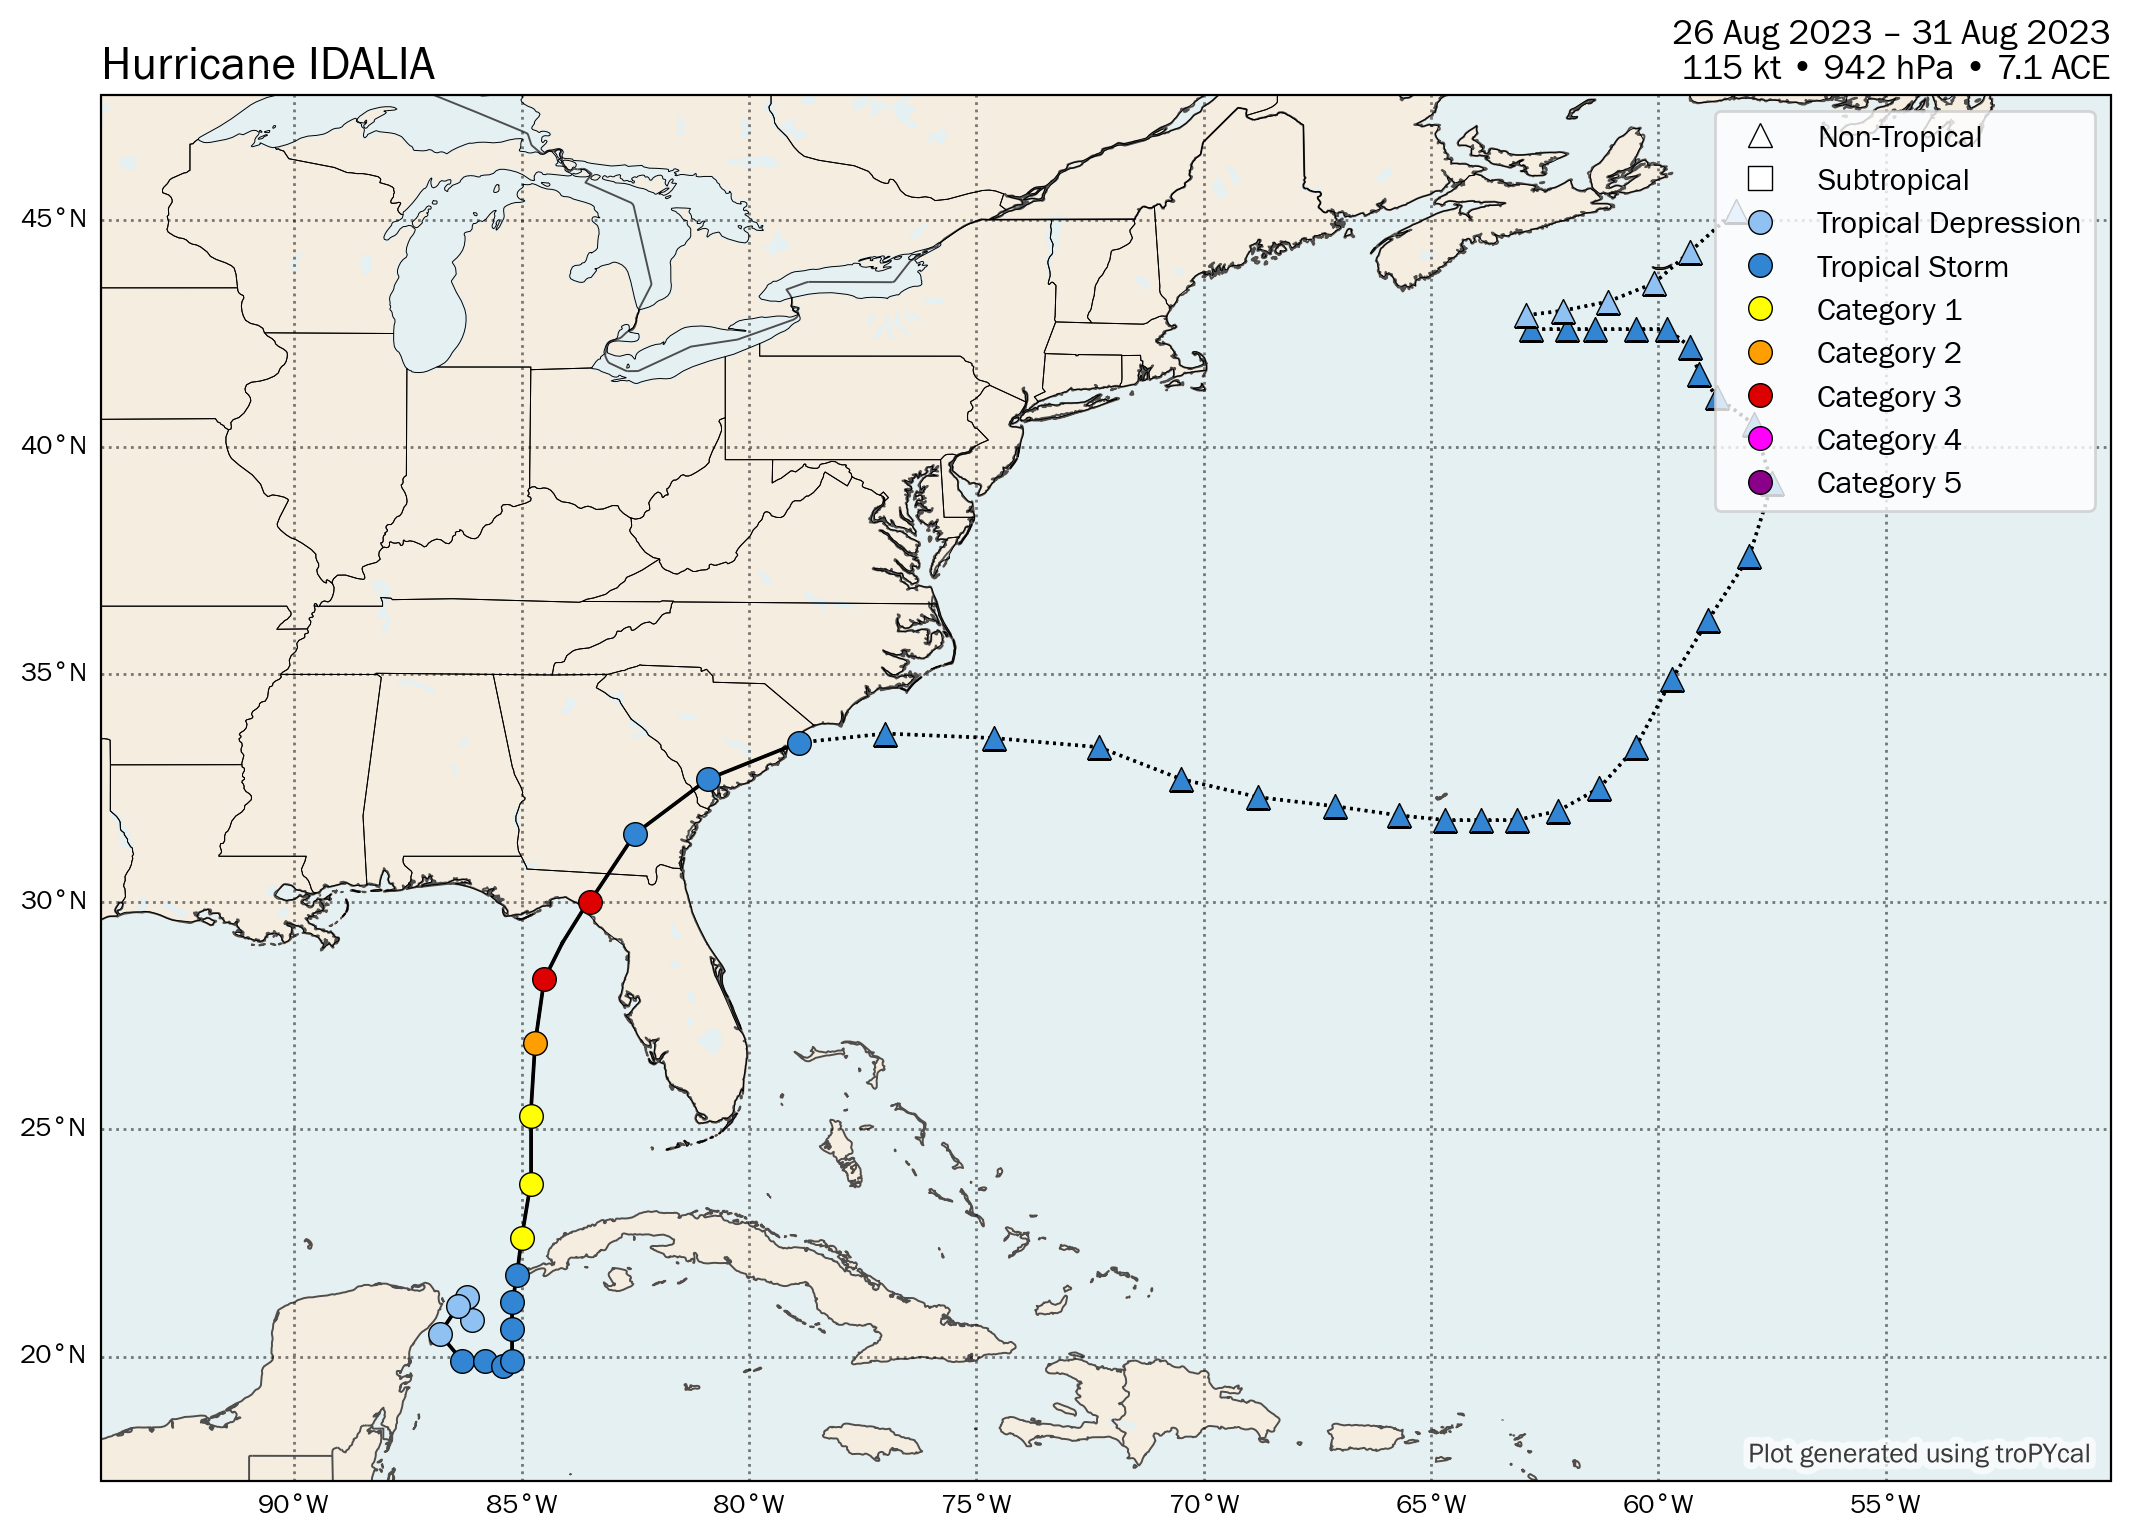
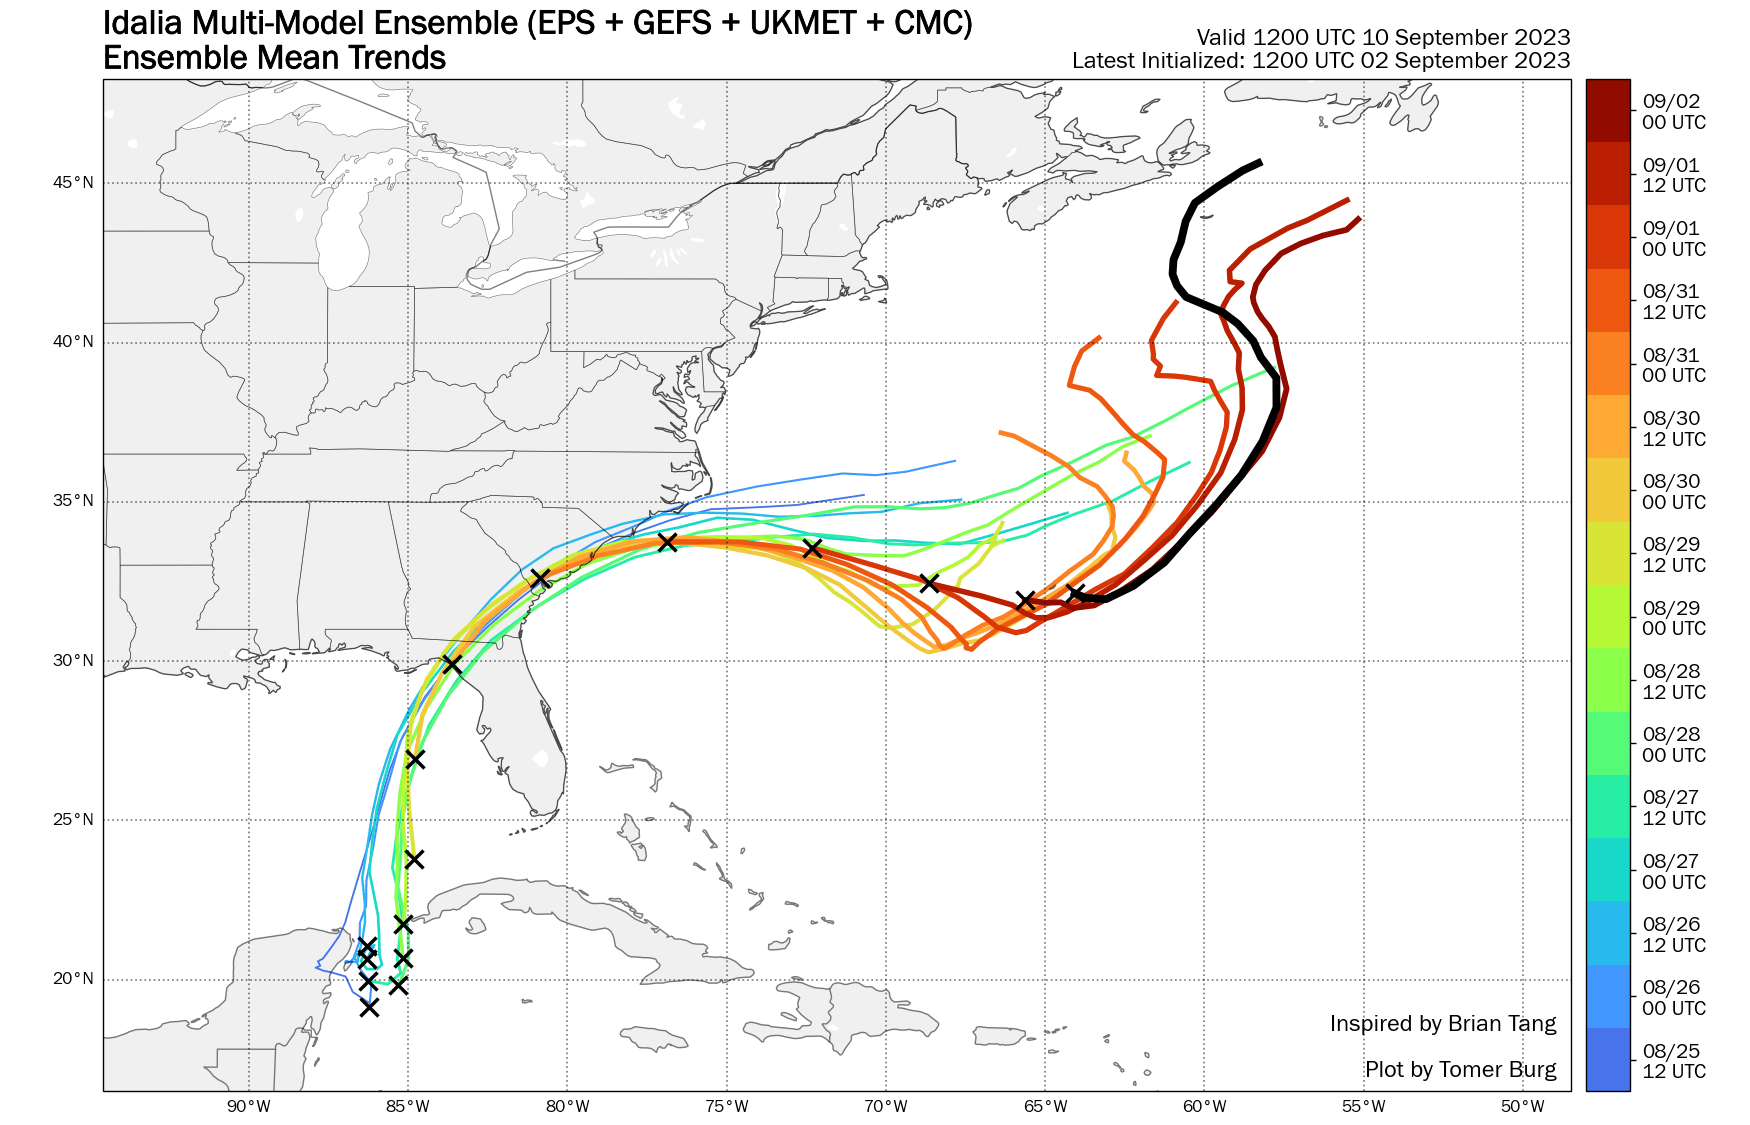
| 4 | Hurricane Idalia | 115 kt | 942 hPa | 12z 08/26 | 06z 08/31 | 7.1 |
| S | Tropical Storm Jose | 55 kt | 996 hPa | 00z 08/29 | 18z 09/01 | 1.8 |
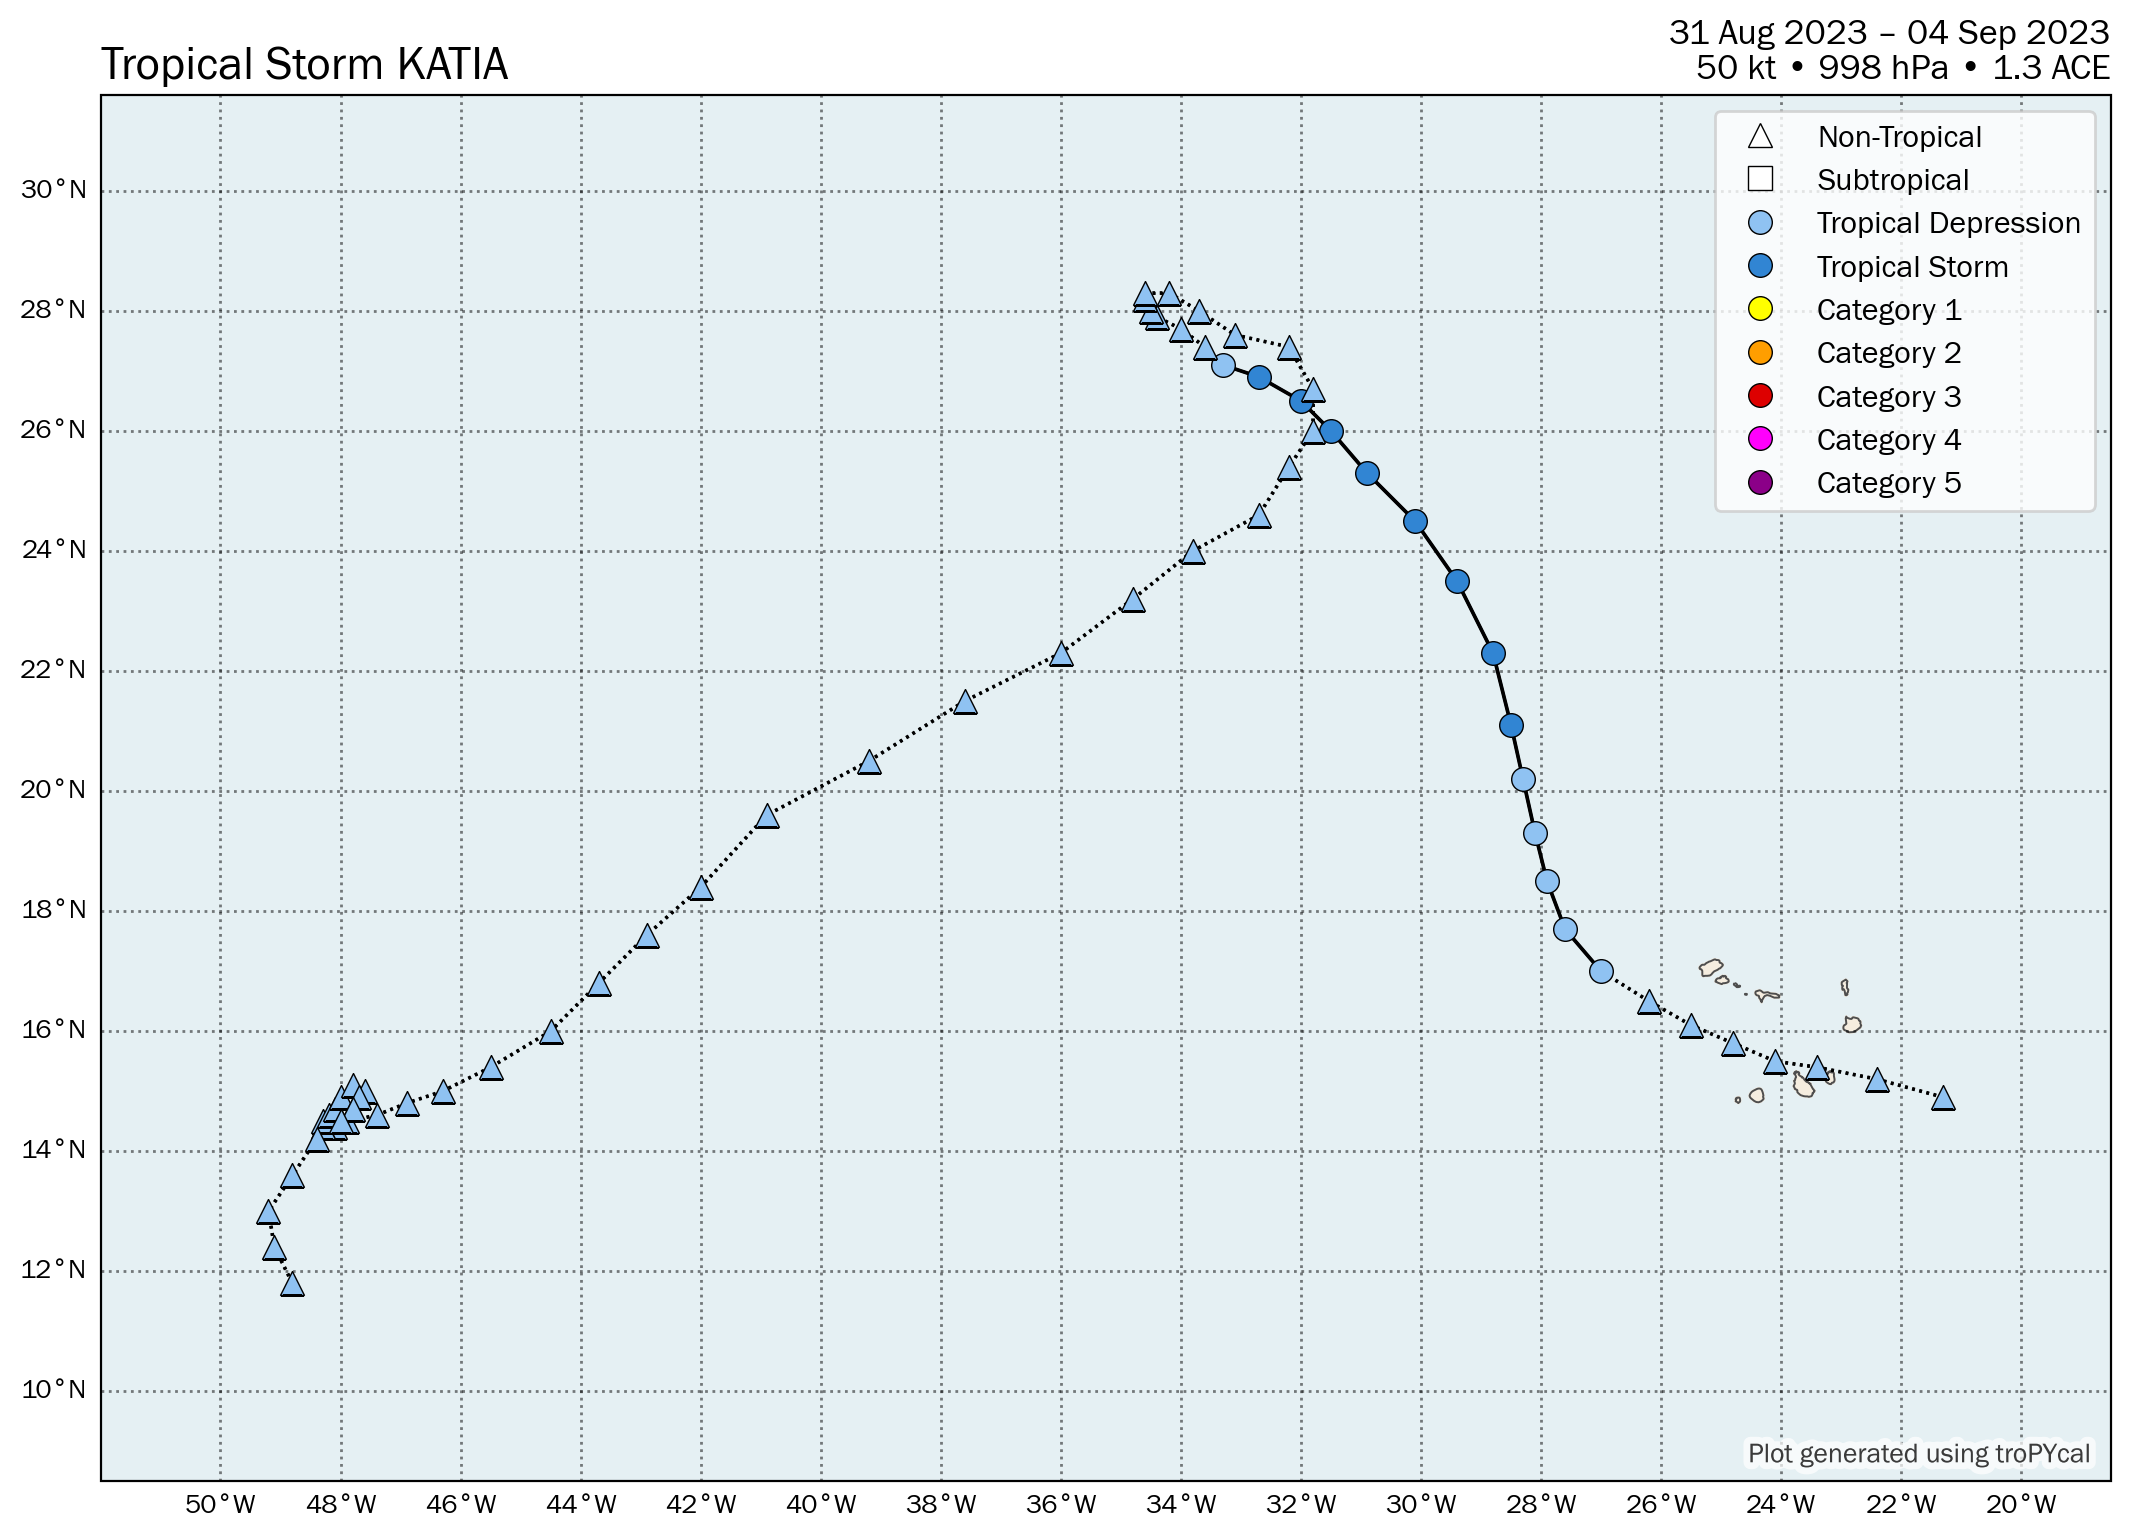
| S | Tropical Storm Katia | 50 kt | 998 hPa | 18z 08/31 | 00z 09/04 | 1.3 |
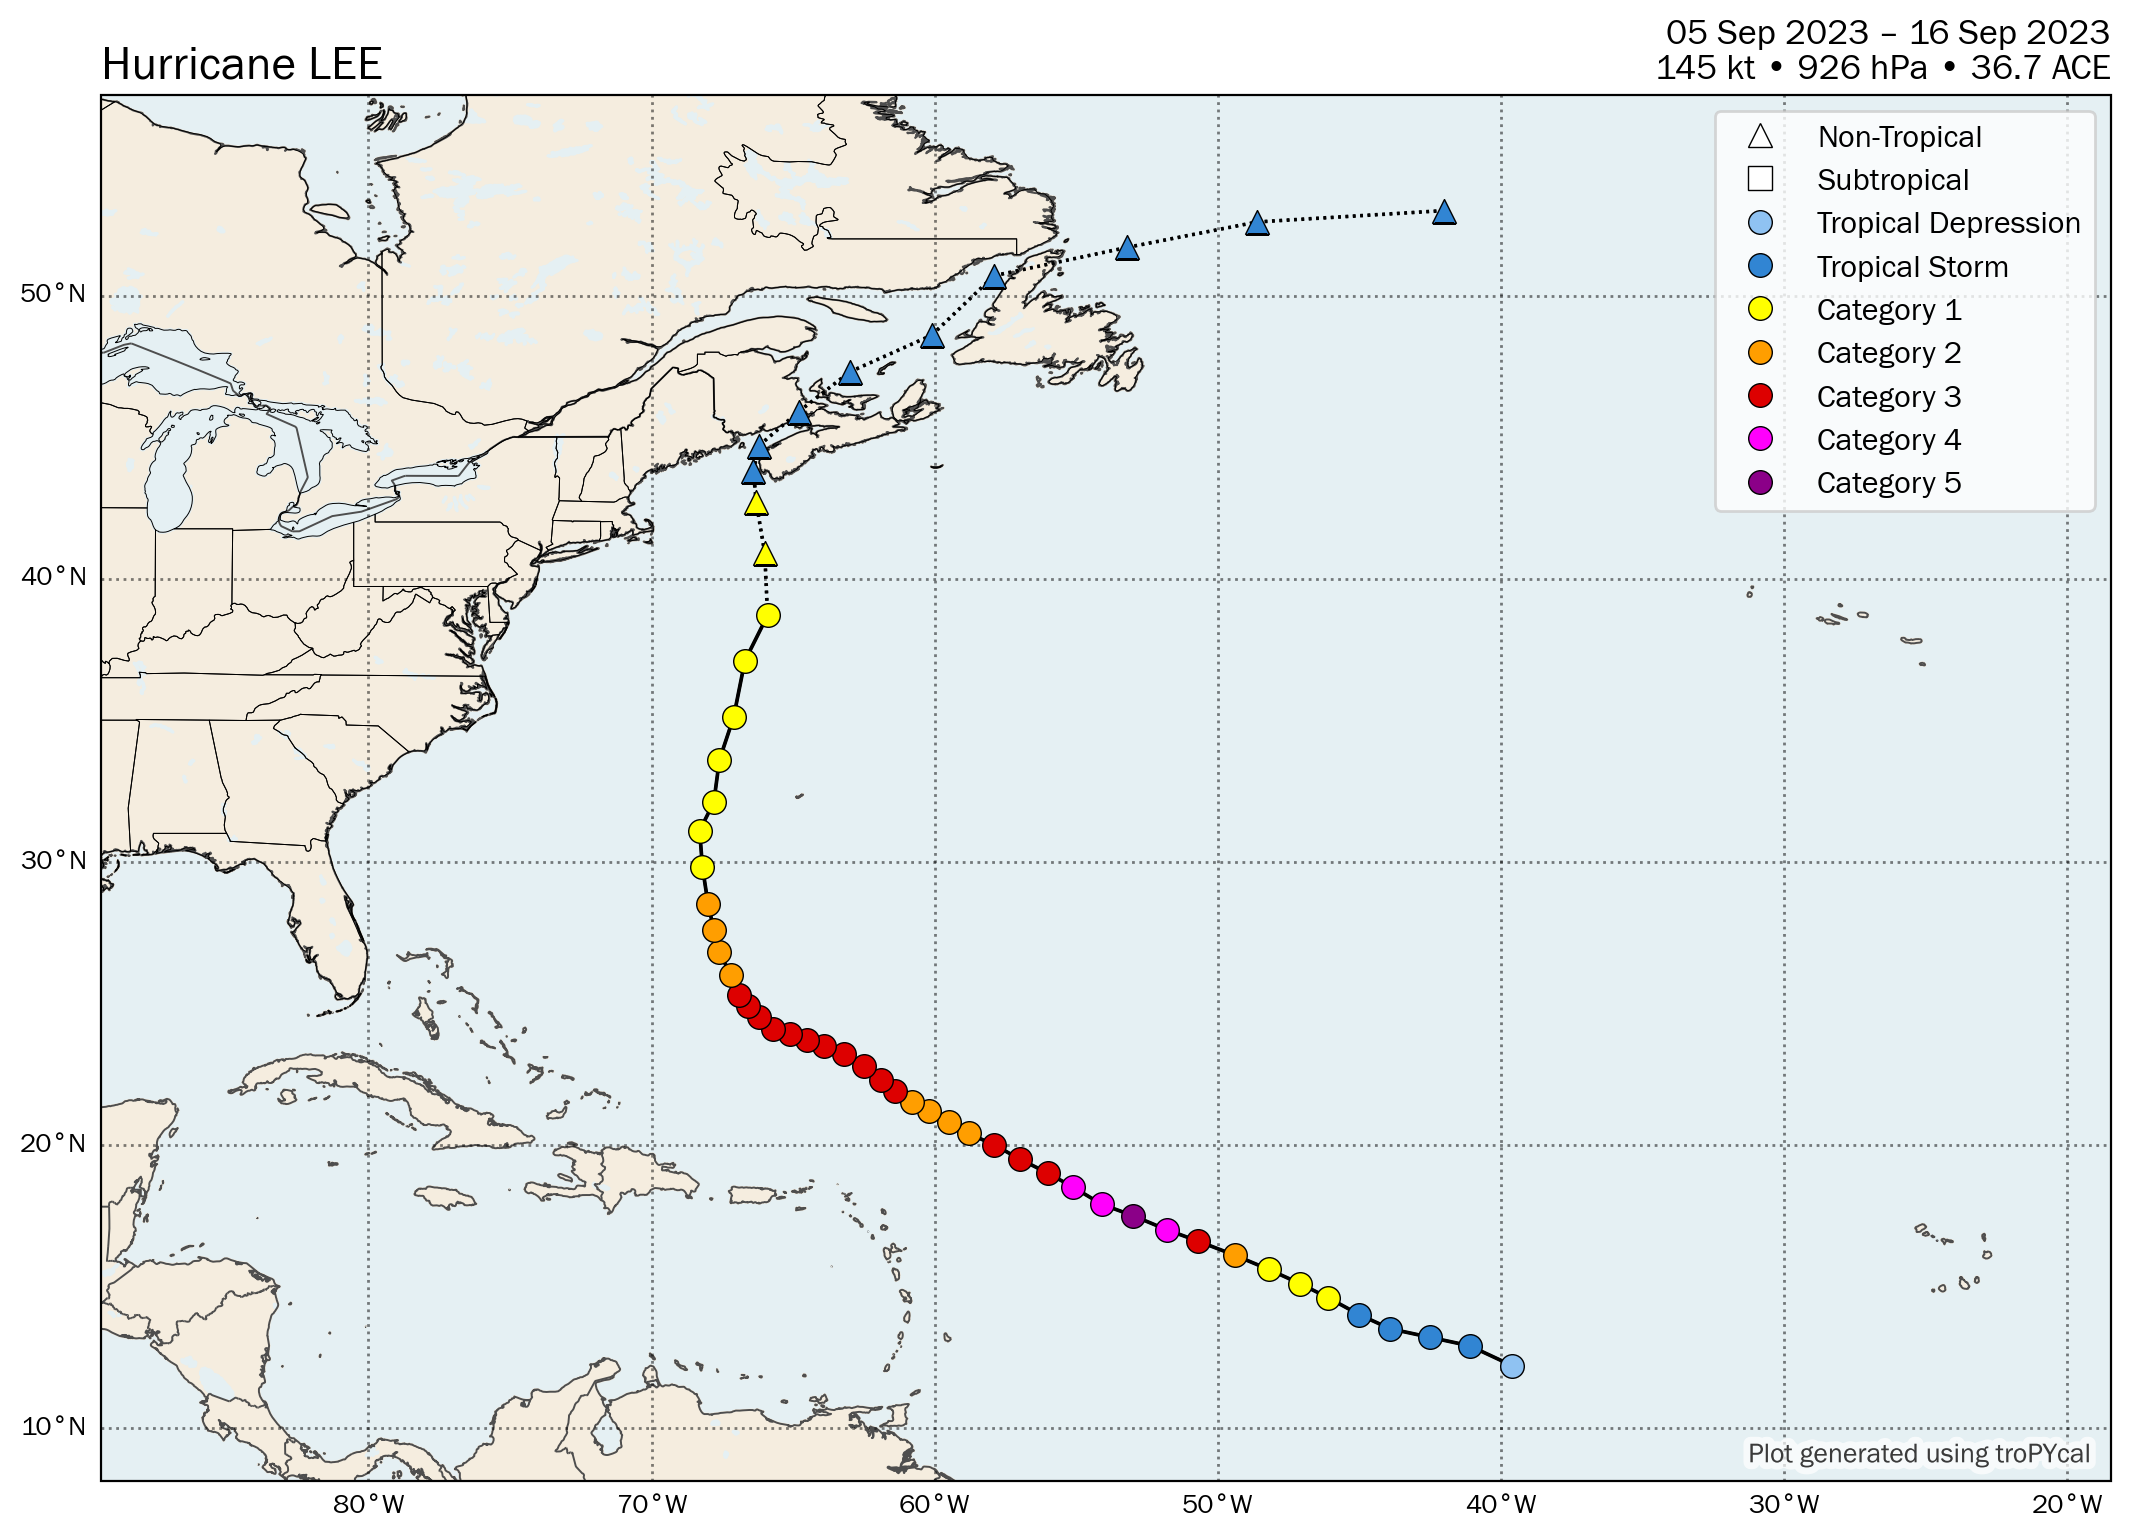
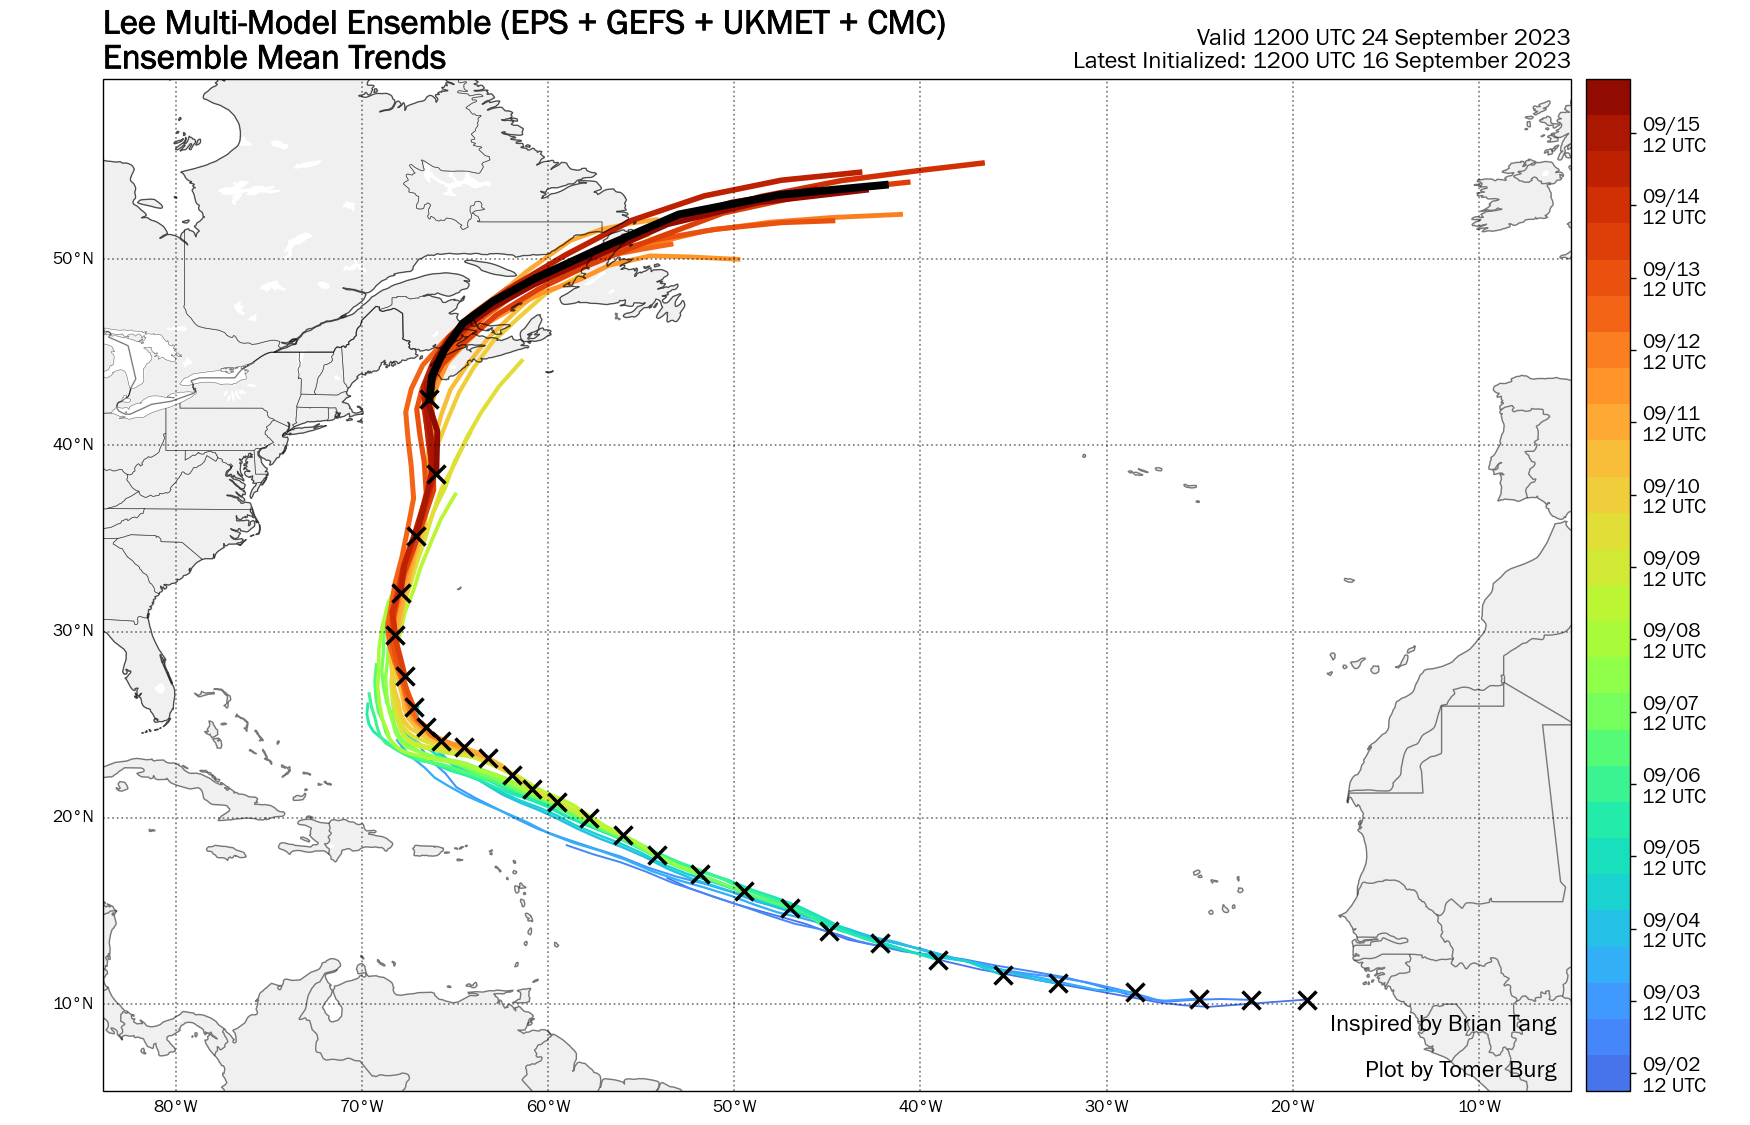
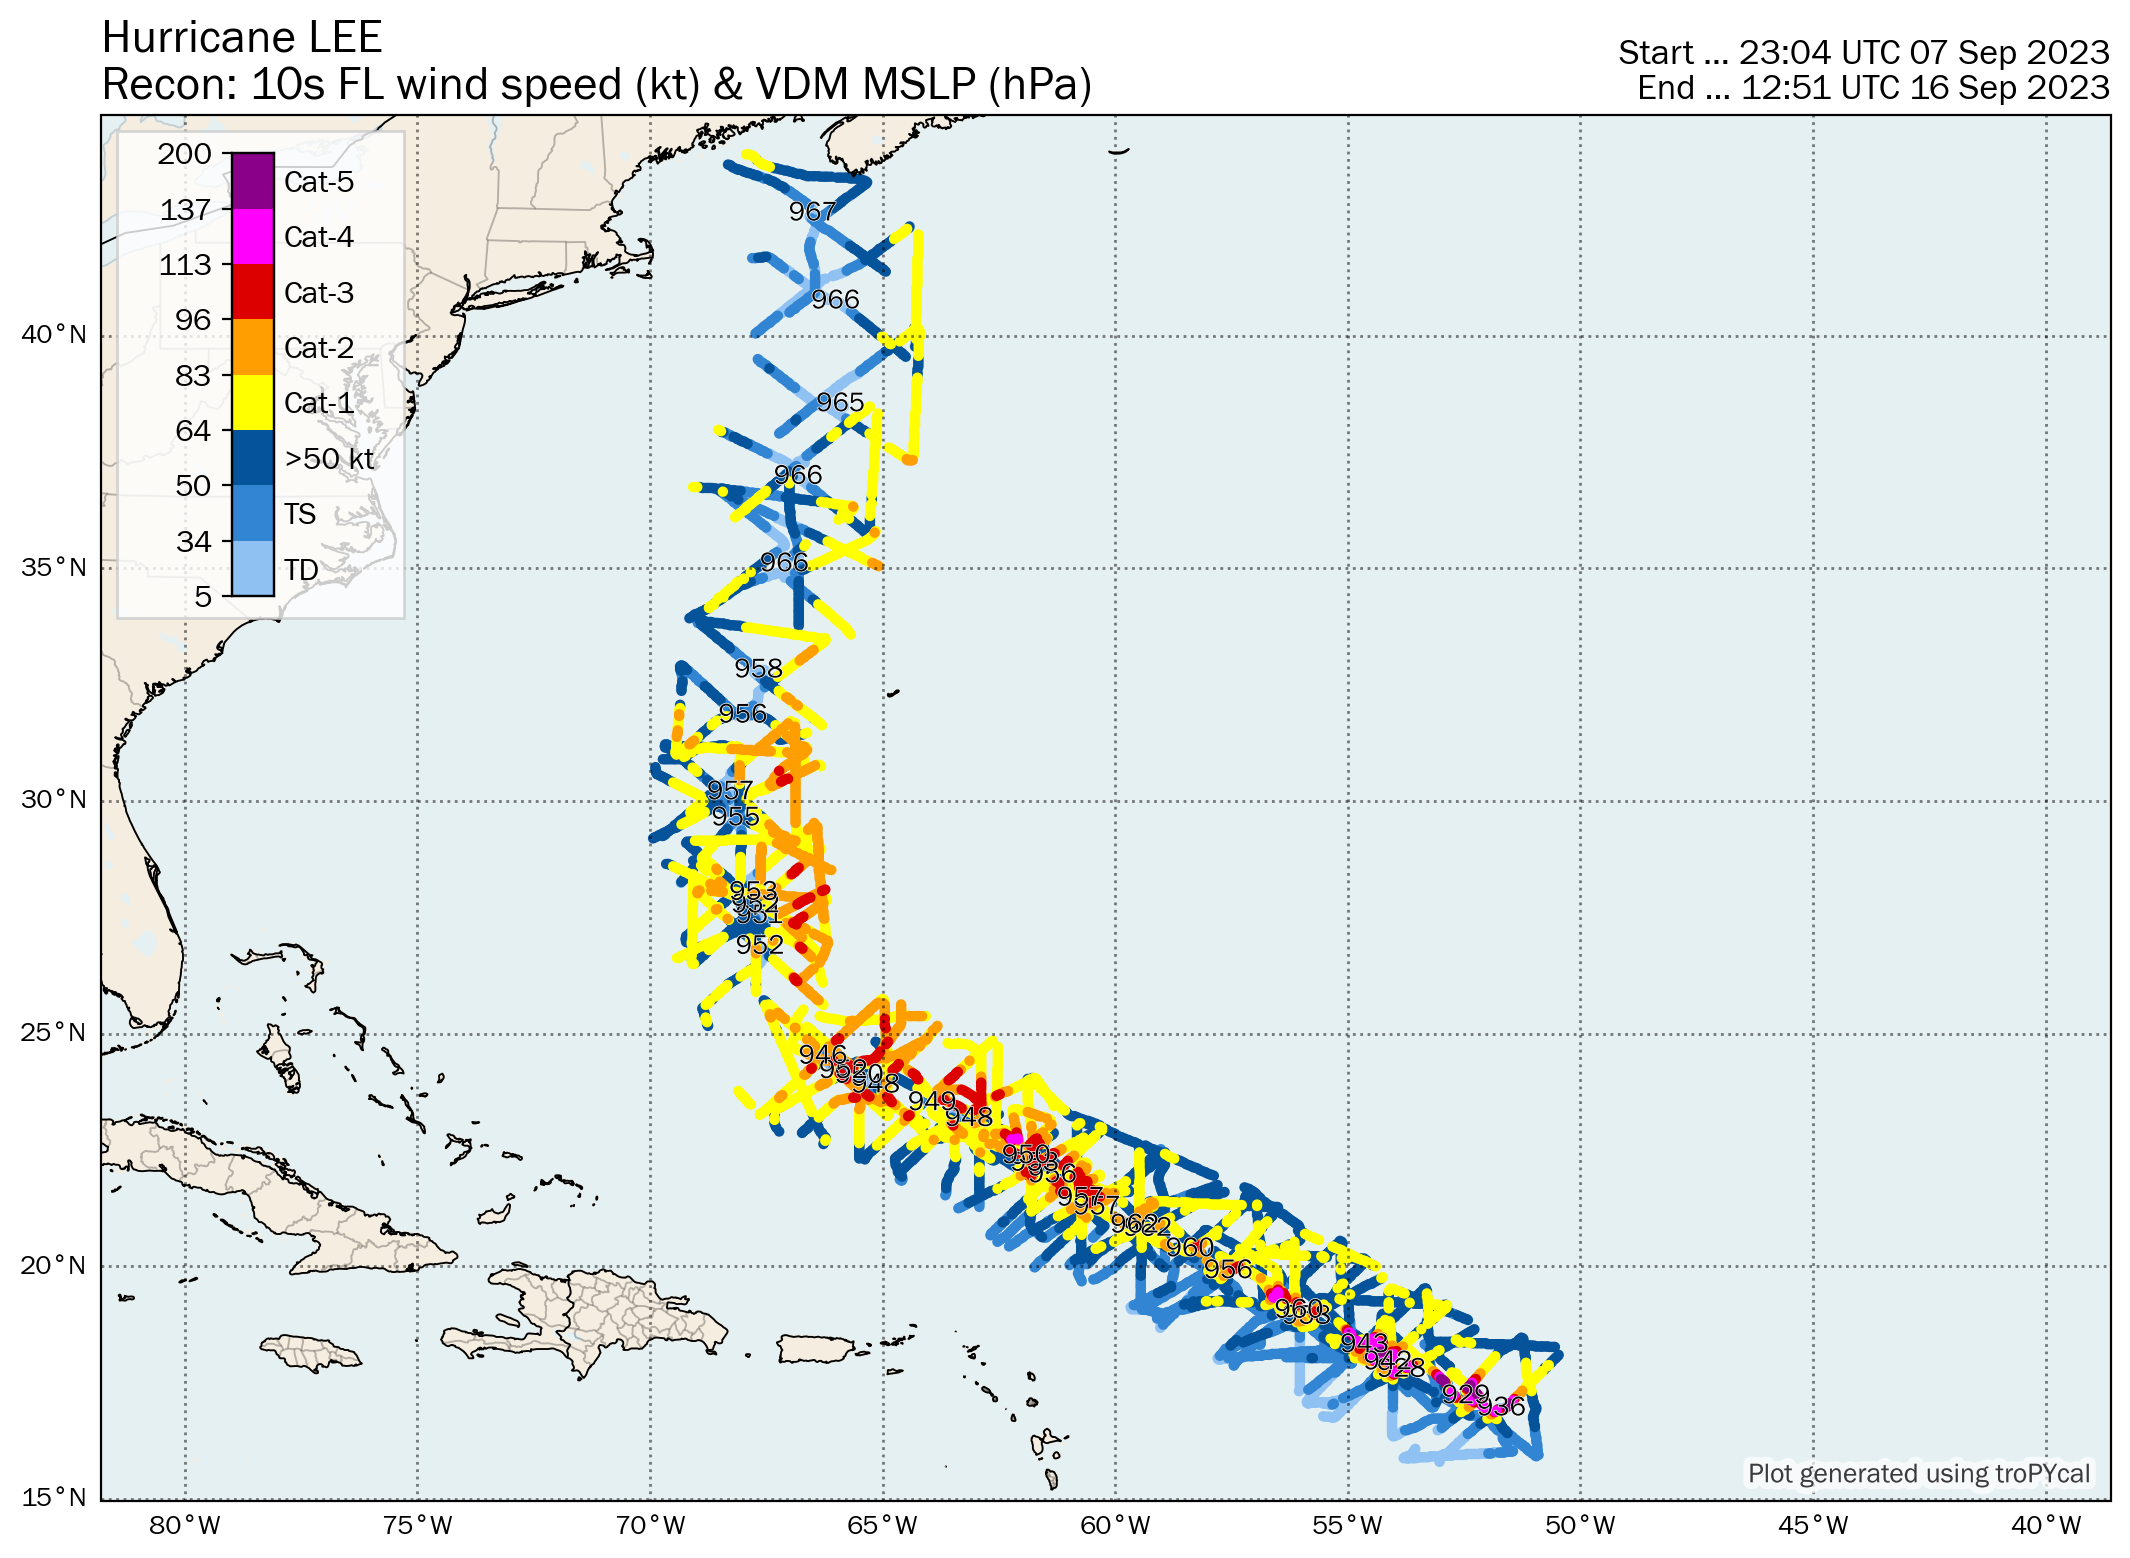
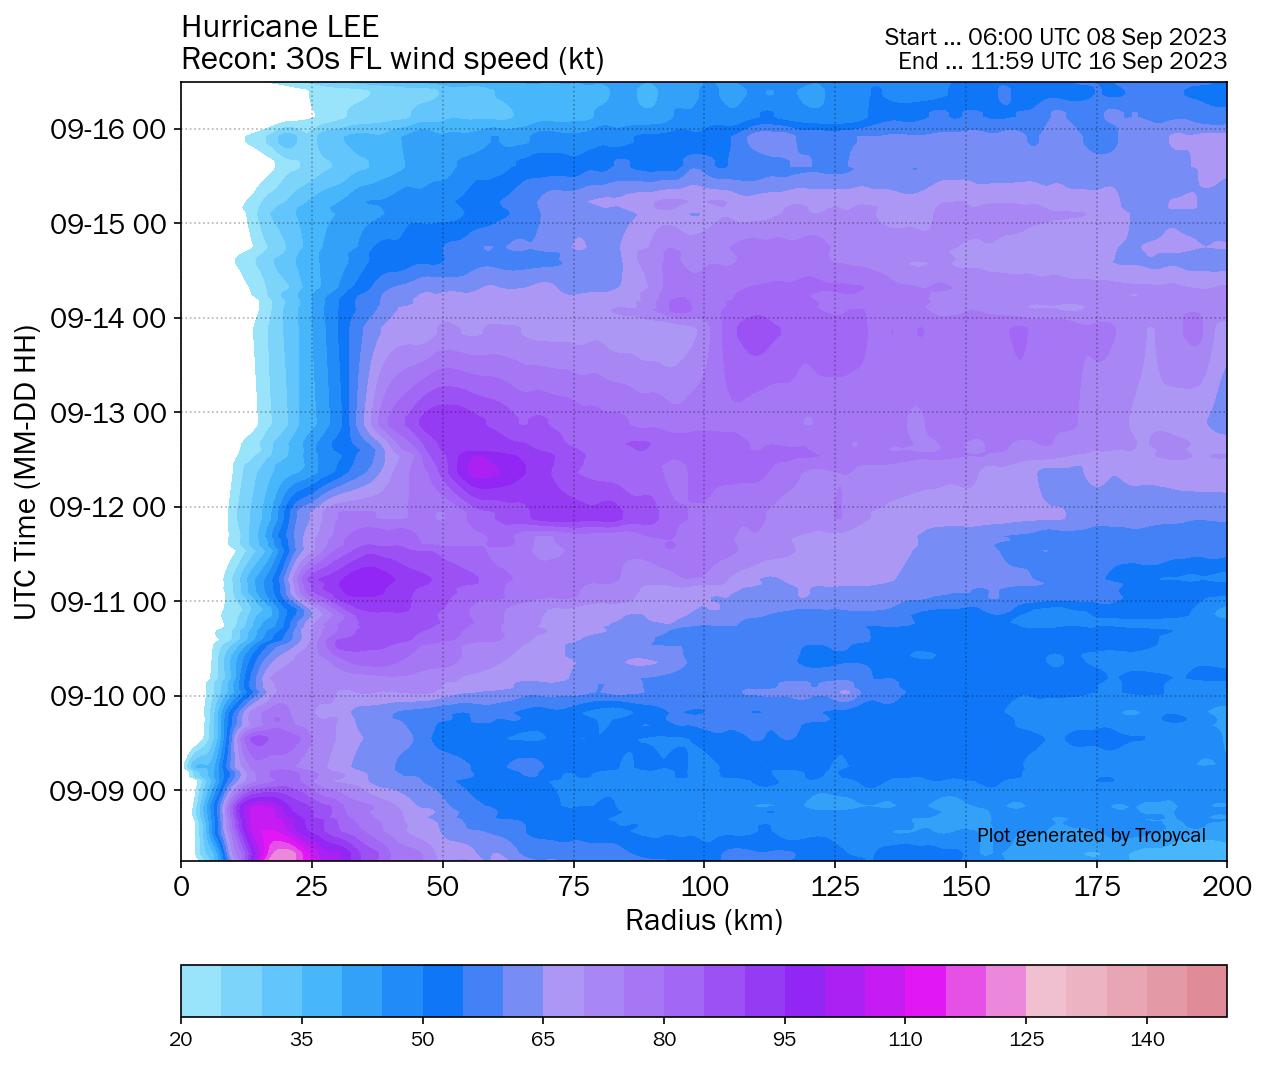
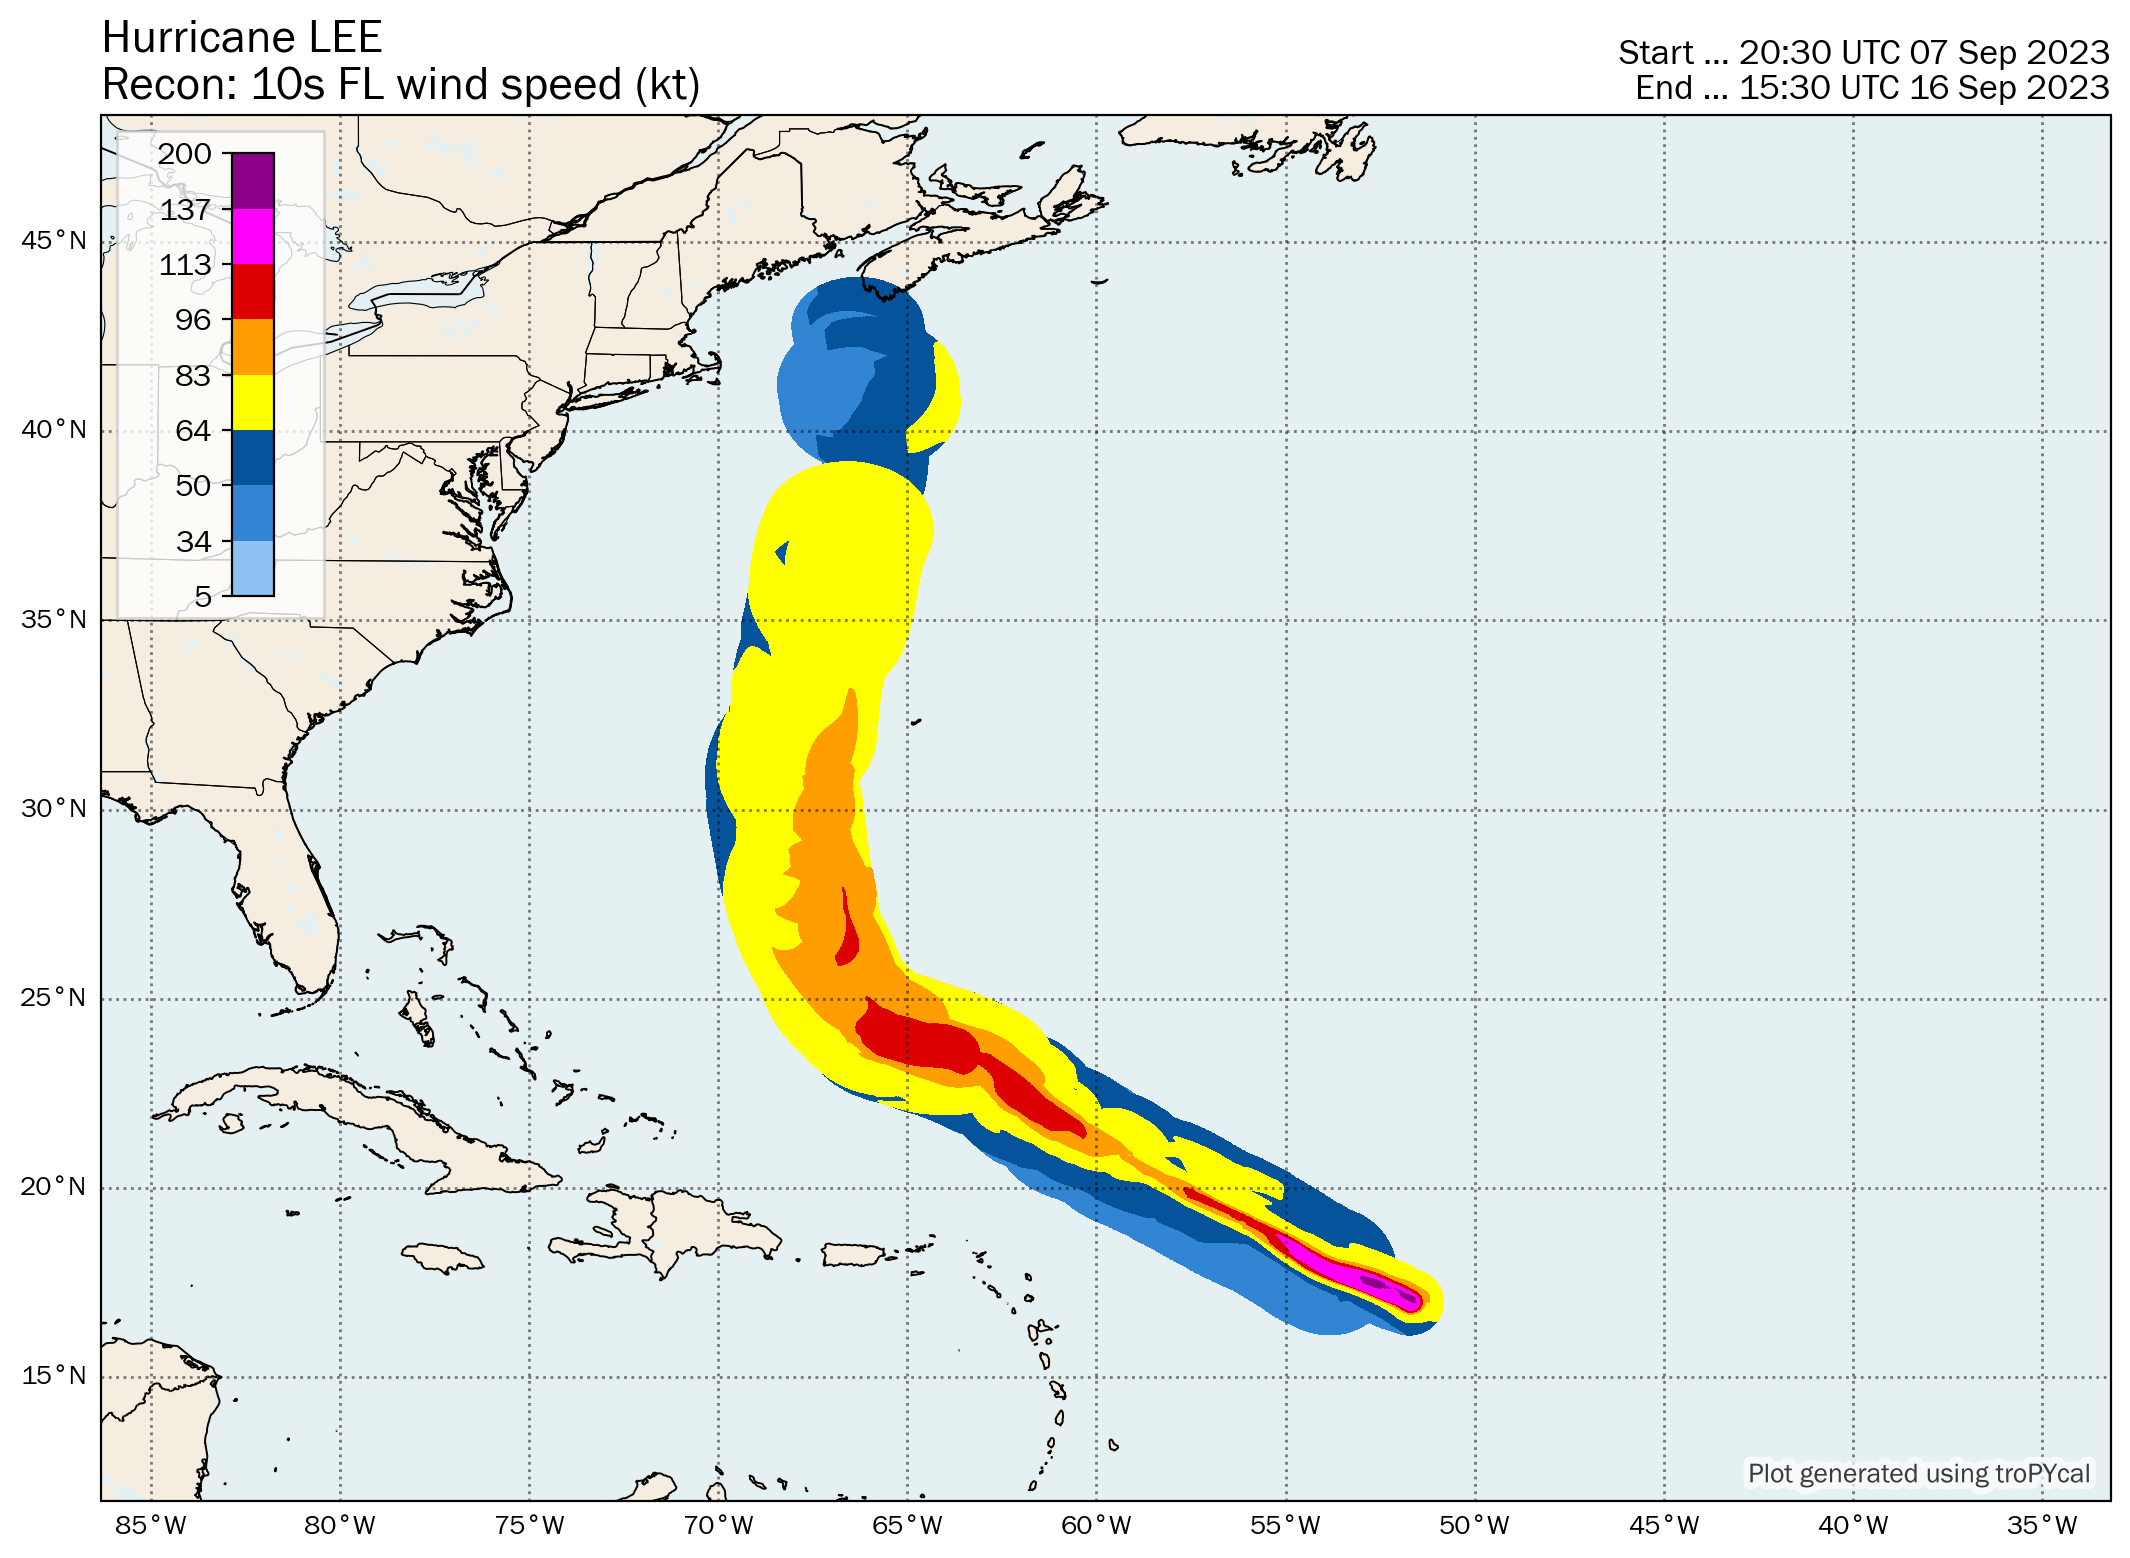
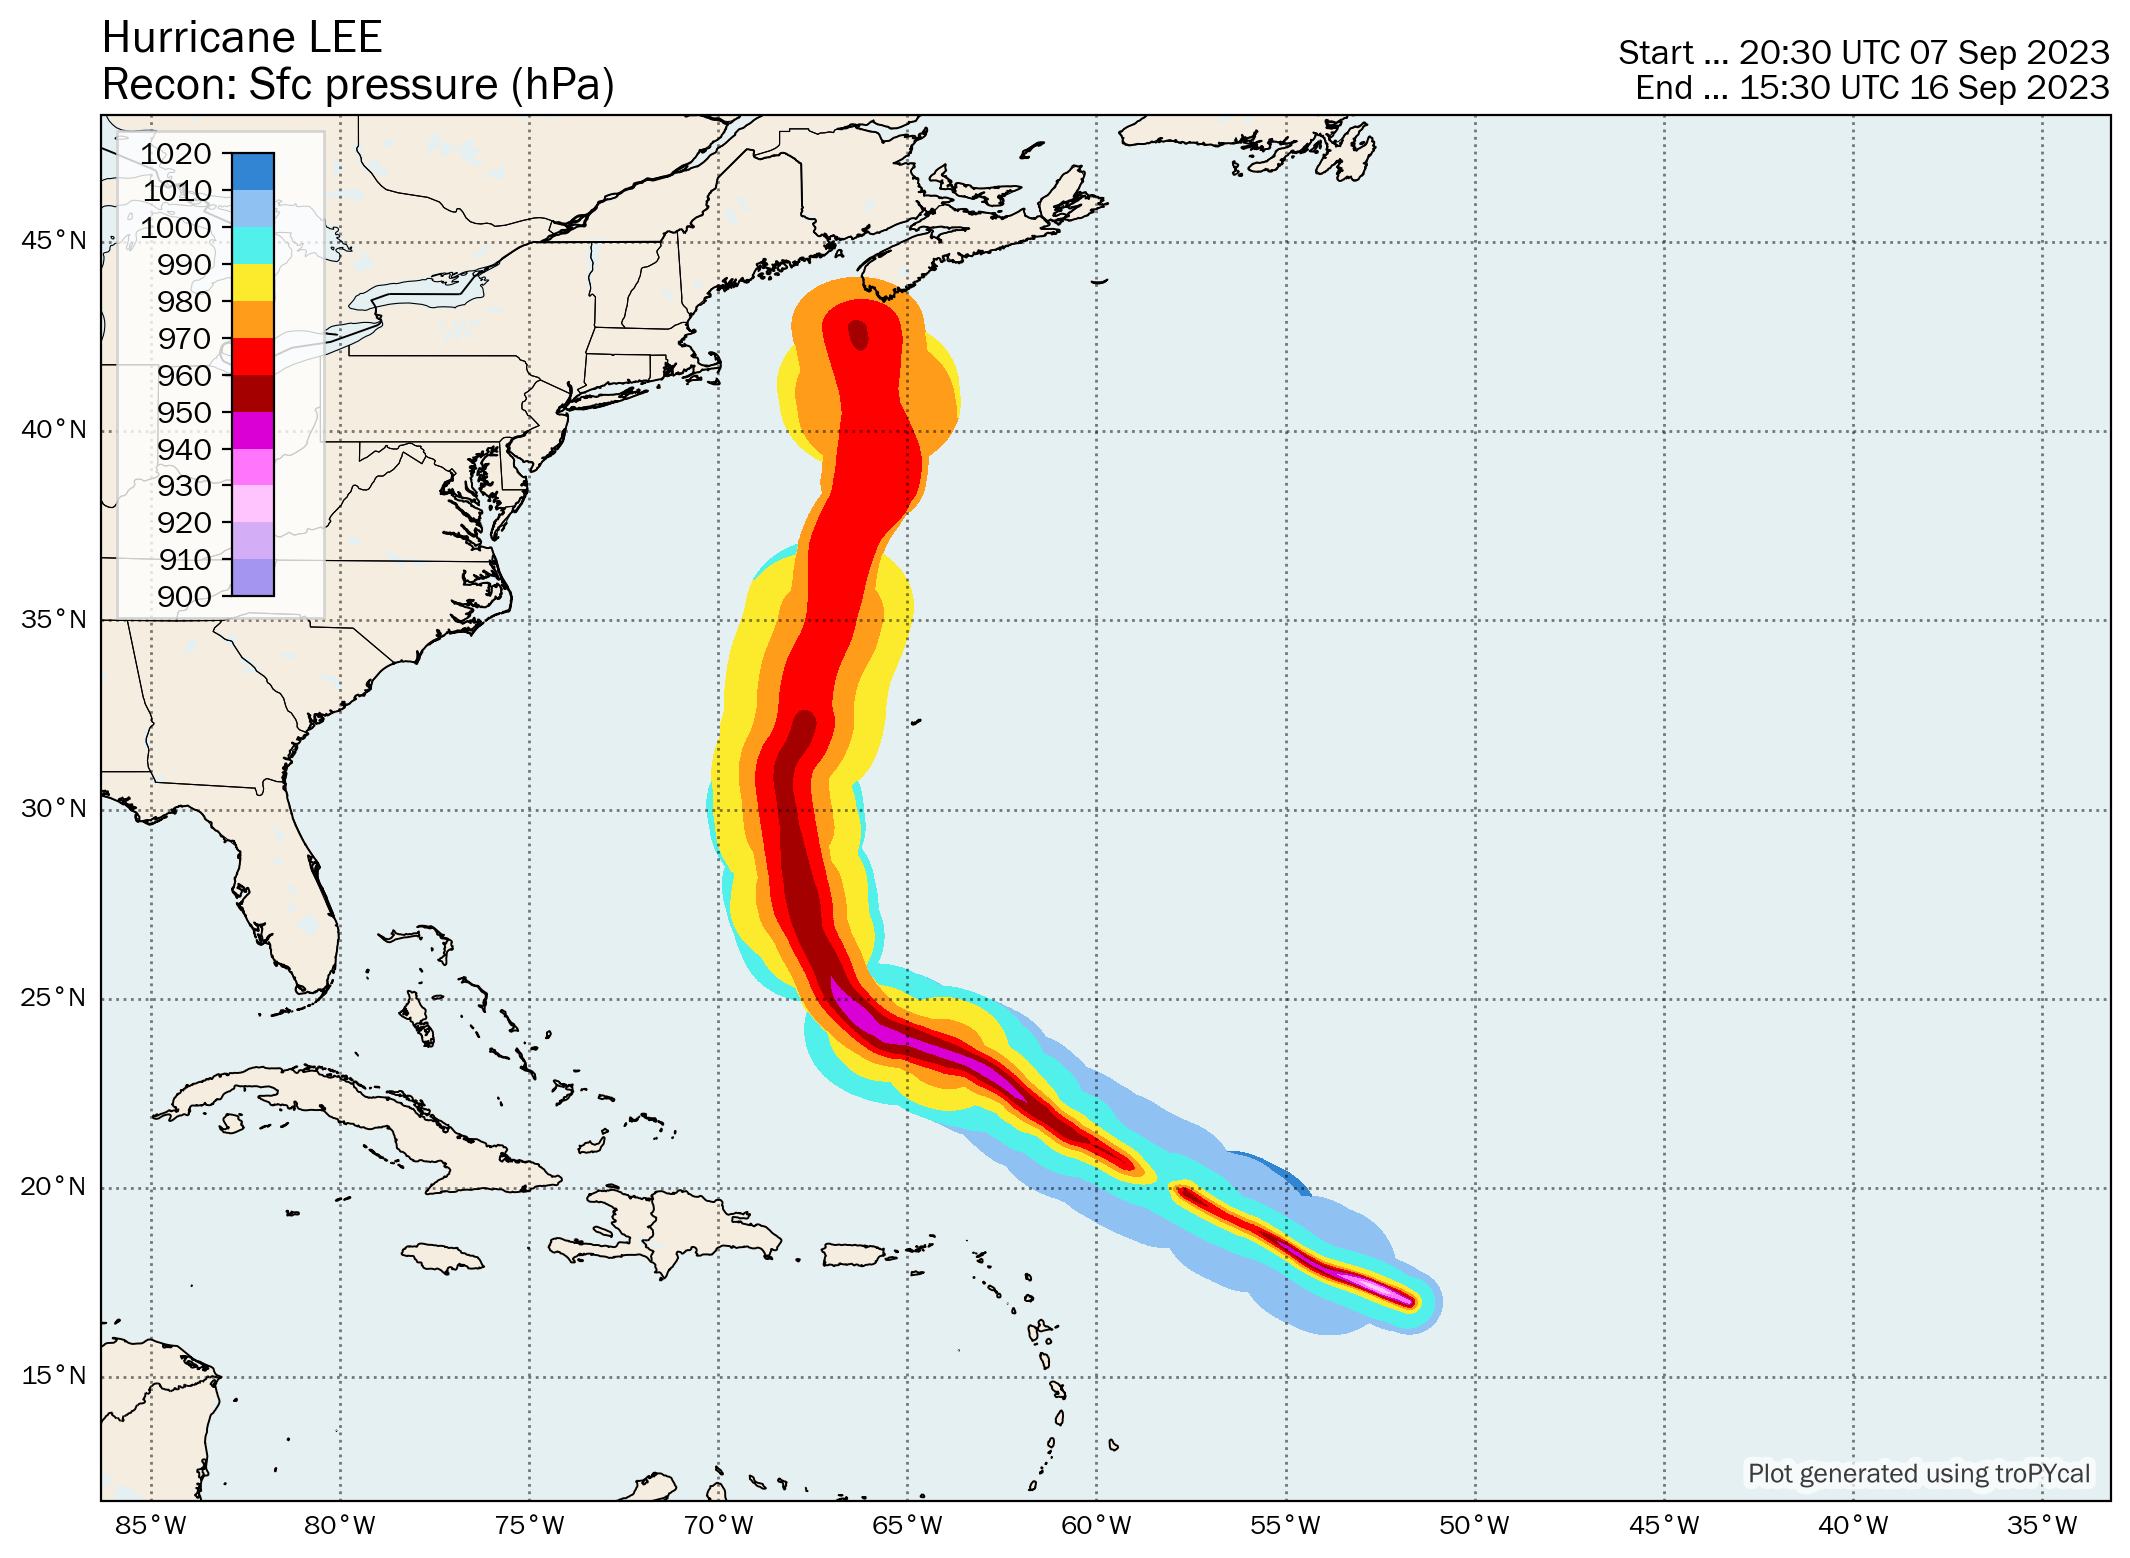
| 5 | Hurricane Lee | 145 kt | 926 hPa | 12z 09/05 | 00z 09/16 | 36.7 |
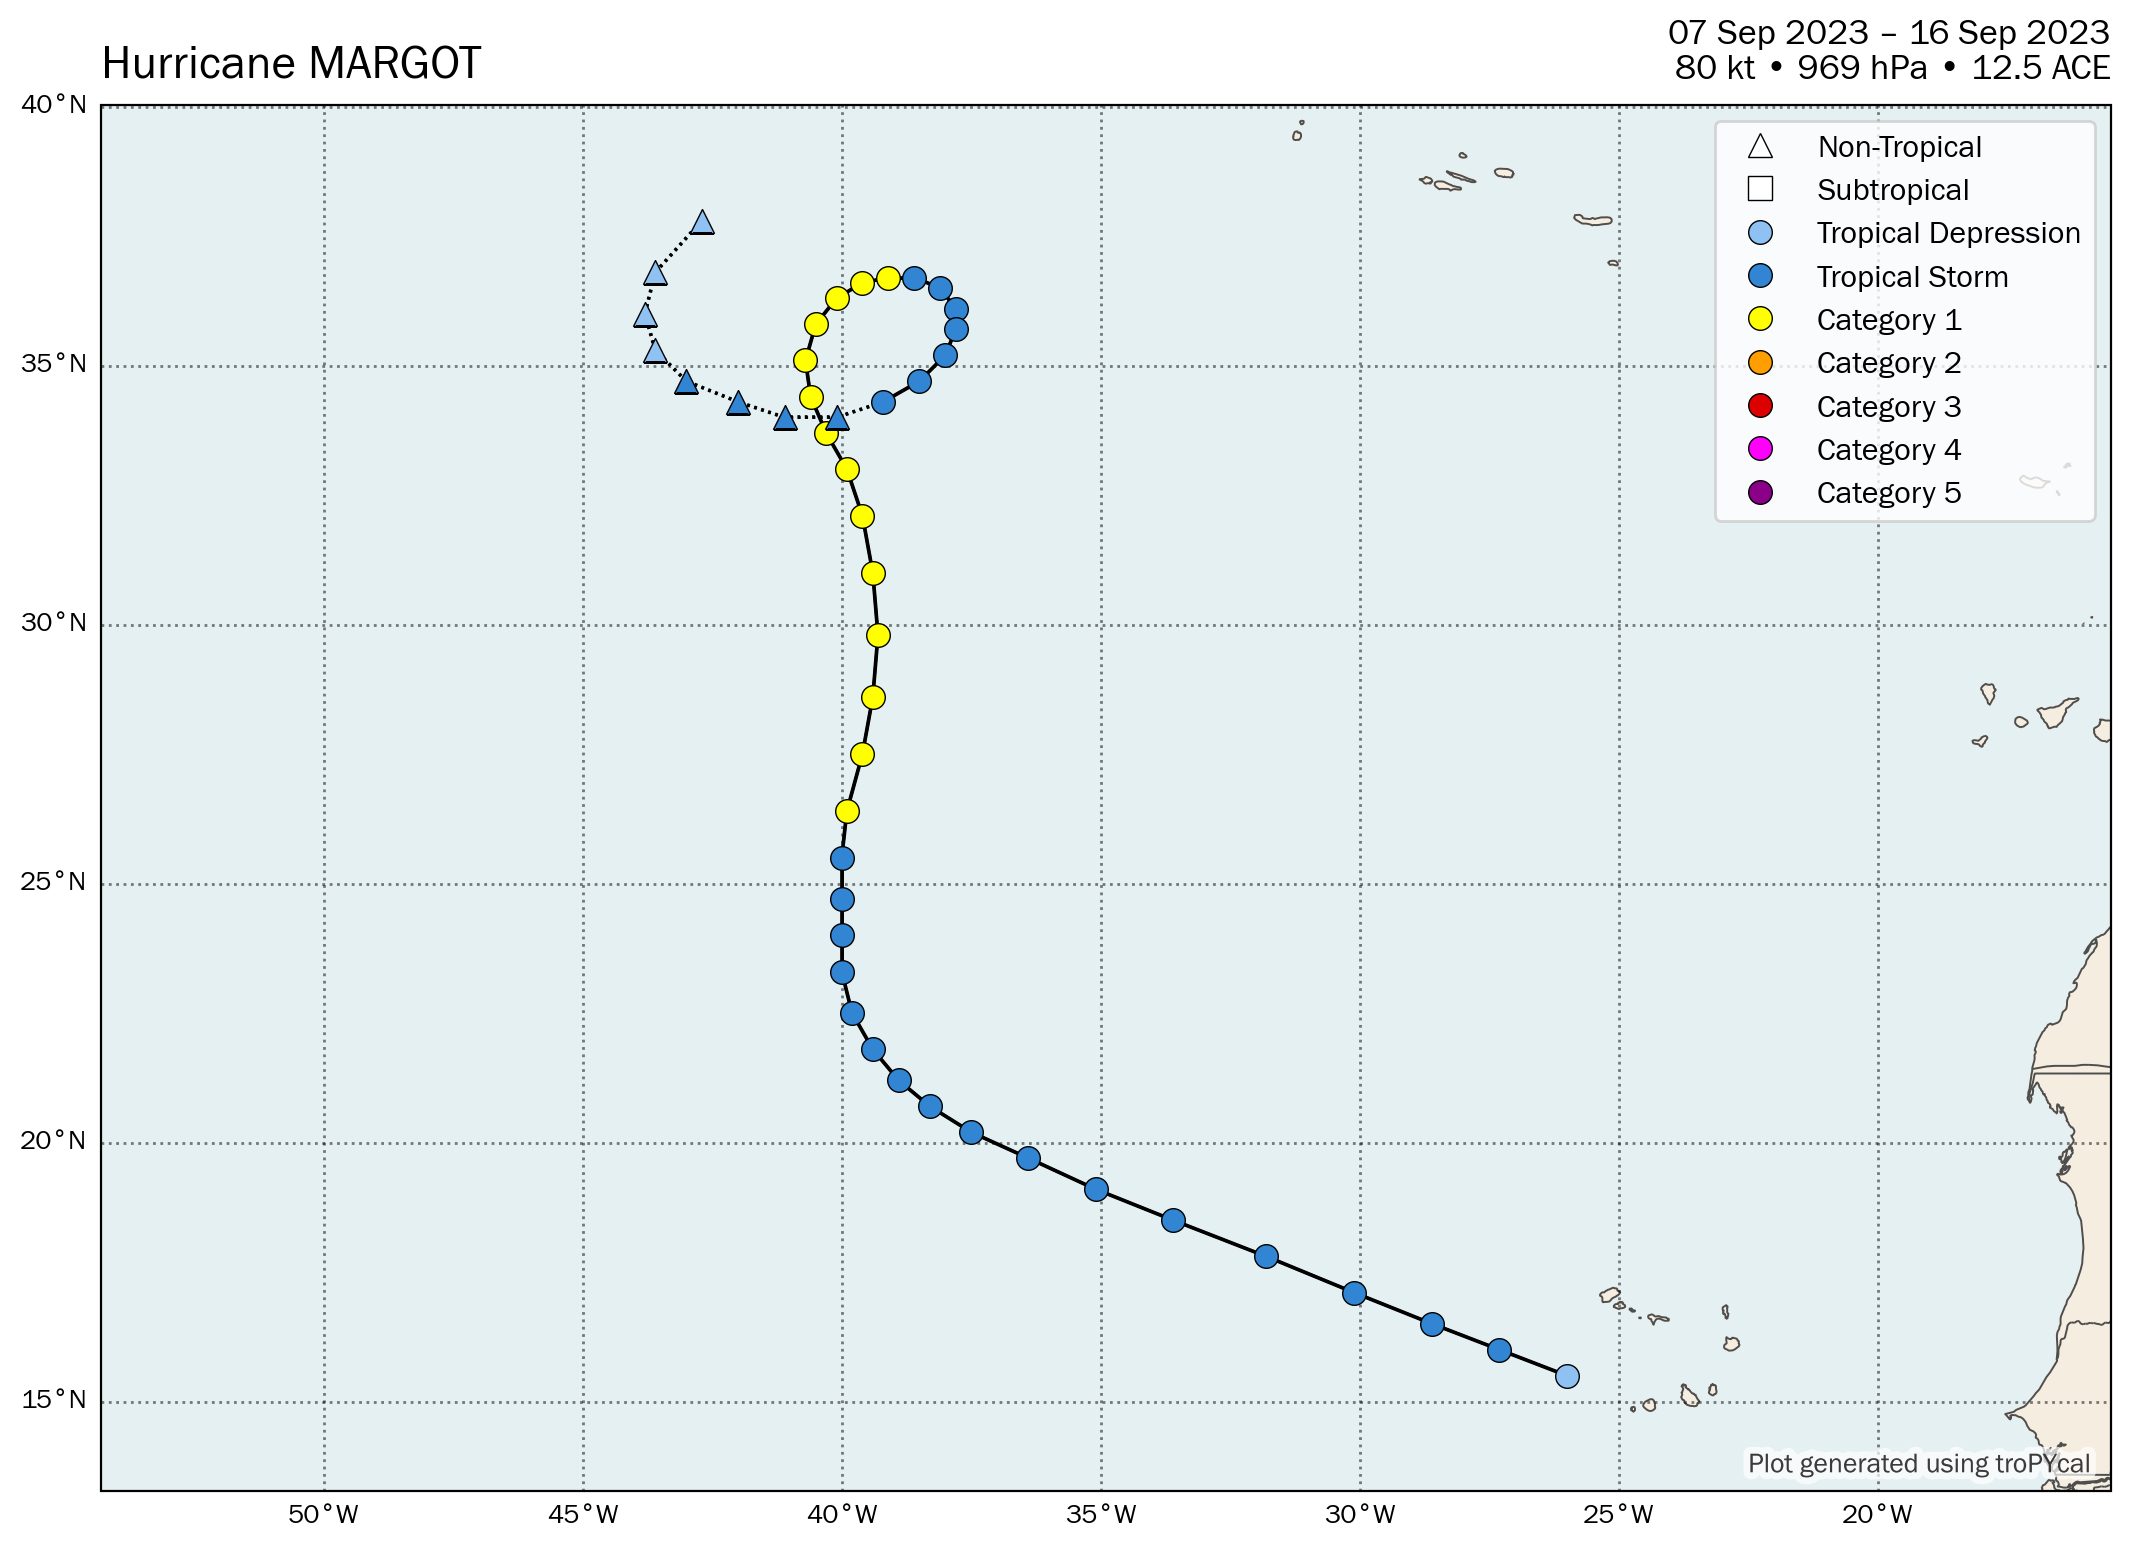
| 1 | Hurricane Margot | 80 kt | 969 hPa | 12z 09/07 | 18z 09/16 | 12.5 |
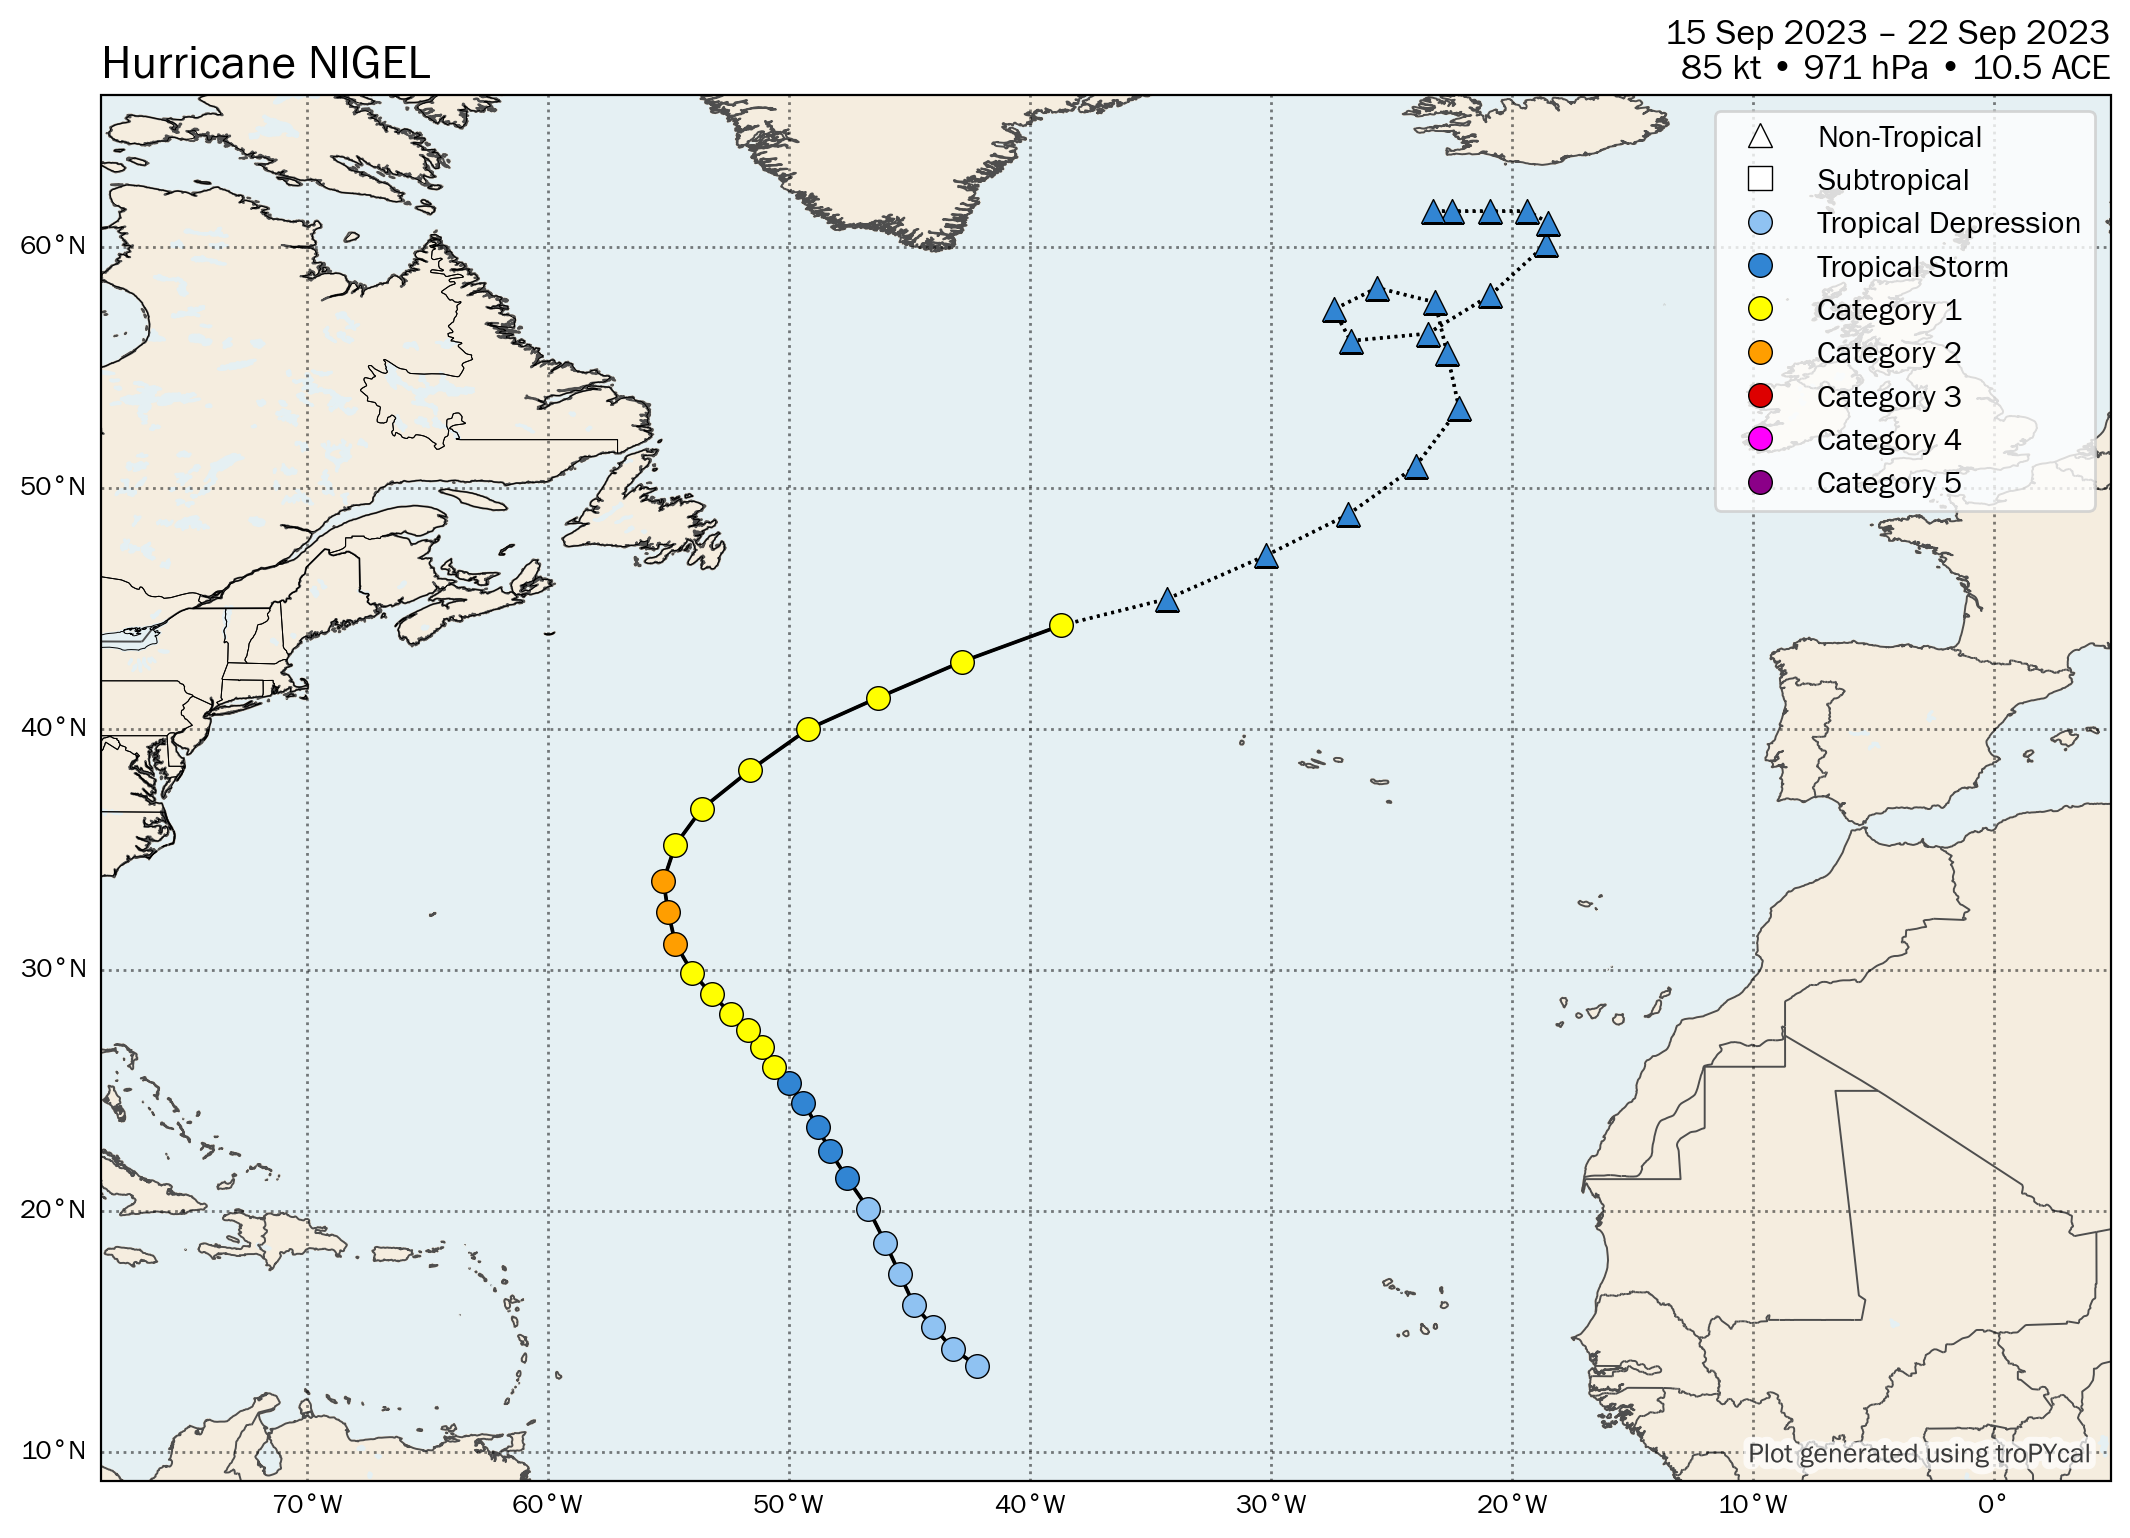
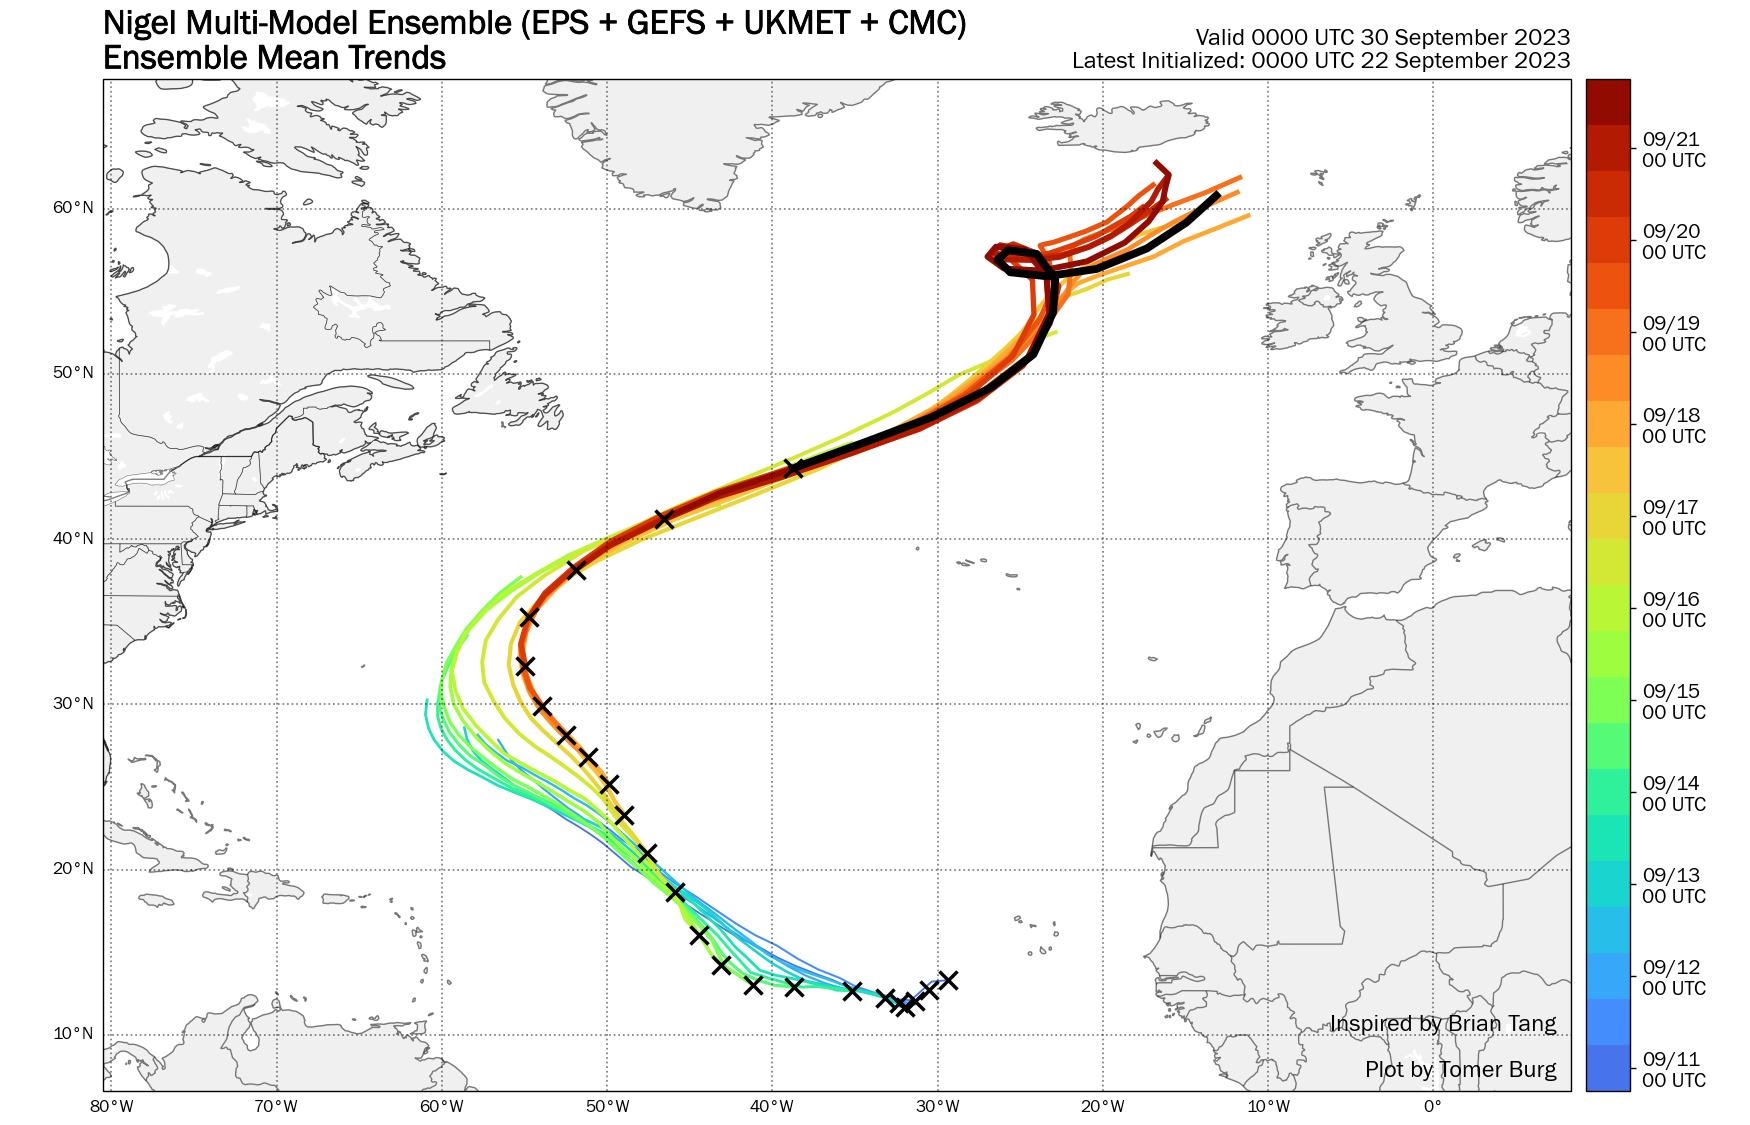
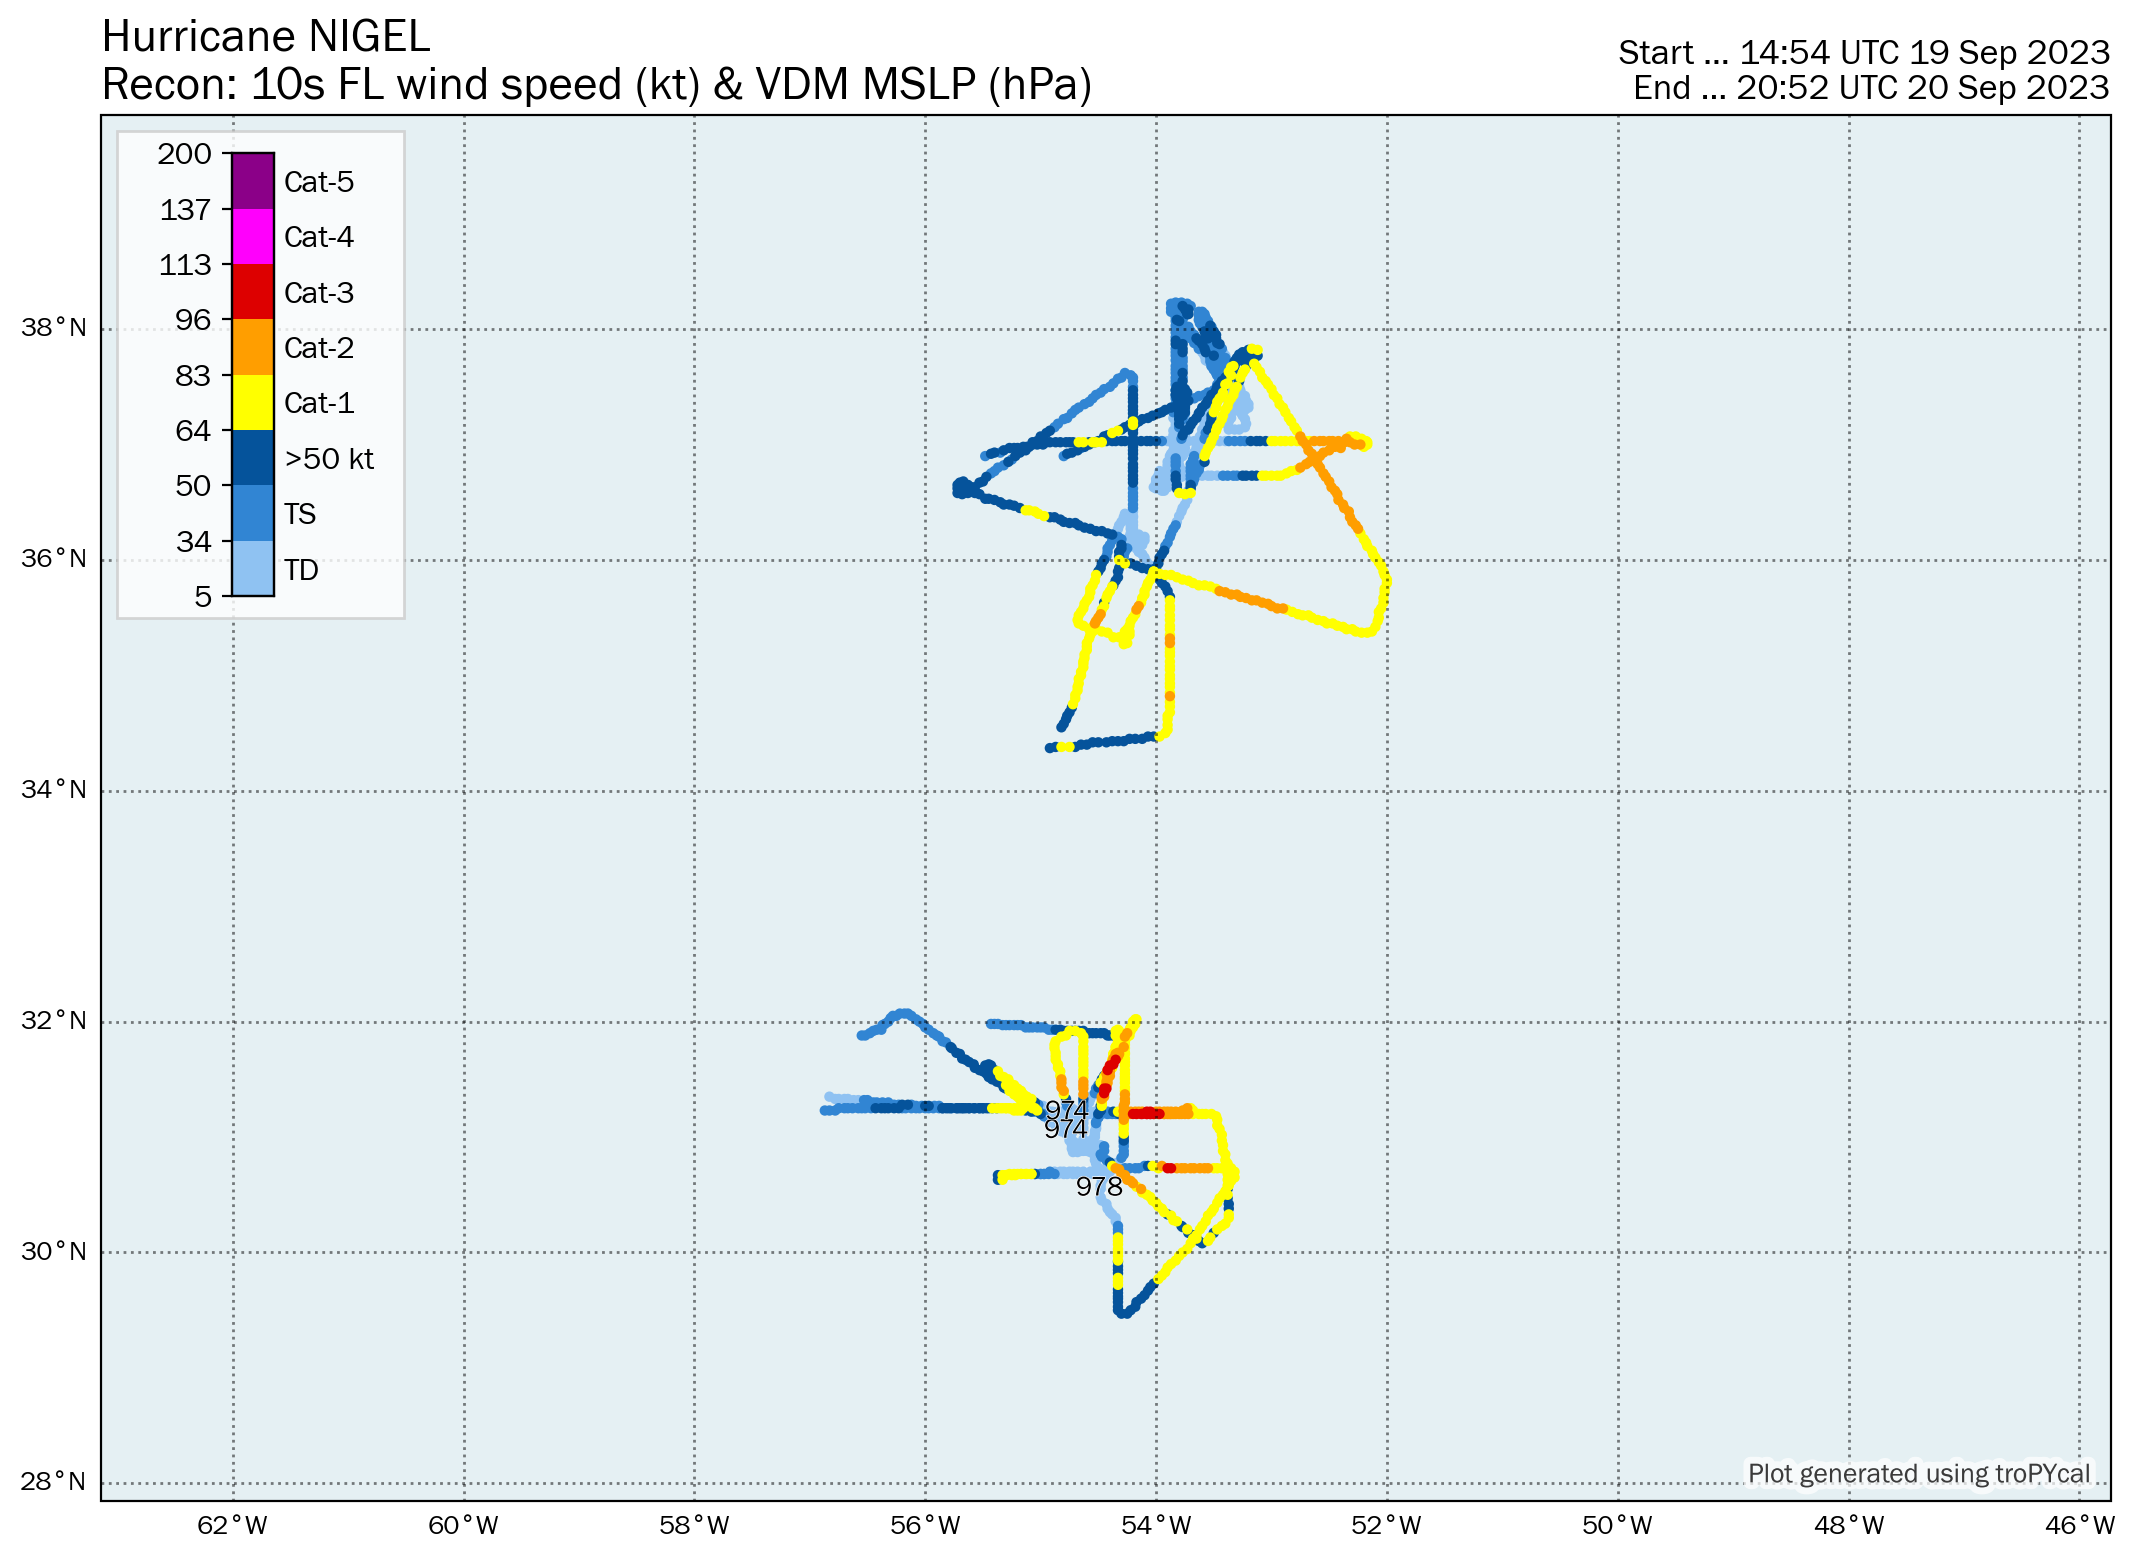
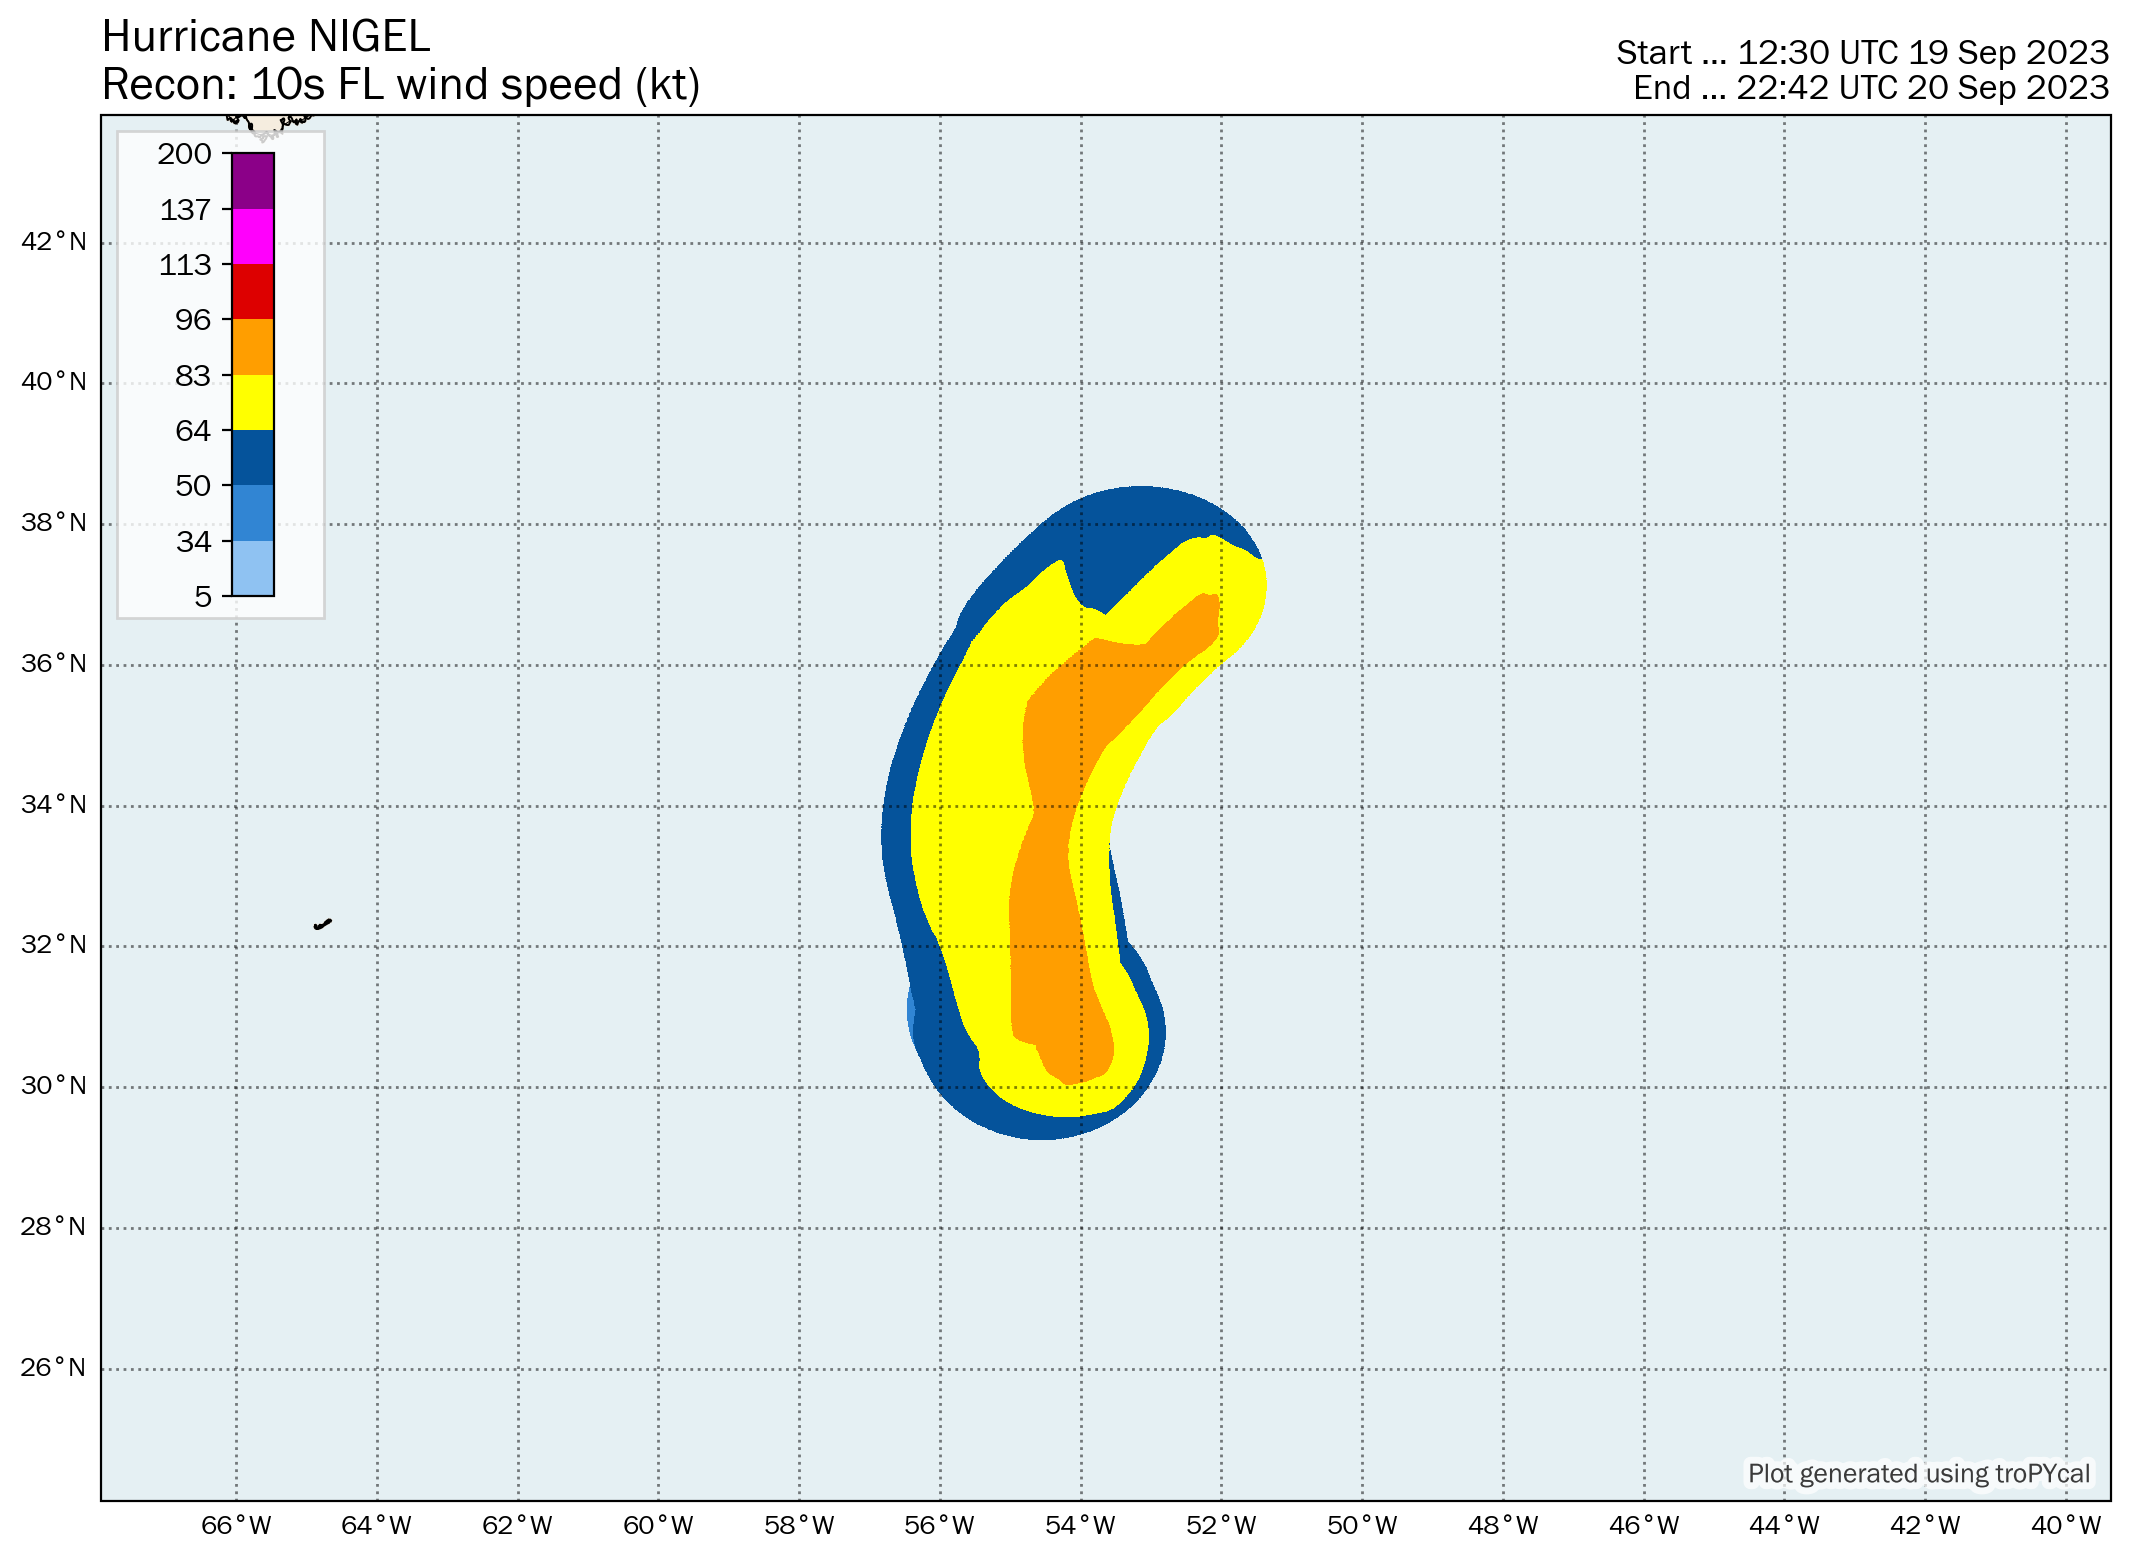
| 2 | Hurricane Nigel | 85 kt | 971 hPa | 06z 09/15 | 00z 09/22 | 10.5 |
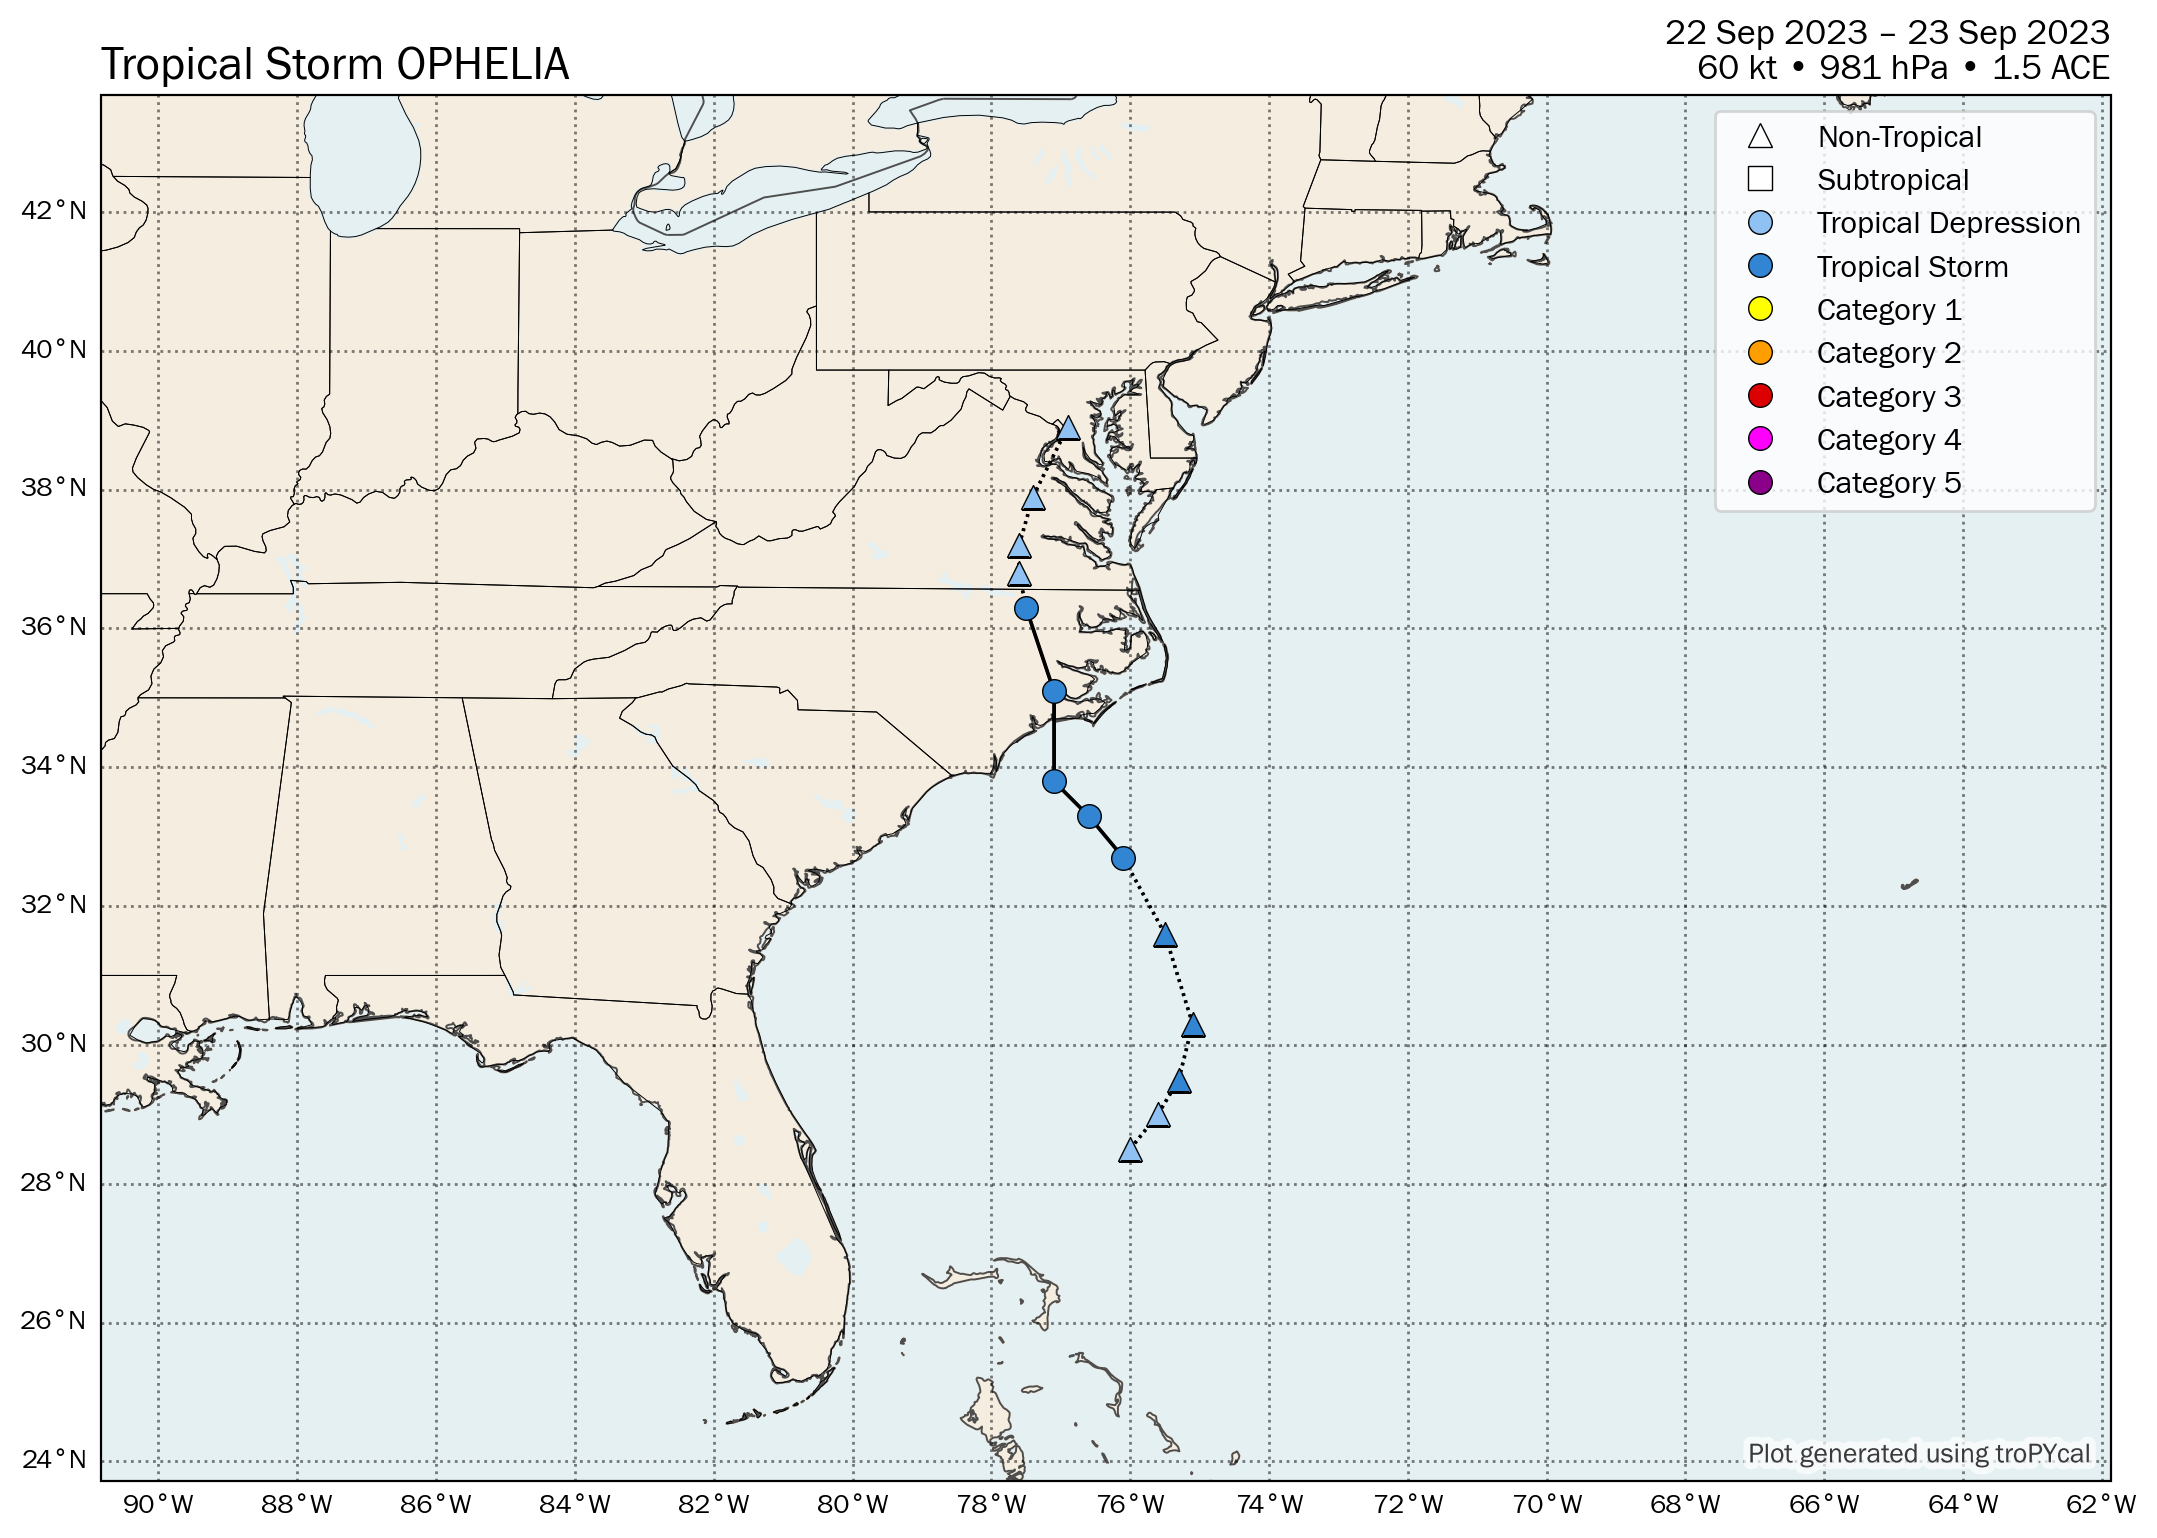
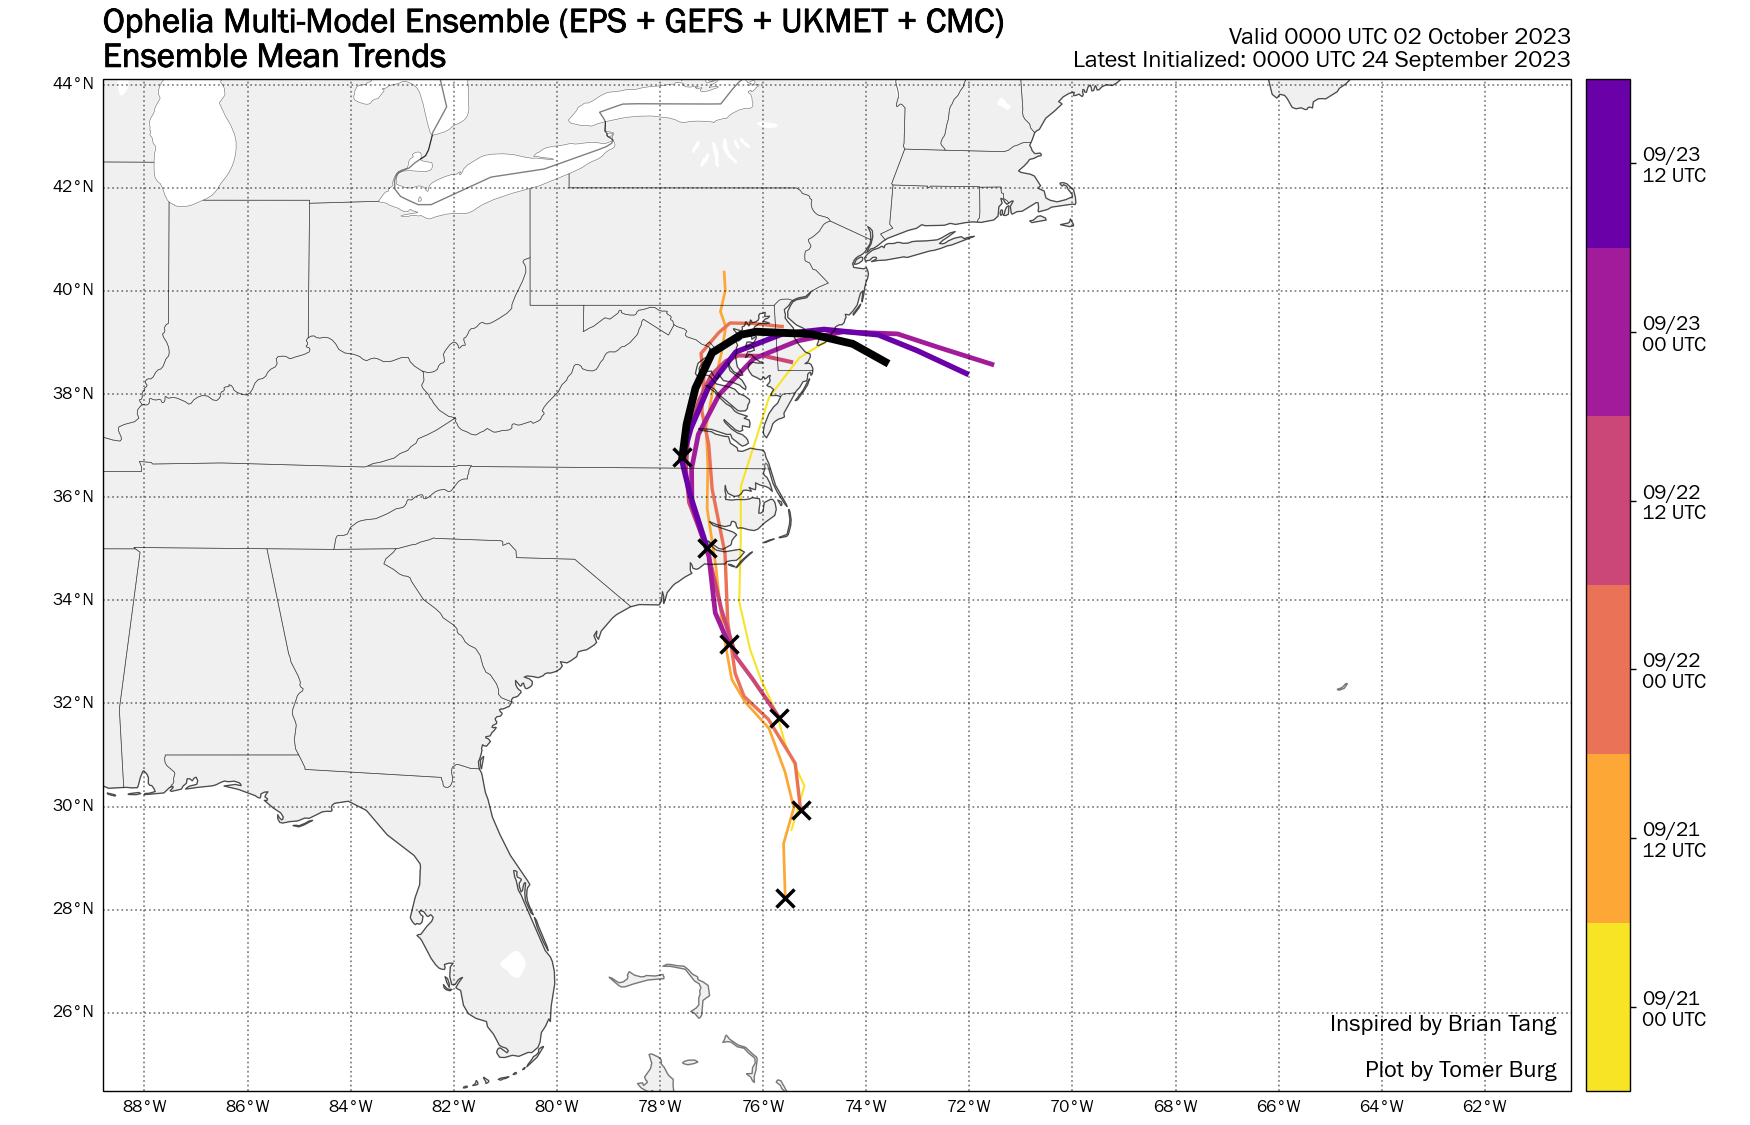
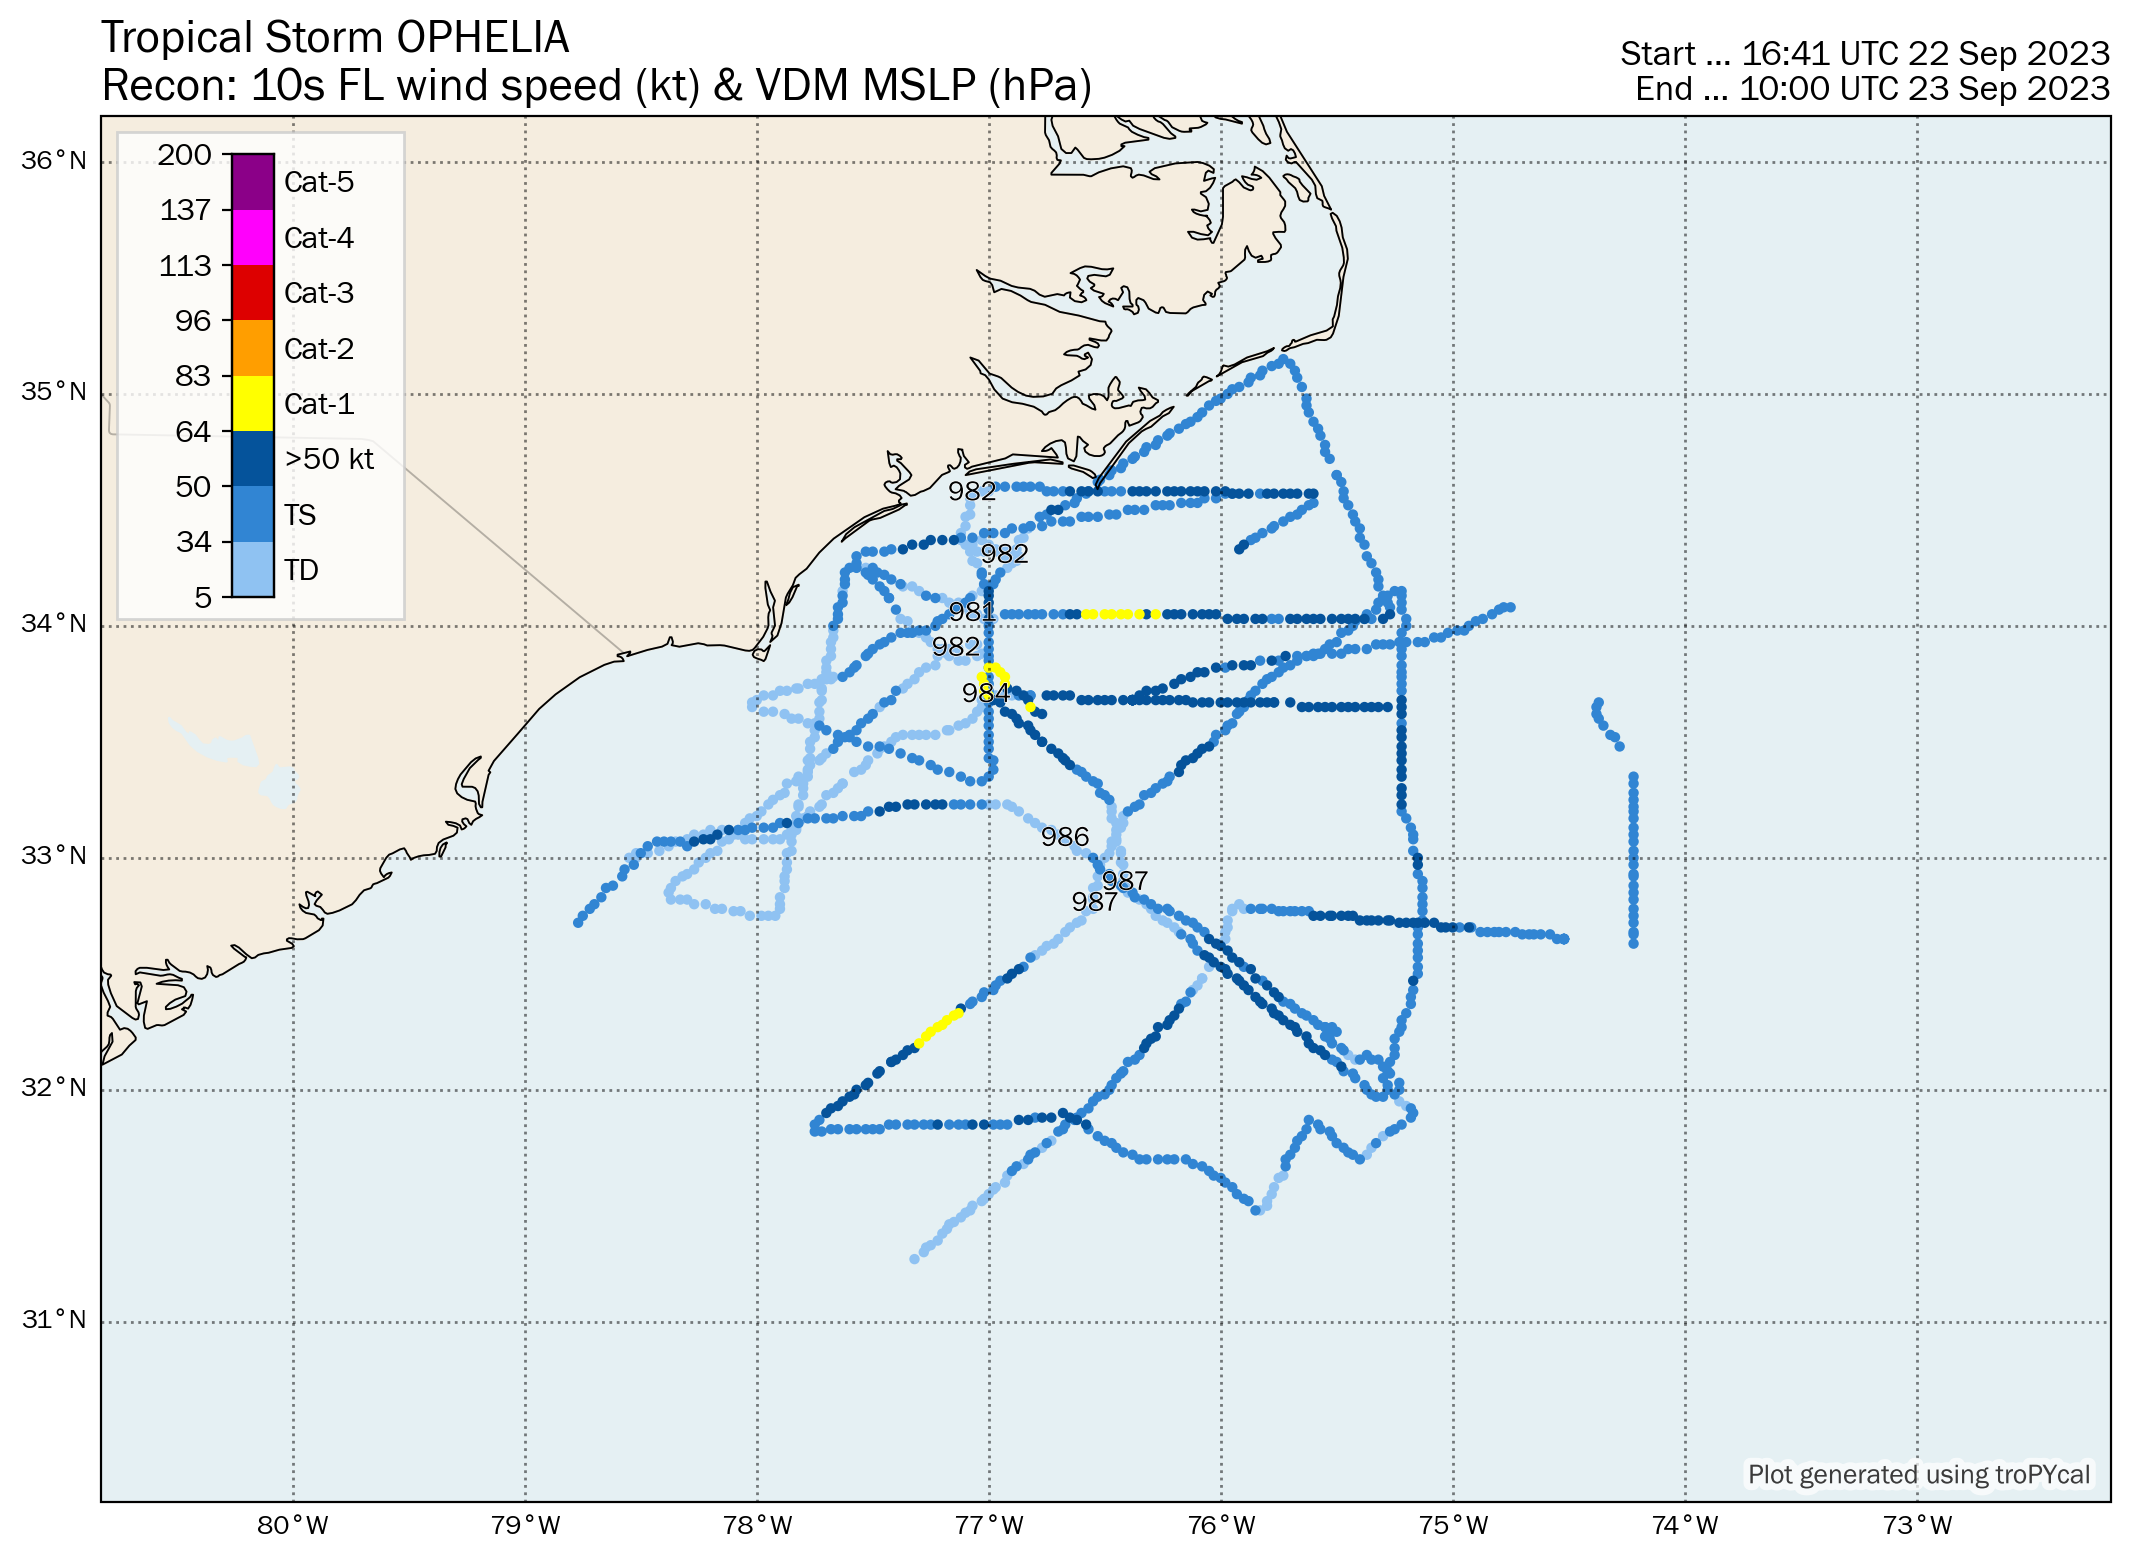
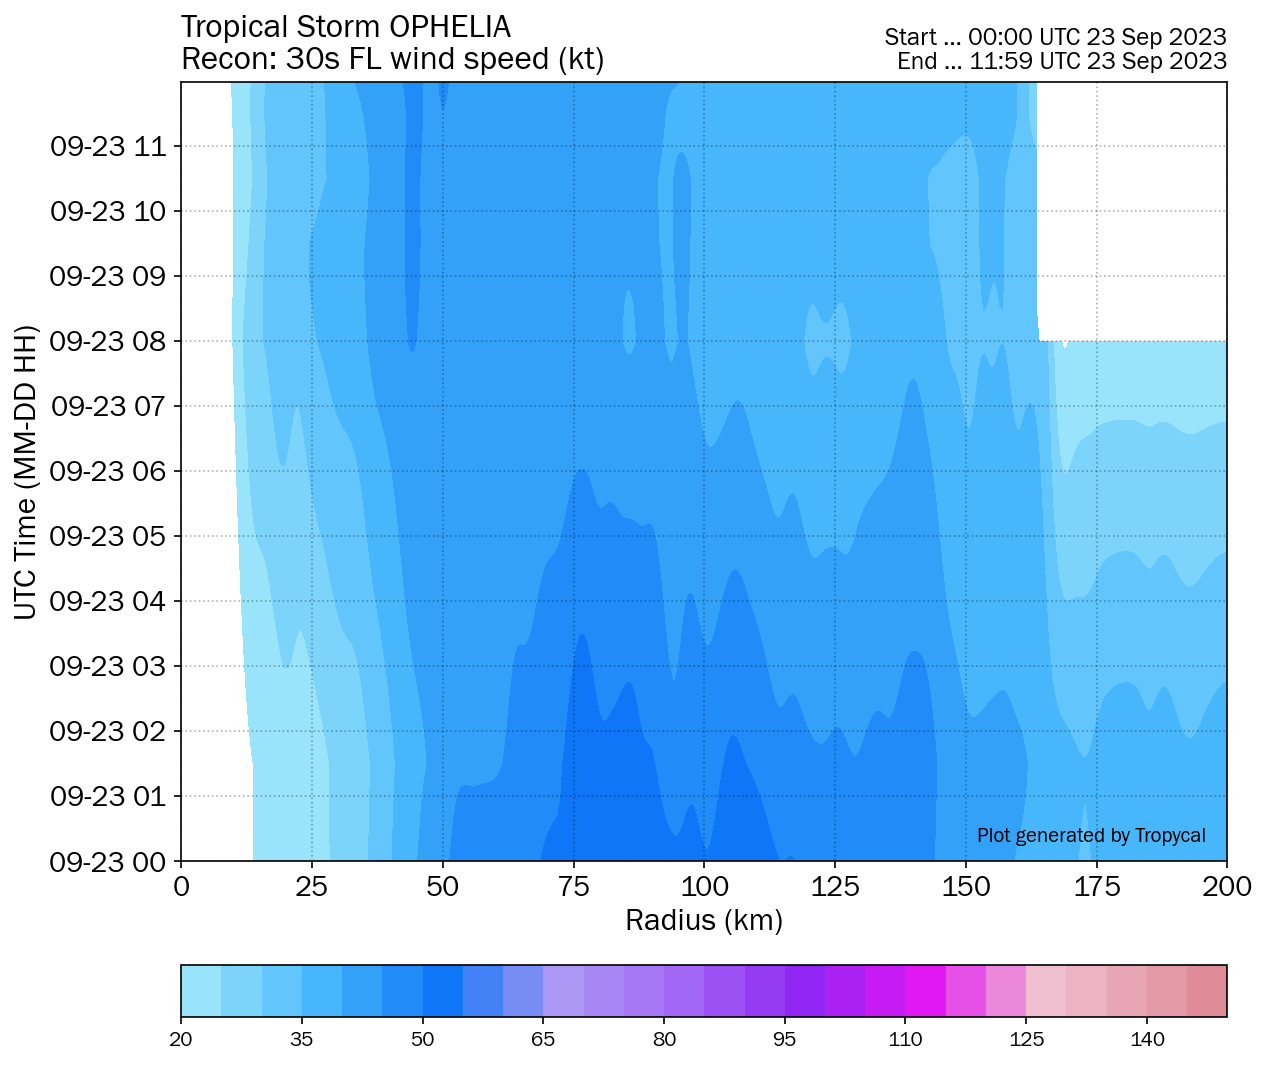
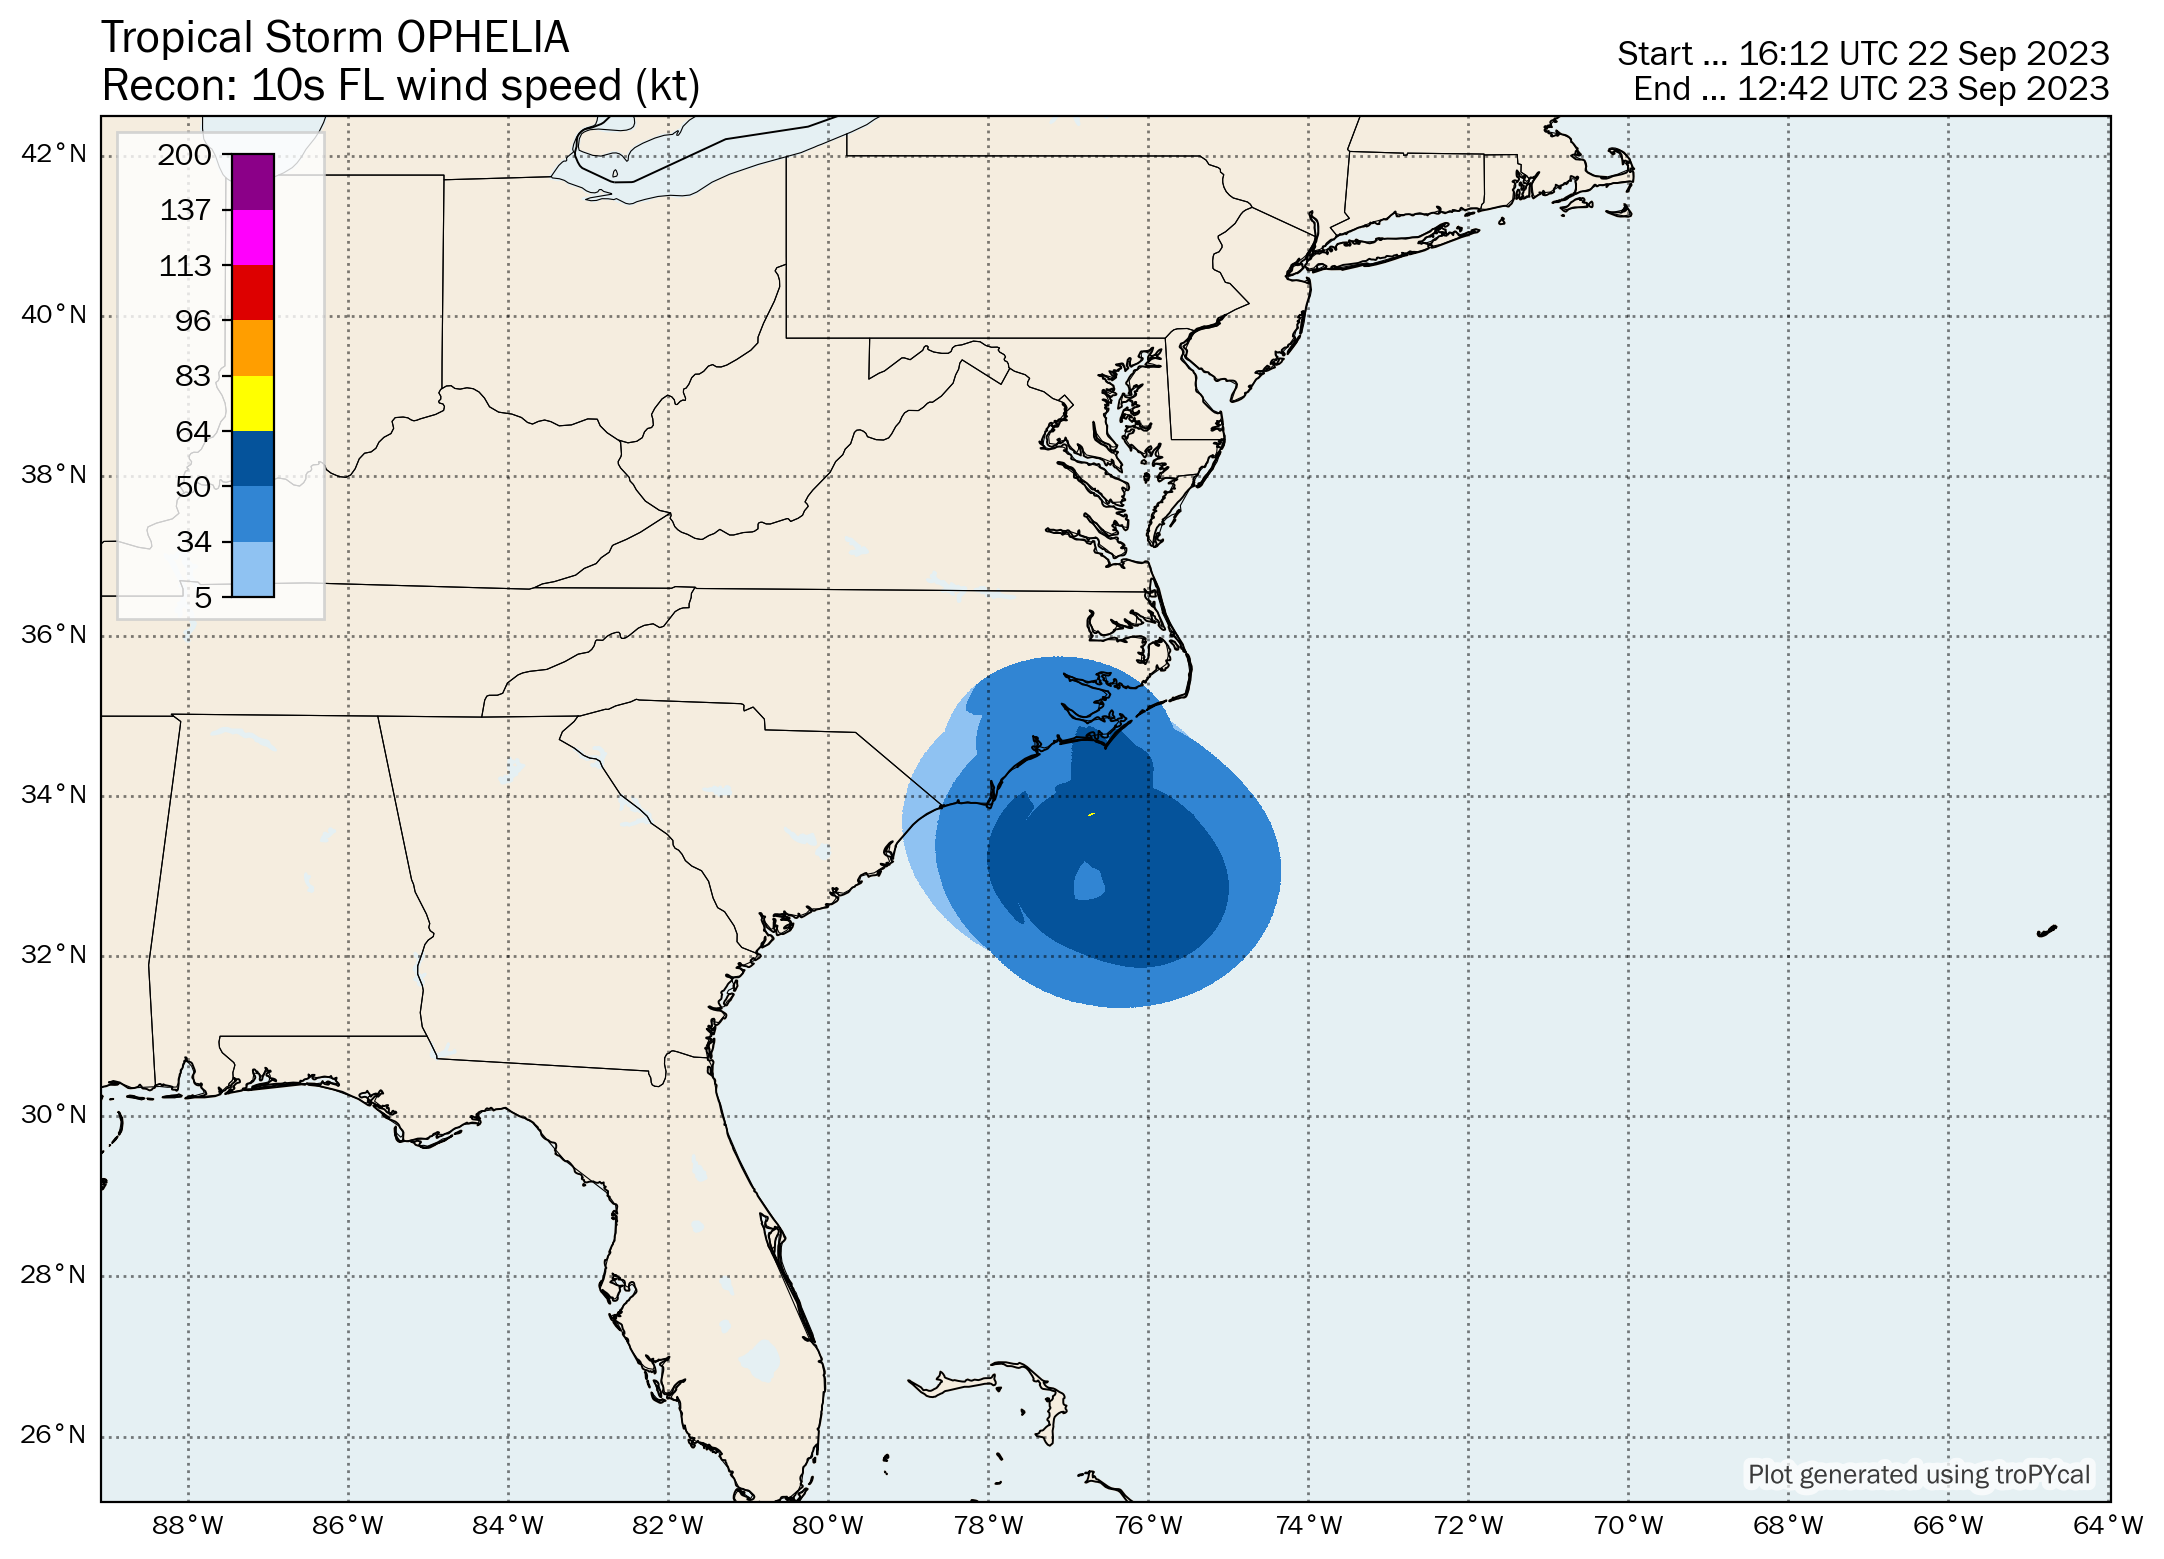
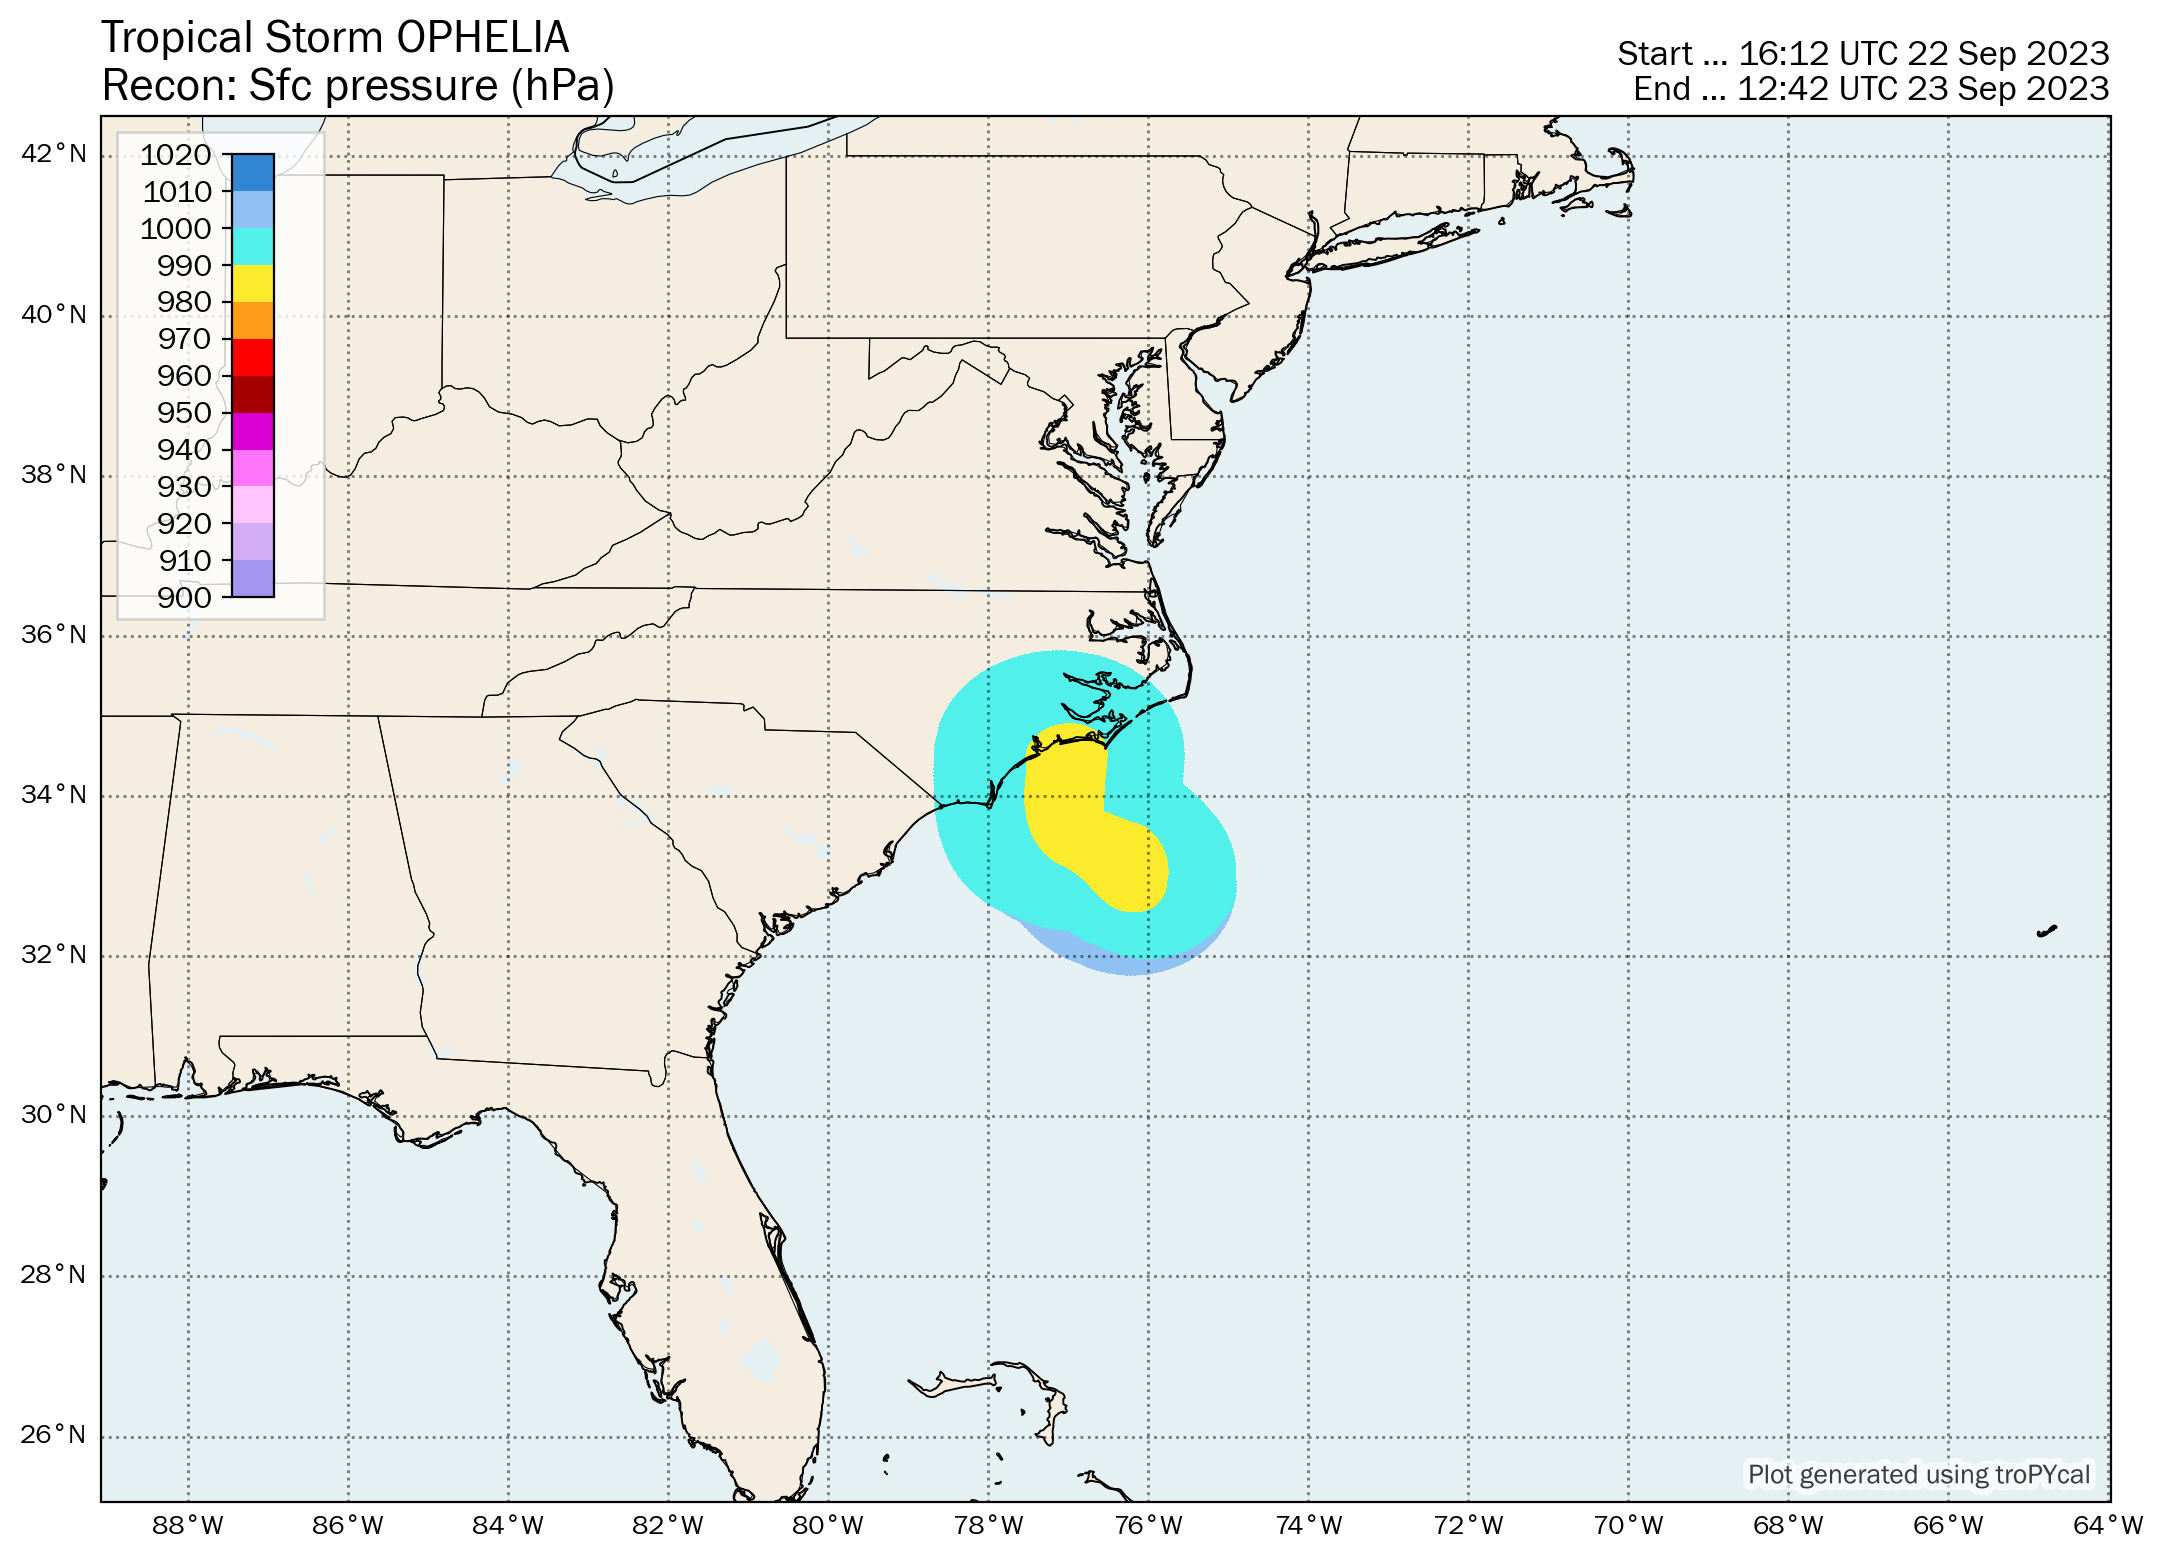
| S | Tropical Storm Ophelia | 60 kt | 981 hPa | 18z 09/22 | 18z 09/23 | 1.5 |
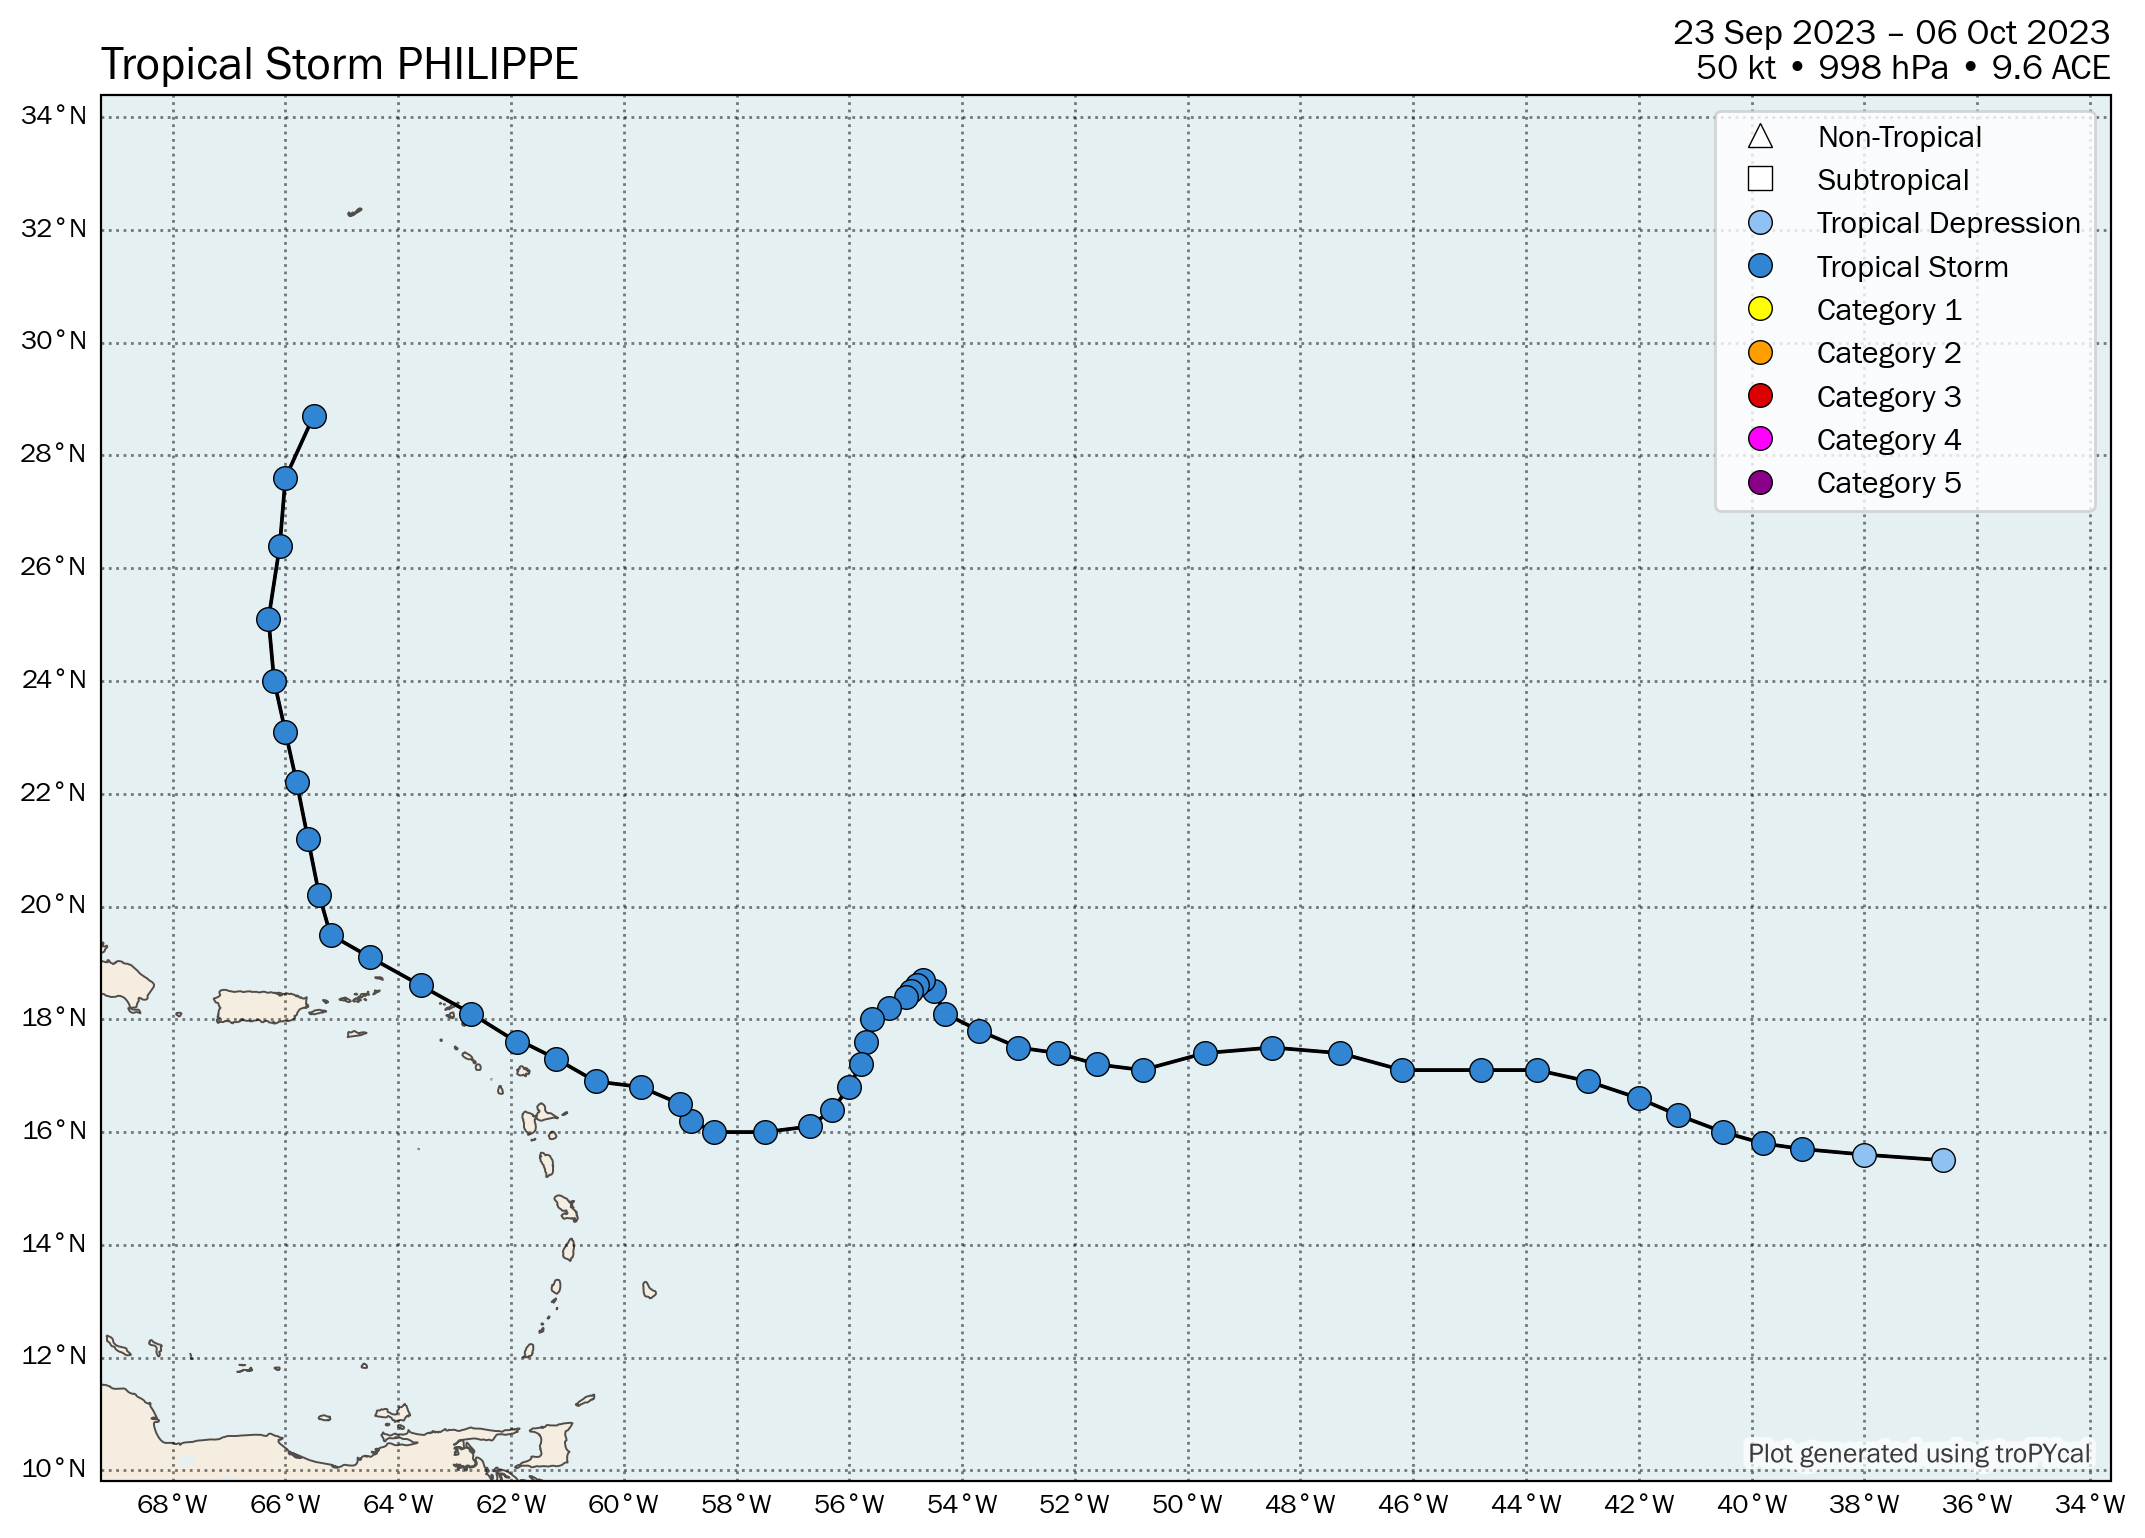
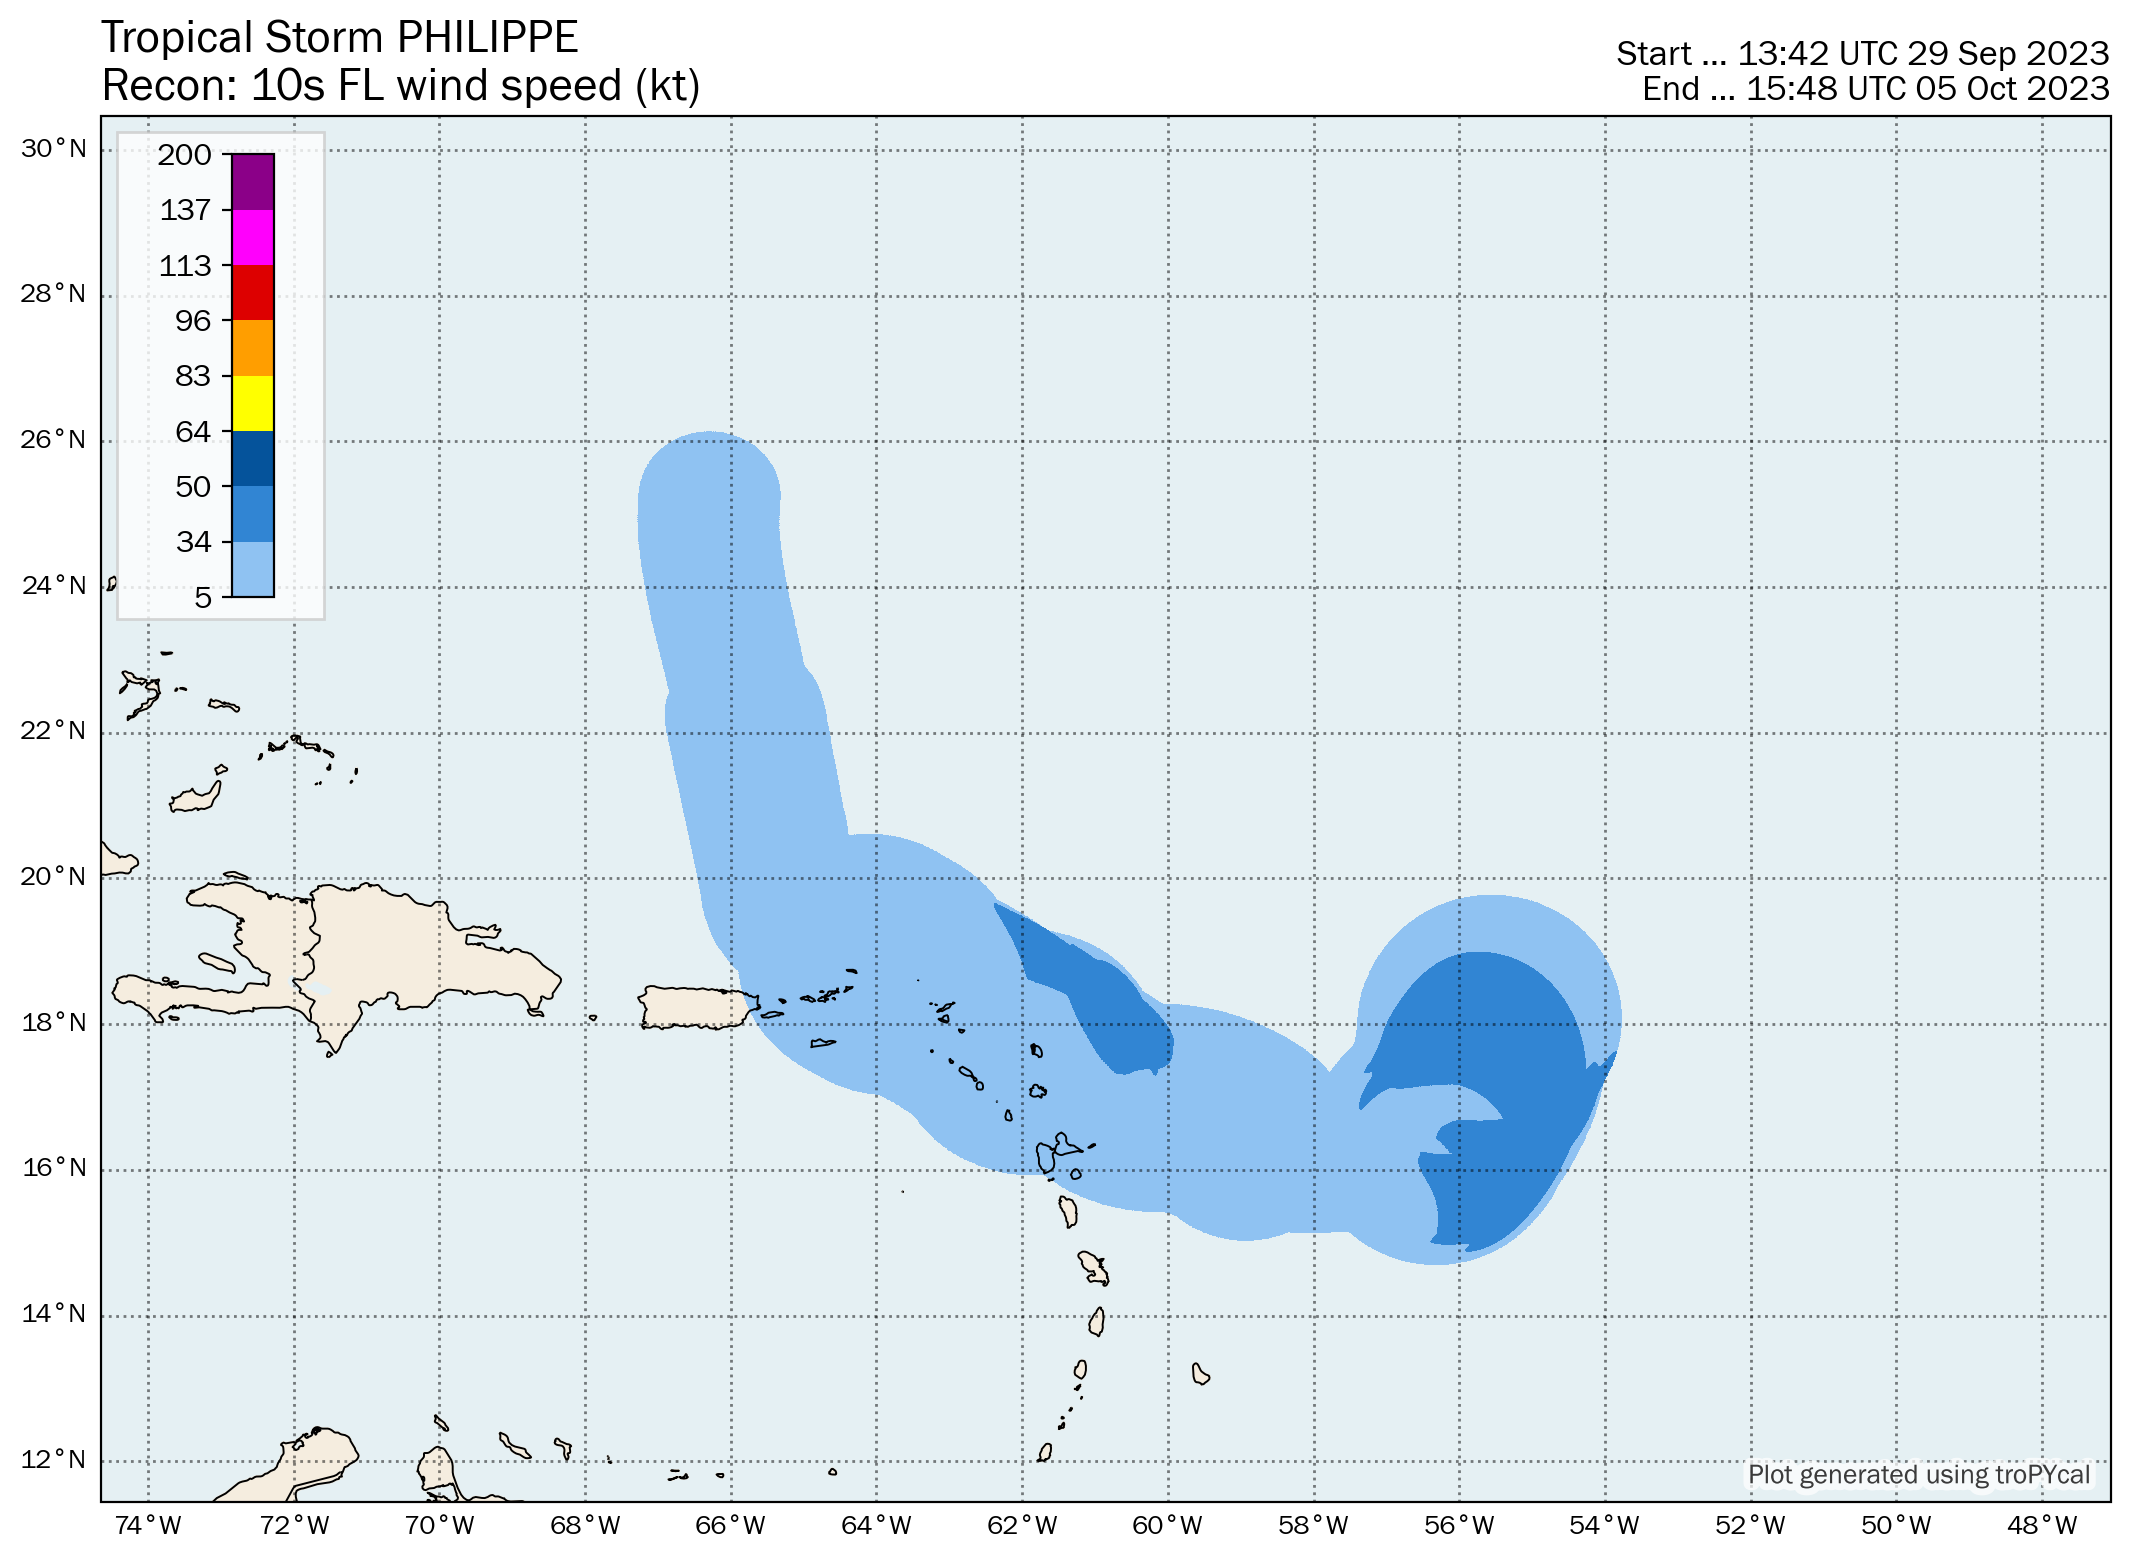
| S | Tropical Storm Philippe | 50 kt | 998 hPa | 06z 09/23 | 06z 10/06 | 9.6 |
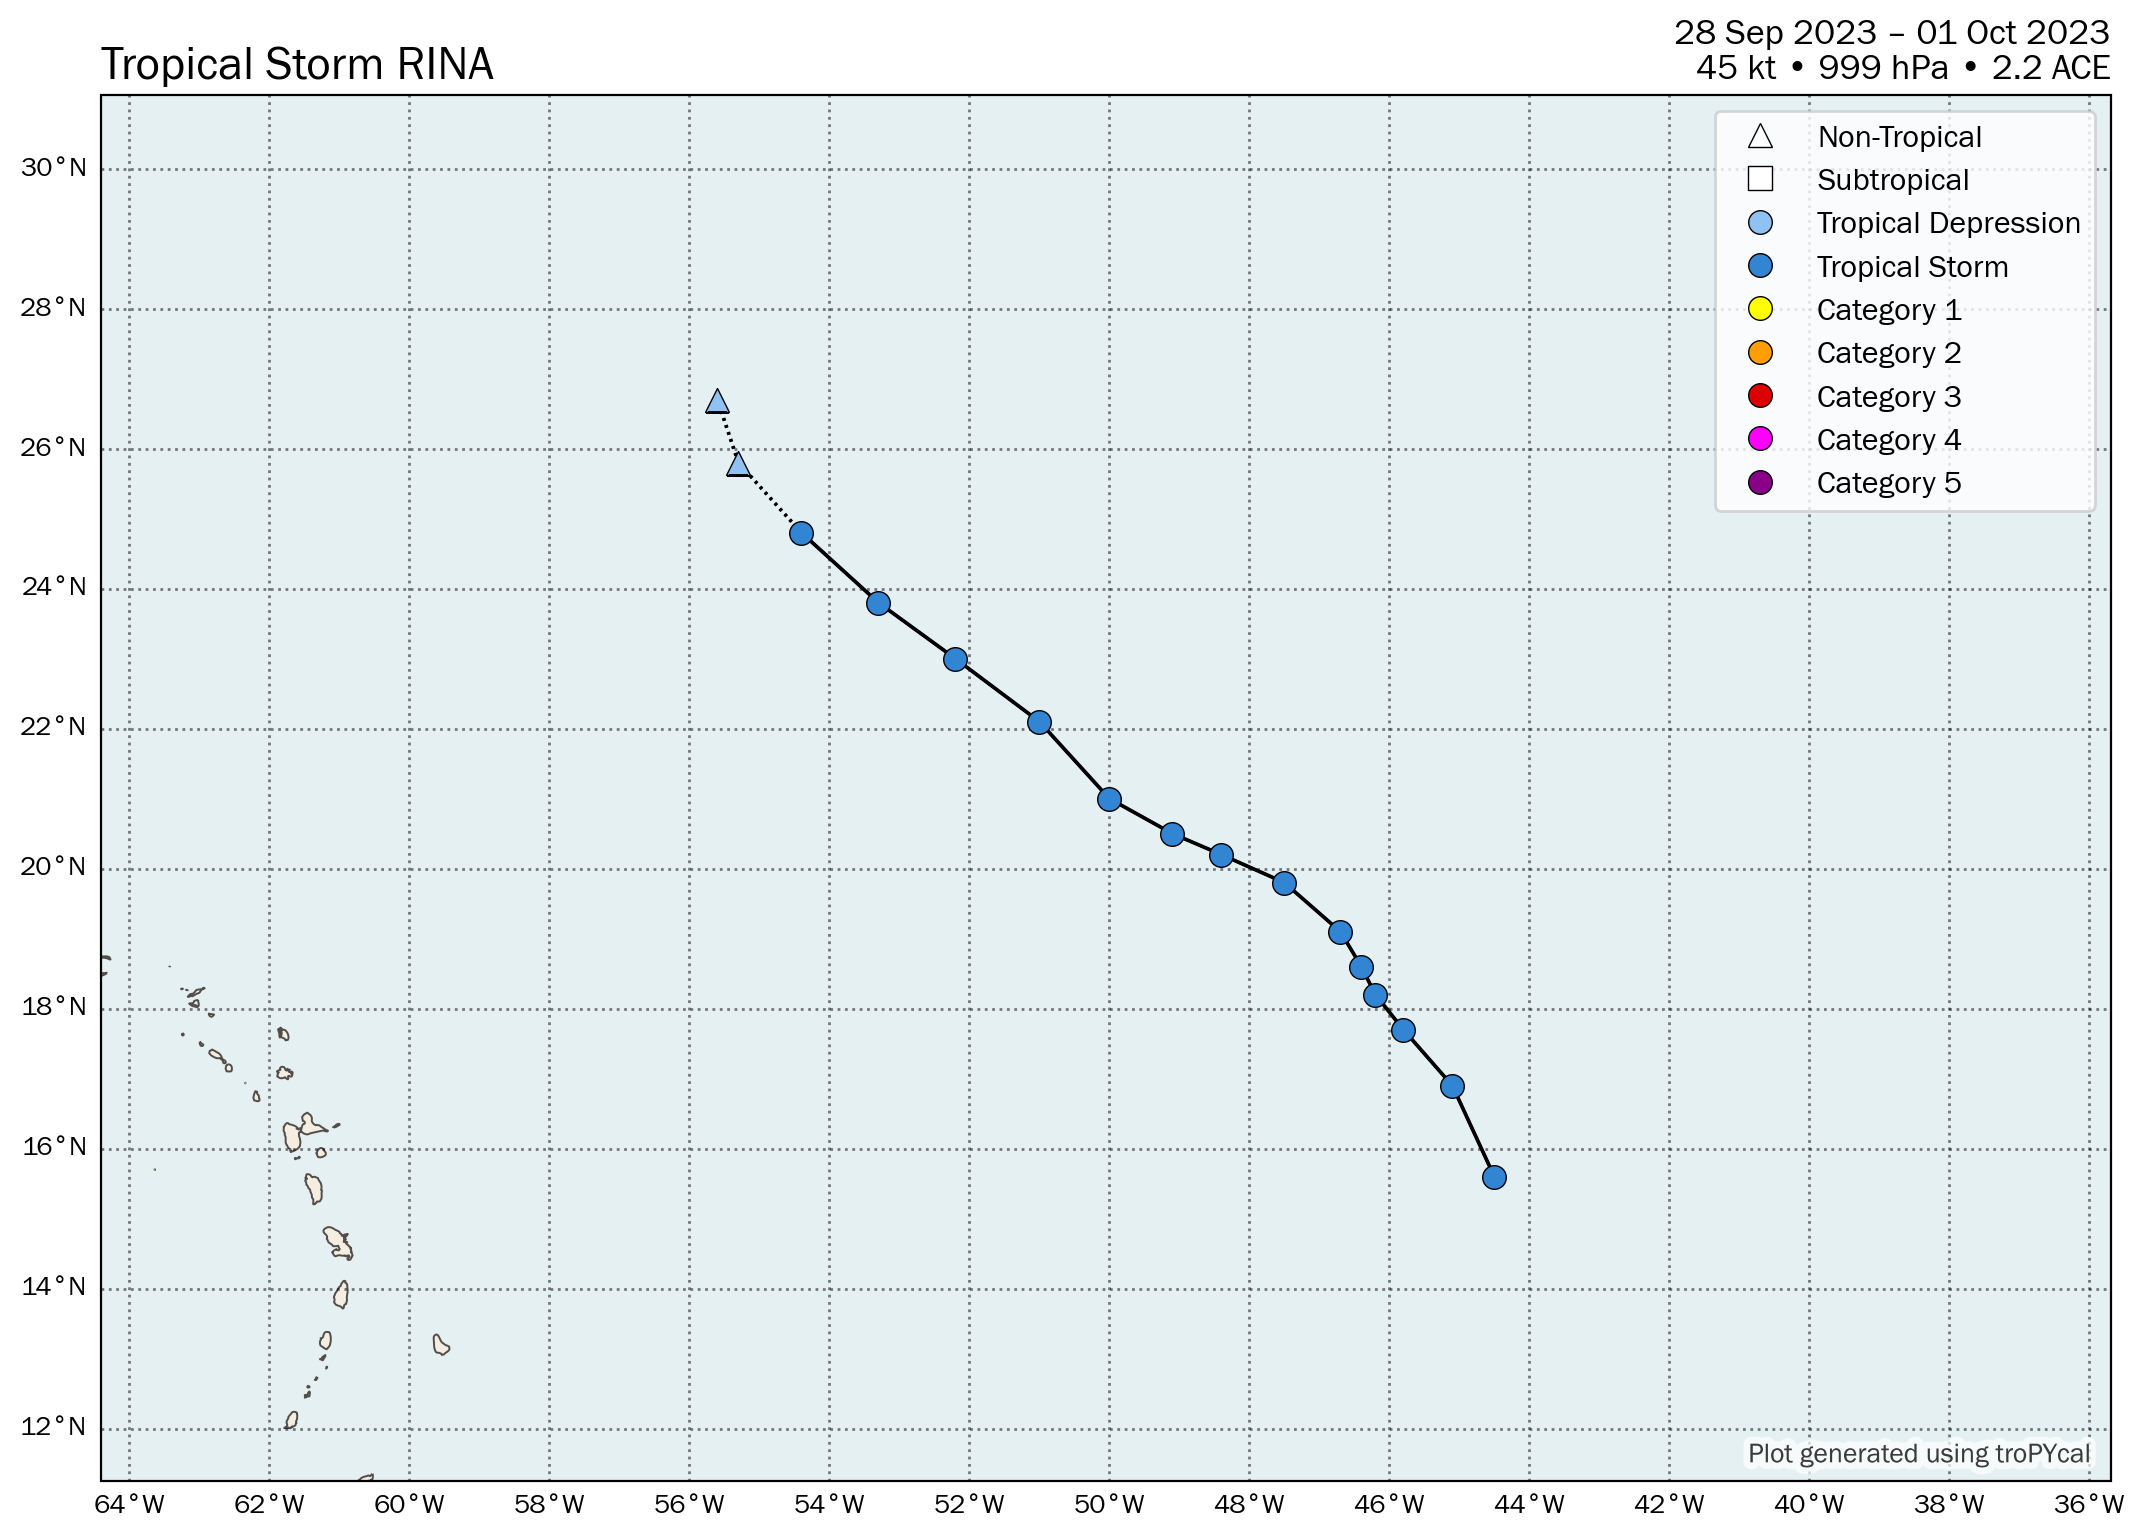
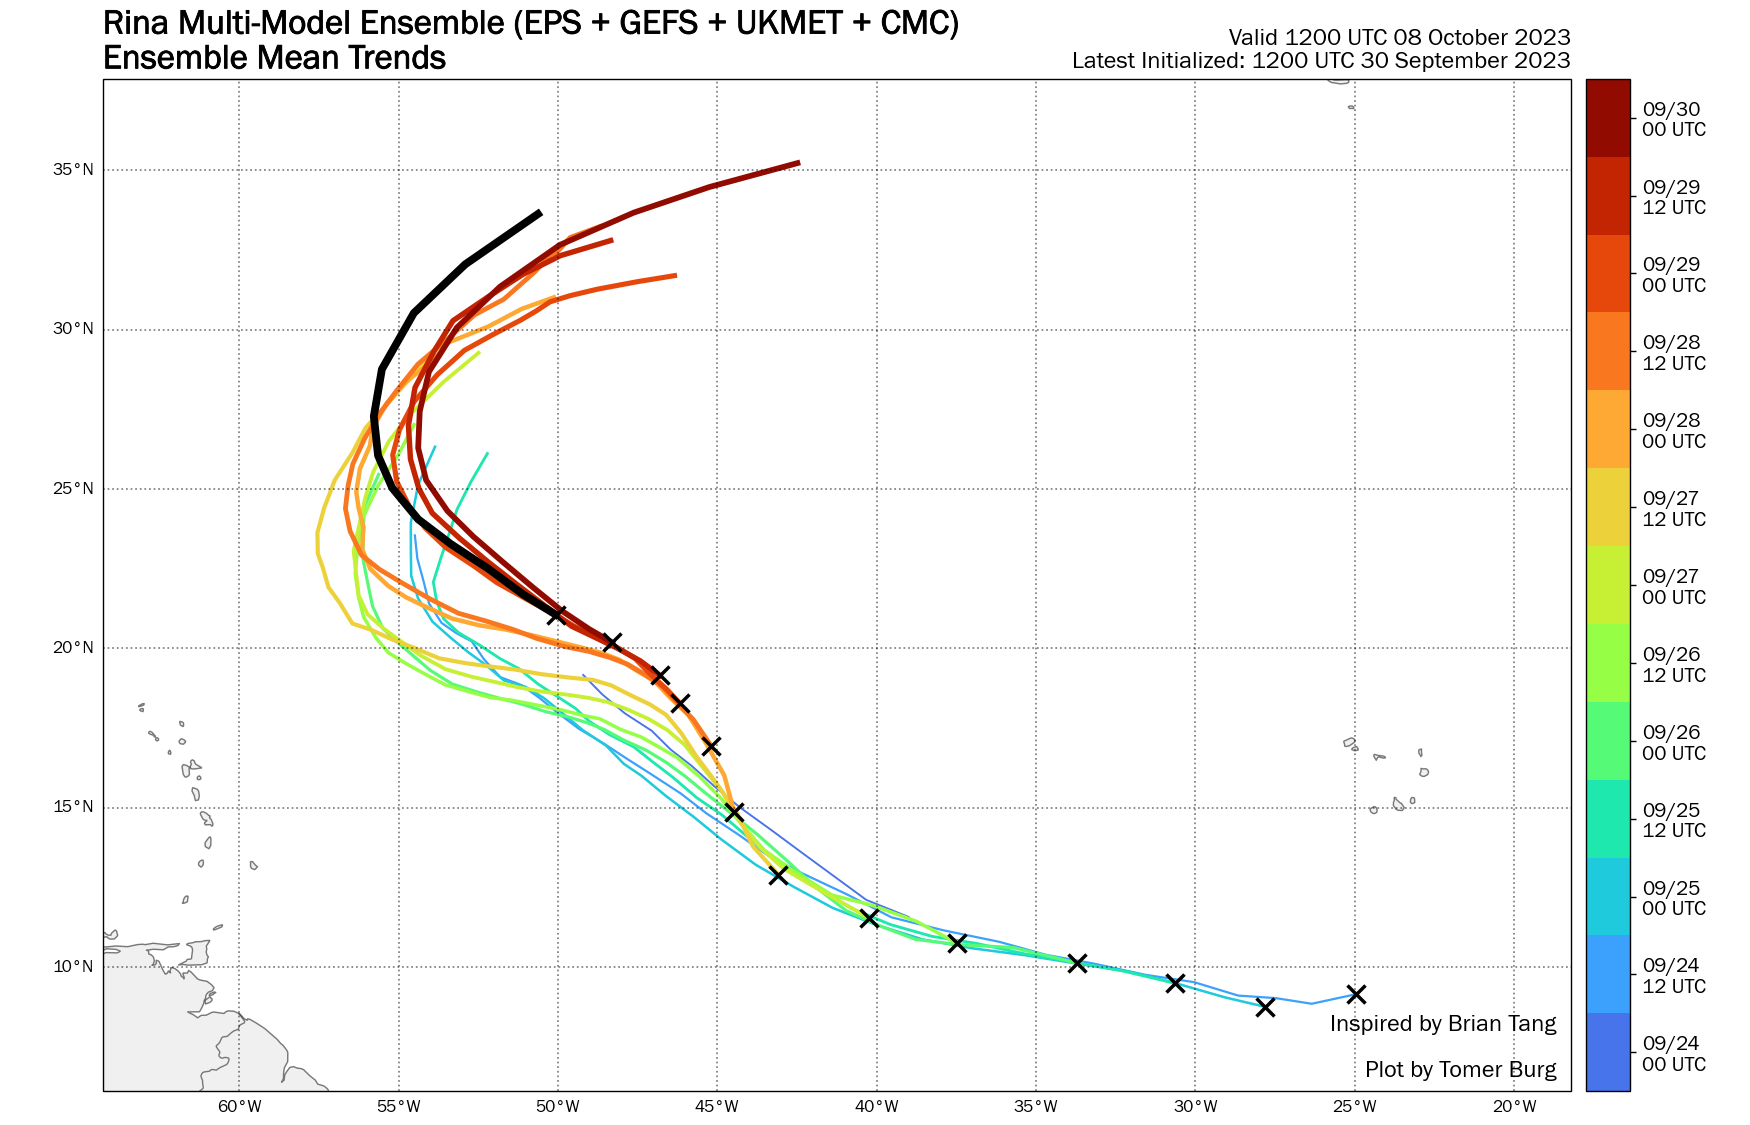
| S | Tropical Storm Rina | 45 kt | 999 hPa | 06z 09/28 | 12z 10/01 | 2.2 |
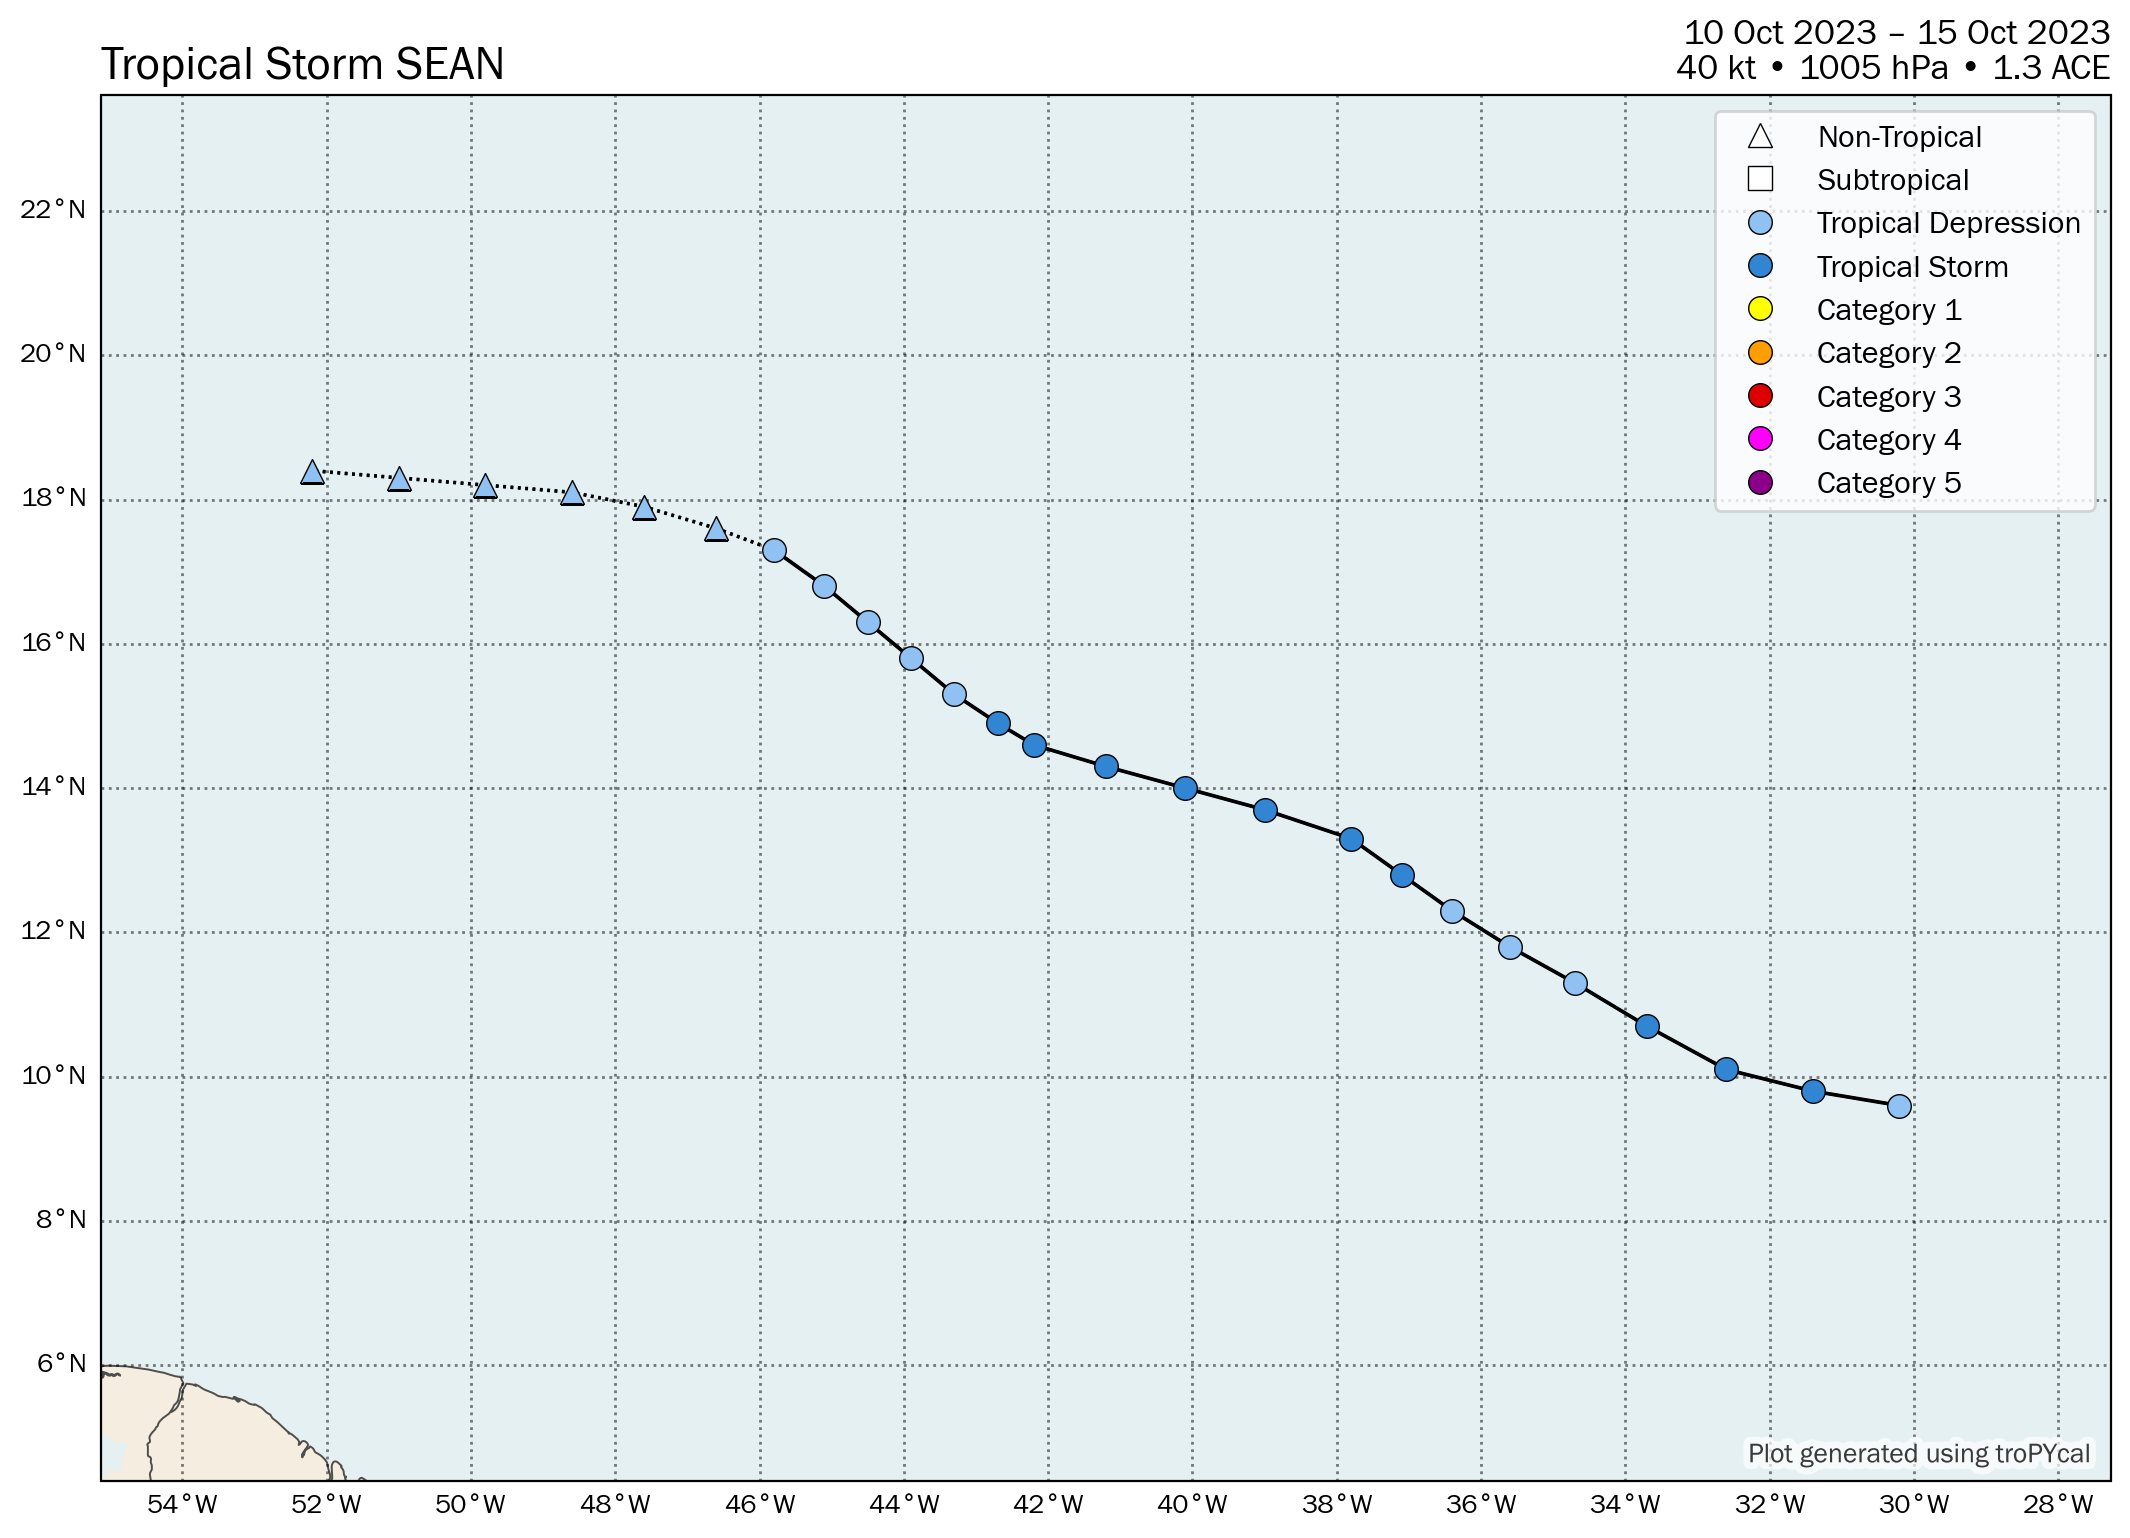
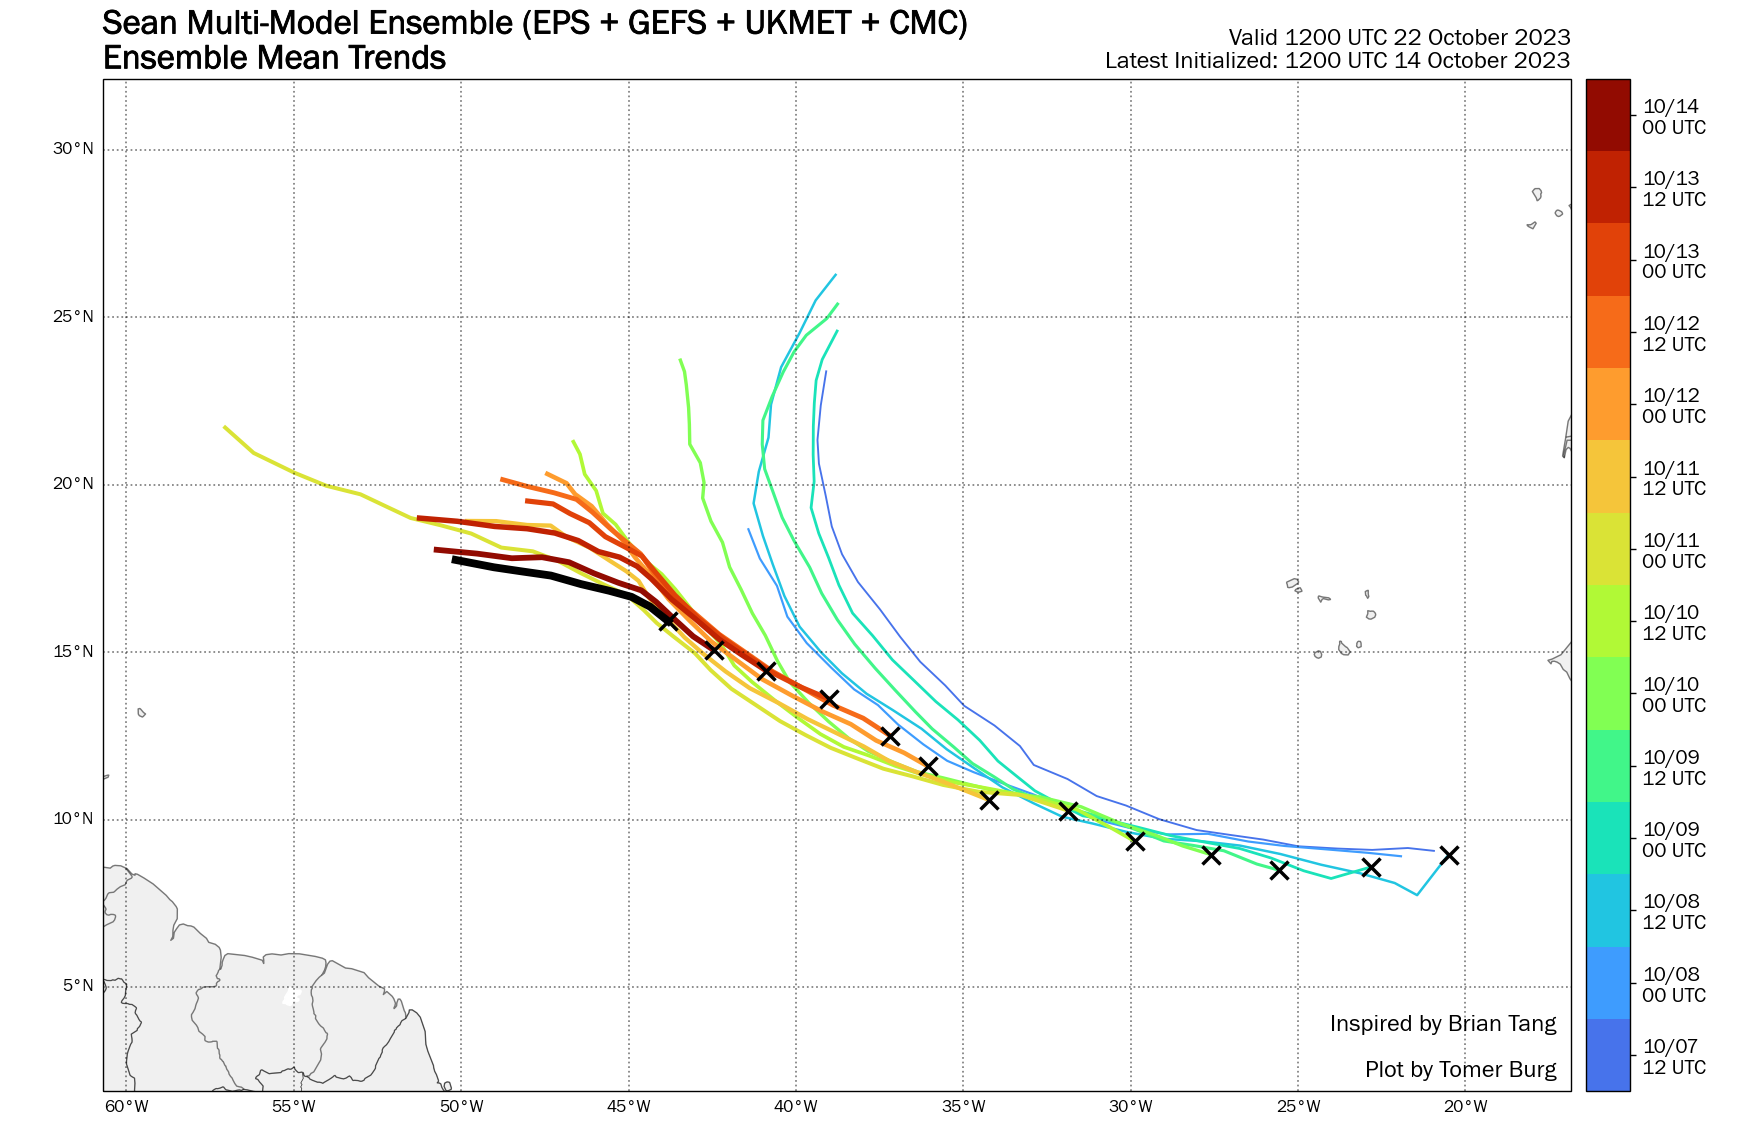
| S | Tropical Storm Sean | 40 kt | 1005 hPa | 18z 10/10 | 06z 10/15 | 1.3 |
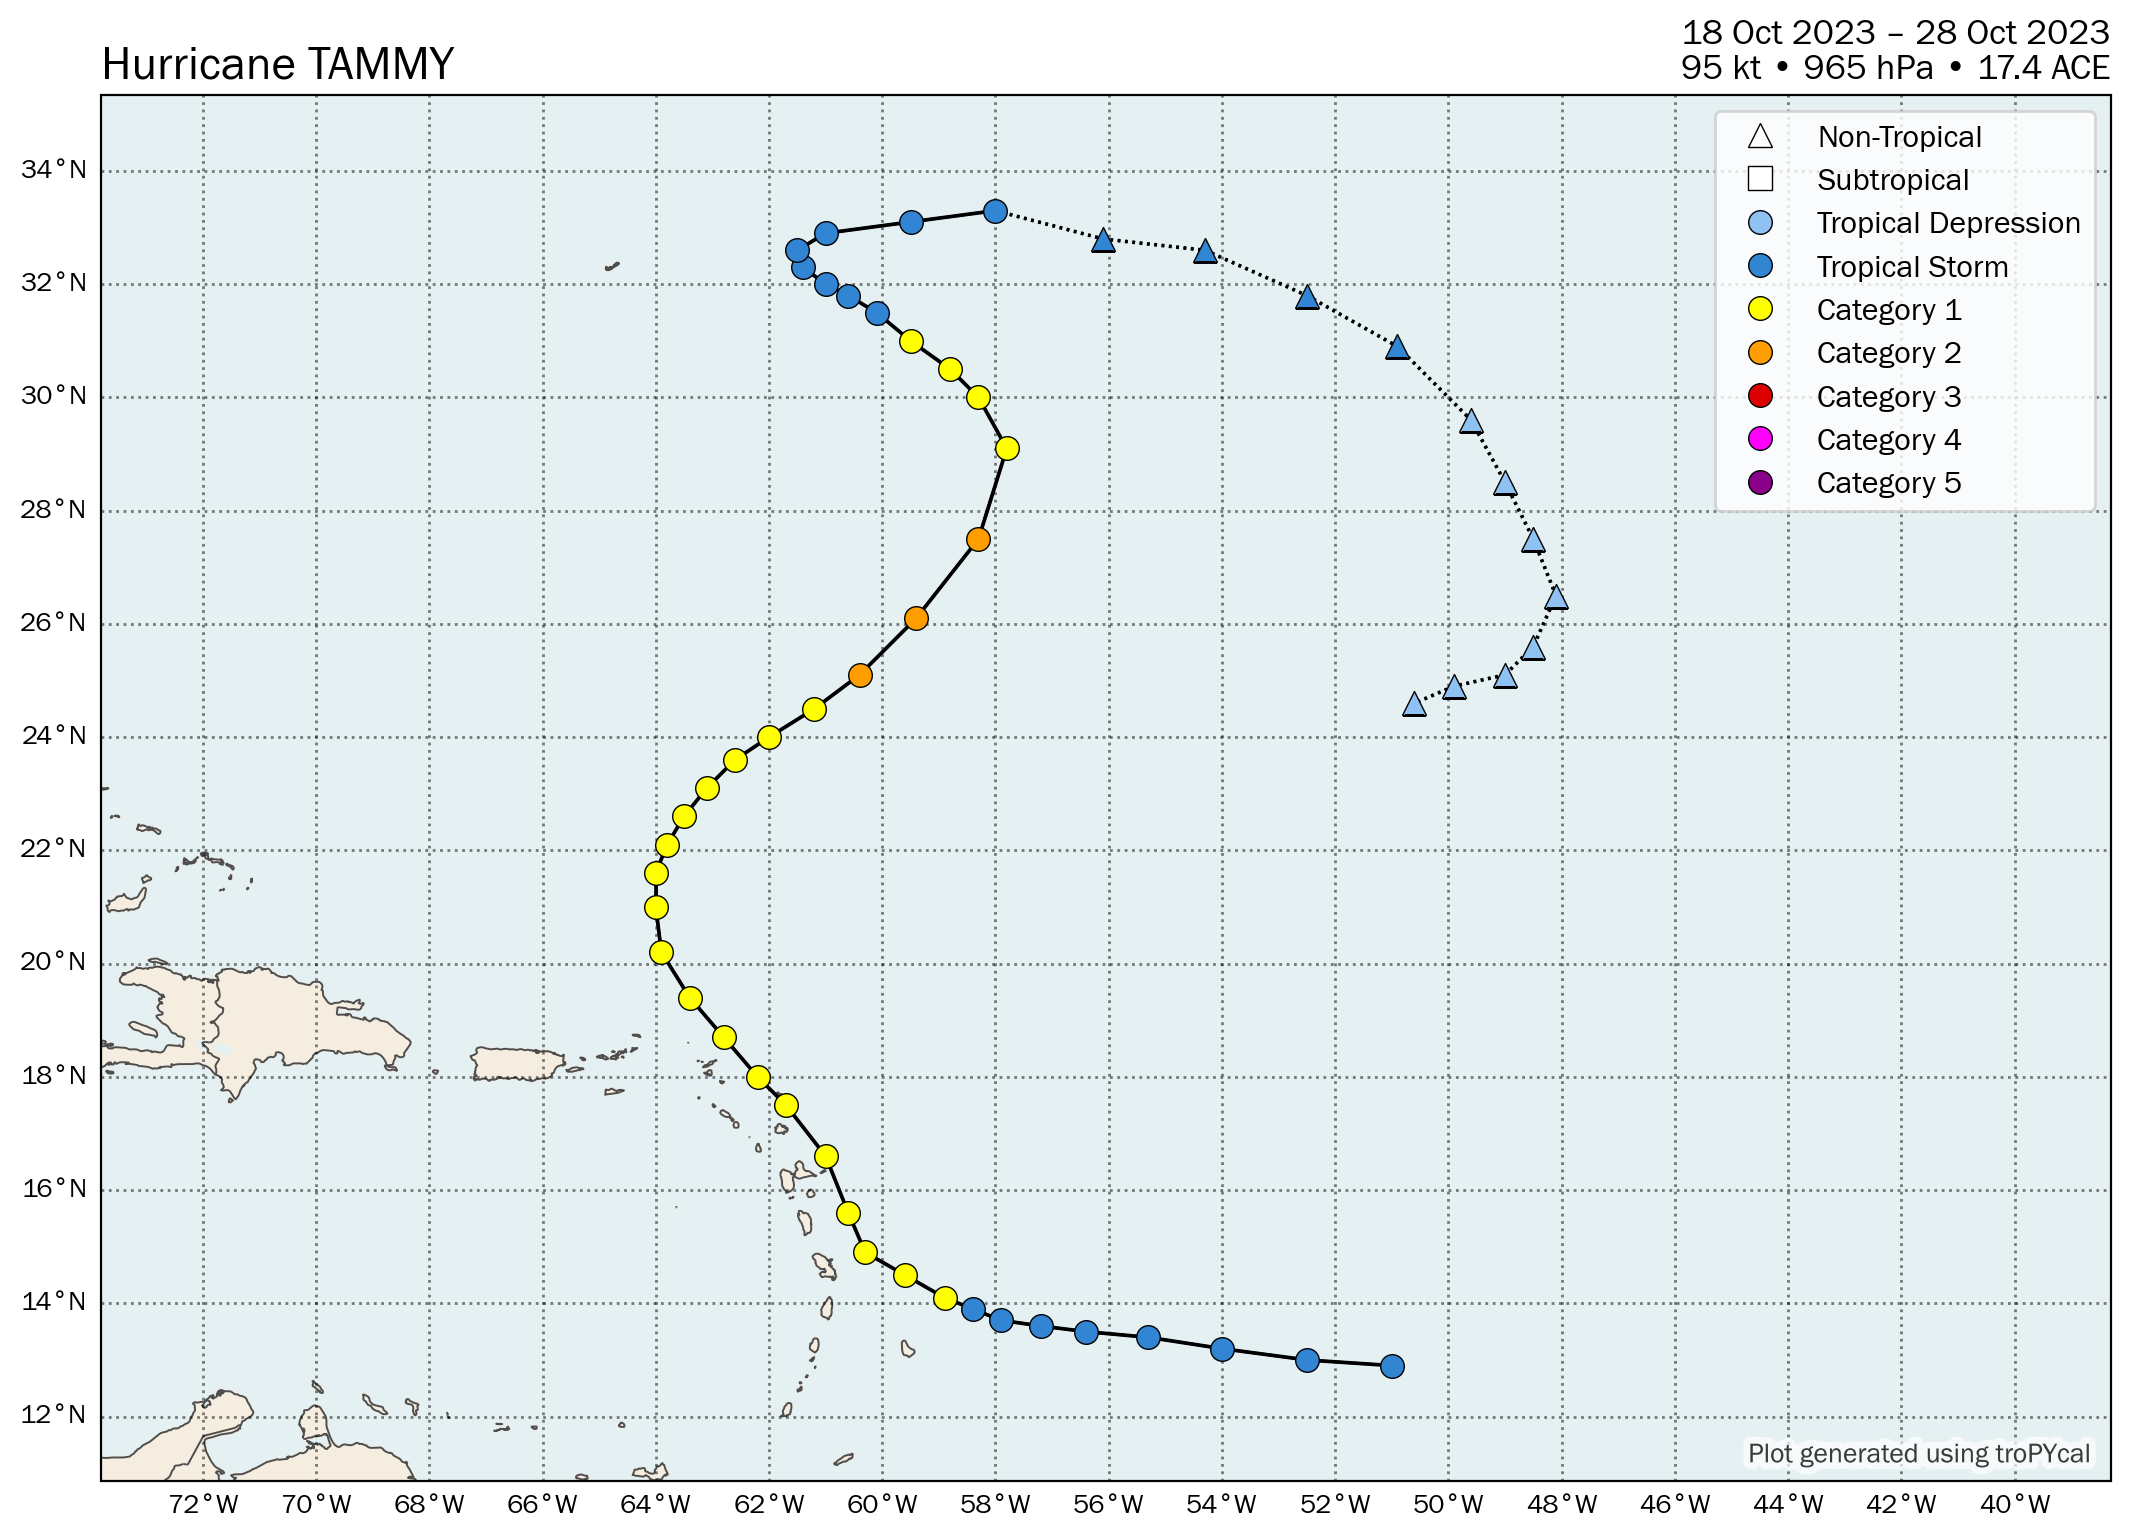
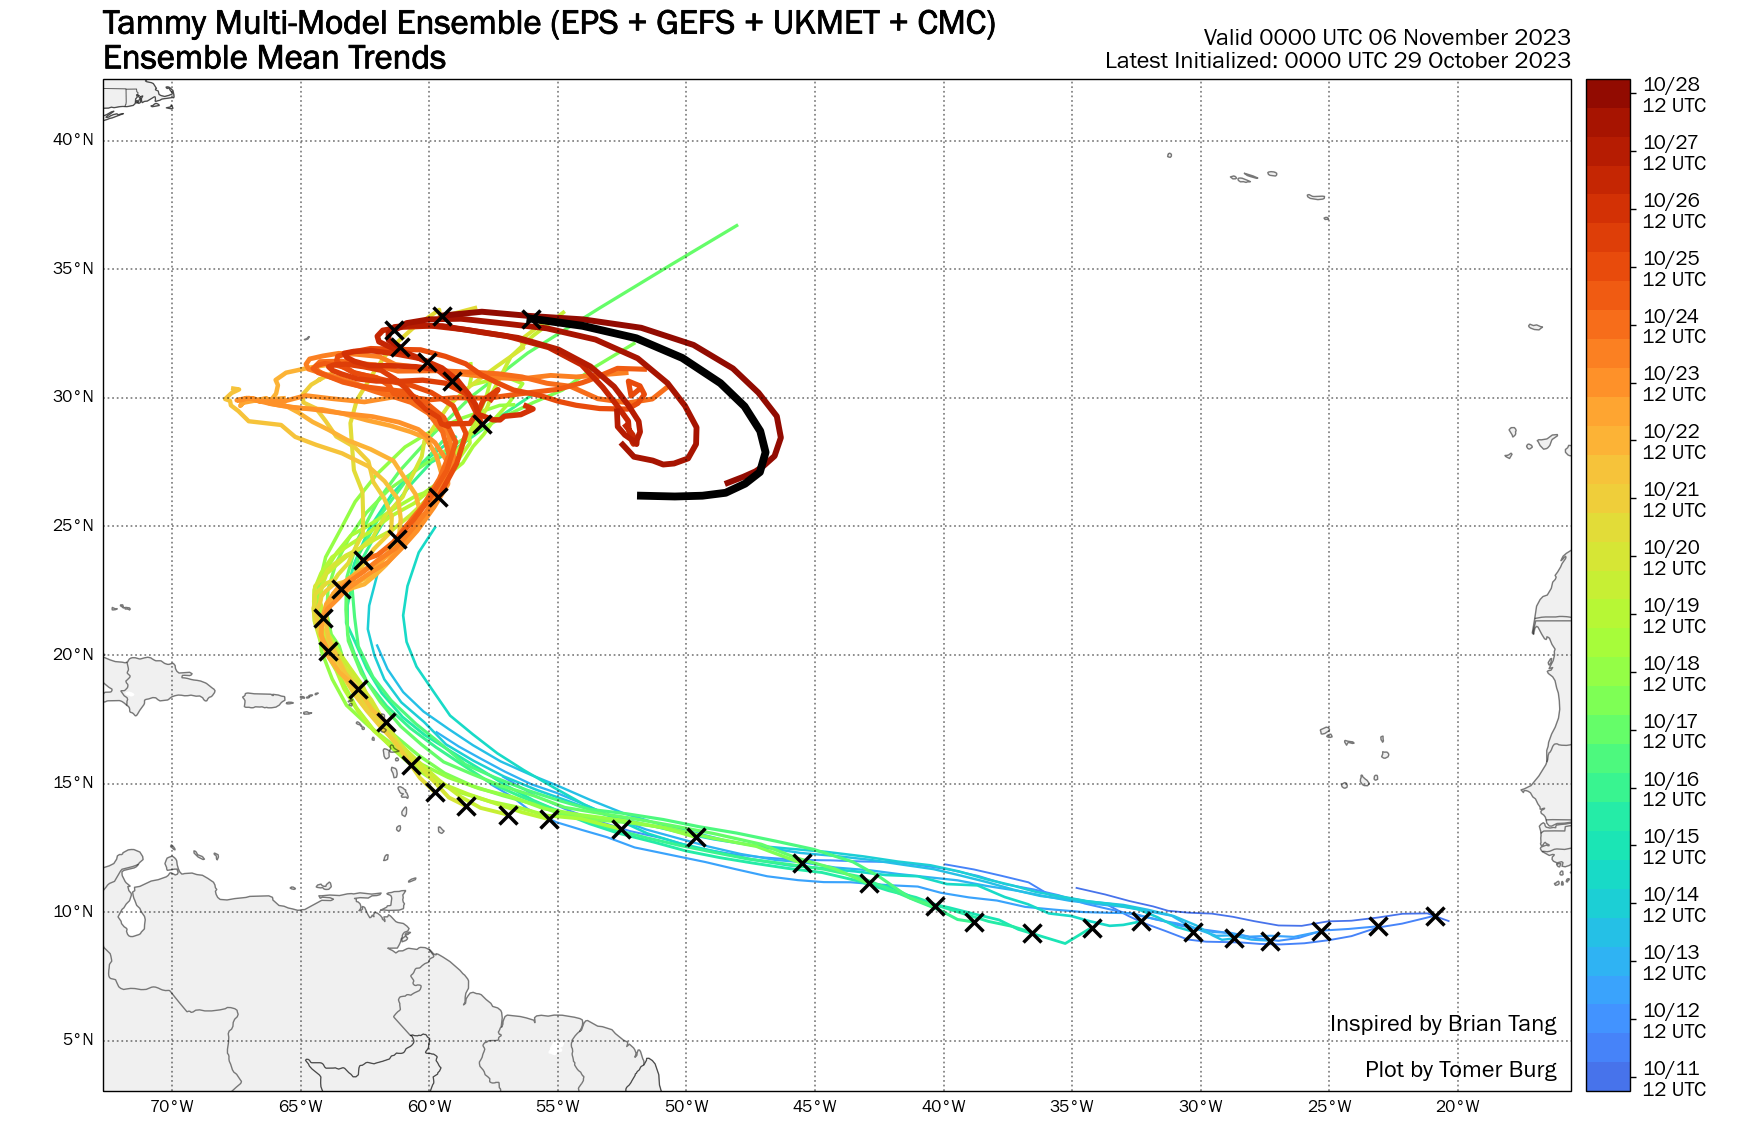
| 2 | Hurricane Tammy | 95 kt | 965 hPa | 18z 10/18 | 18z 10/28 | 17.4 |
| D | Tropical Depression Twenty-One | 25 kt | 1007 hPa | 12z 10/23 | 06z 10/24 | 0.0 |
| Time (UTC) | Lat | Lon | Wind (mph) | Pressure | Storm Type | Category |
|---|---|---|---|---|---|---|
| 0000 UTC 15 Jan | 36.4 | -71.3 | 50 | 989 | Disturbance | - |
| 0600 UTC 15 Jan | 36.8 | -70.6 | 50 | 986 | Disturbance | - |
| 1200 UTC 15 Jan | 37.2 | -69.7 | 50 | 986 | Disturbance | - |
| 1800 UTC 15 Jan | 37.4 | -68.8 | 50 | 983 | Disturbance | - |
| 0000 UTC 16 Jan | 37.5 | -68.3 | 50 | 983 | Disturbance | - |
| 0600 UTC 16 Jan | 37.3 | -67.6 | 60 | 982 | Disturbance | - |
| 1200 UTC 16 Jan | 37.1 | -66.1 | 60 | 982 | Subtropical Storm | - |
| 1800 UTC 16 Jan | 37.6 | -63.6 | 65 | 980 | Subtropical Storm | - |
| 0000 UTC 17 Jan | 39.8 | -61.6 | 70 | 976 | Subtropical Storm | - |
| 0600 UTC 17 Jan | 42.4 | -60.6 | 65 | 977 | Subtropical Storm | - |
| 1200 UTC 17 Jan | 45.5 | -60.0 | 50 | 981 | Subtropical Storm | - |
| 1245 UTC 17 Jan | 45.9 | -60.0 | 50 | 983 | Subtropical Storm | - |
| 1800 UTC 17 Jan | 48.4 | -60.2 | 45 | 988 | Remnant Low | - |
| 0000 UTC 18 Jan | 50.4 | -60.2 | 40 | 991 | Remnant Low | - |
| 0600 UTC 18 Jan | 51.4 | -60.2 | 35 | 994 | Remnant Low | - |
Summary Plot
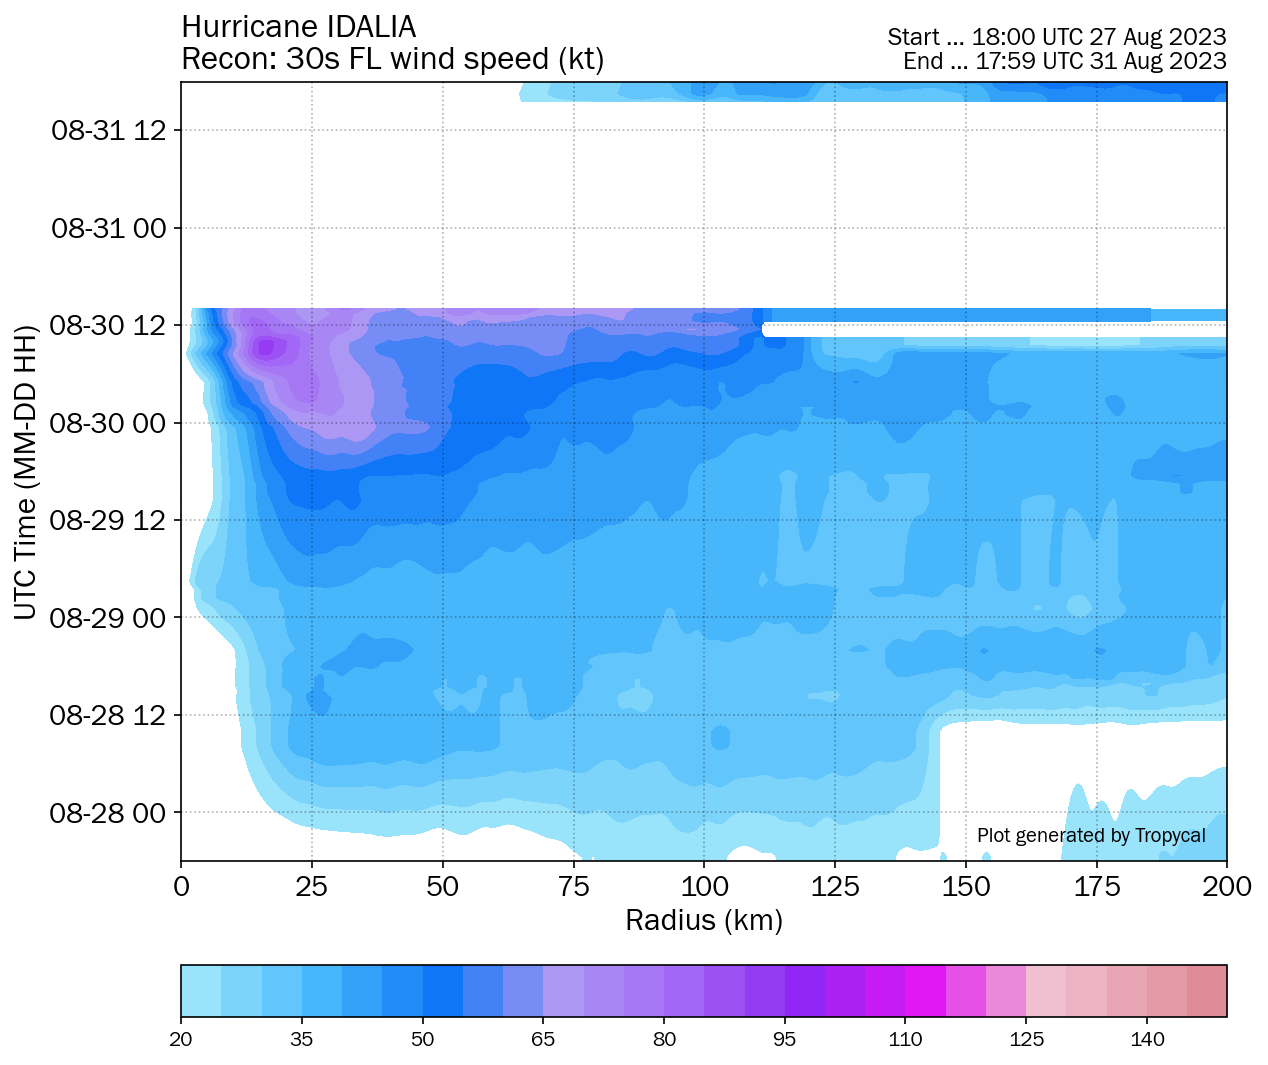
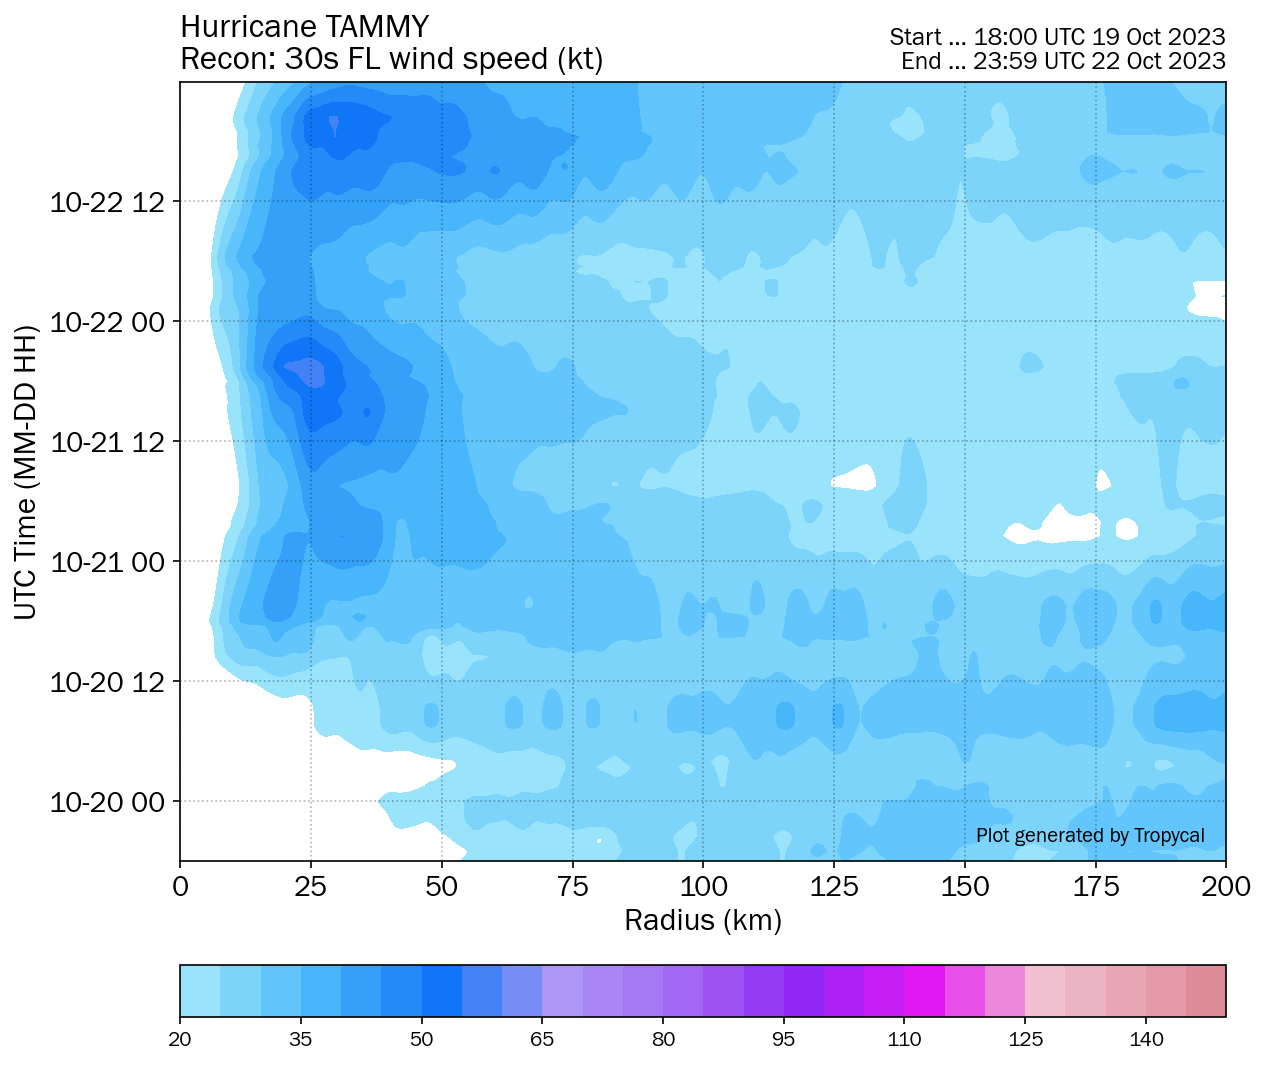
Recon-Derived Hovmoller
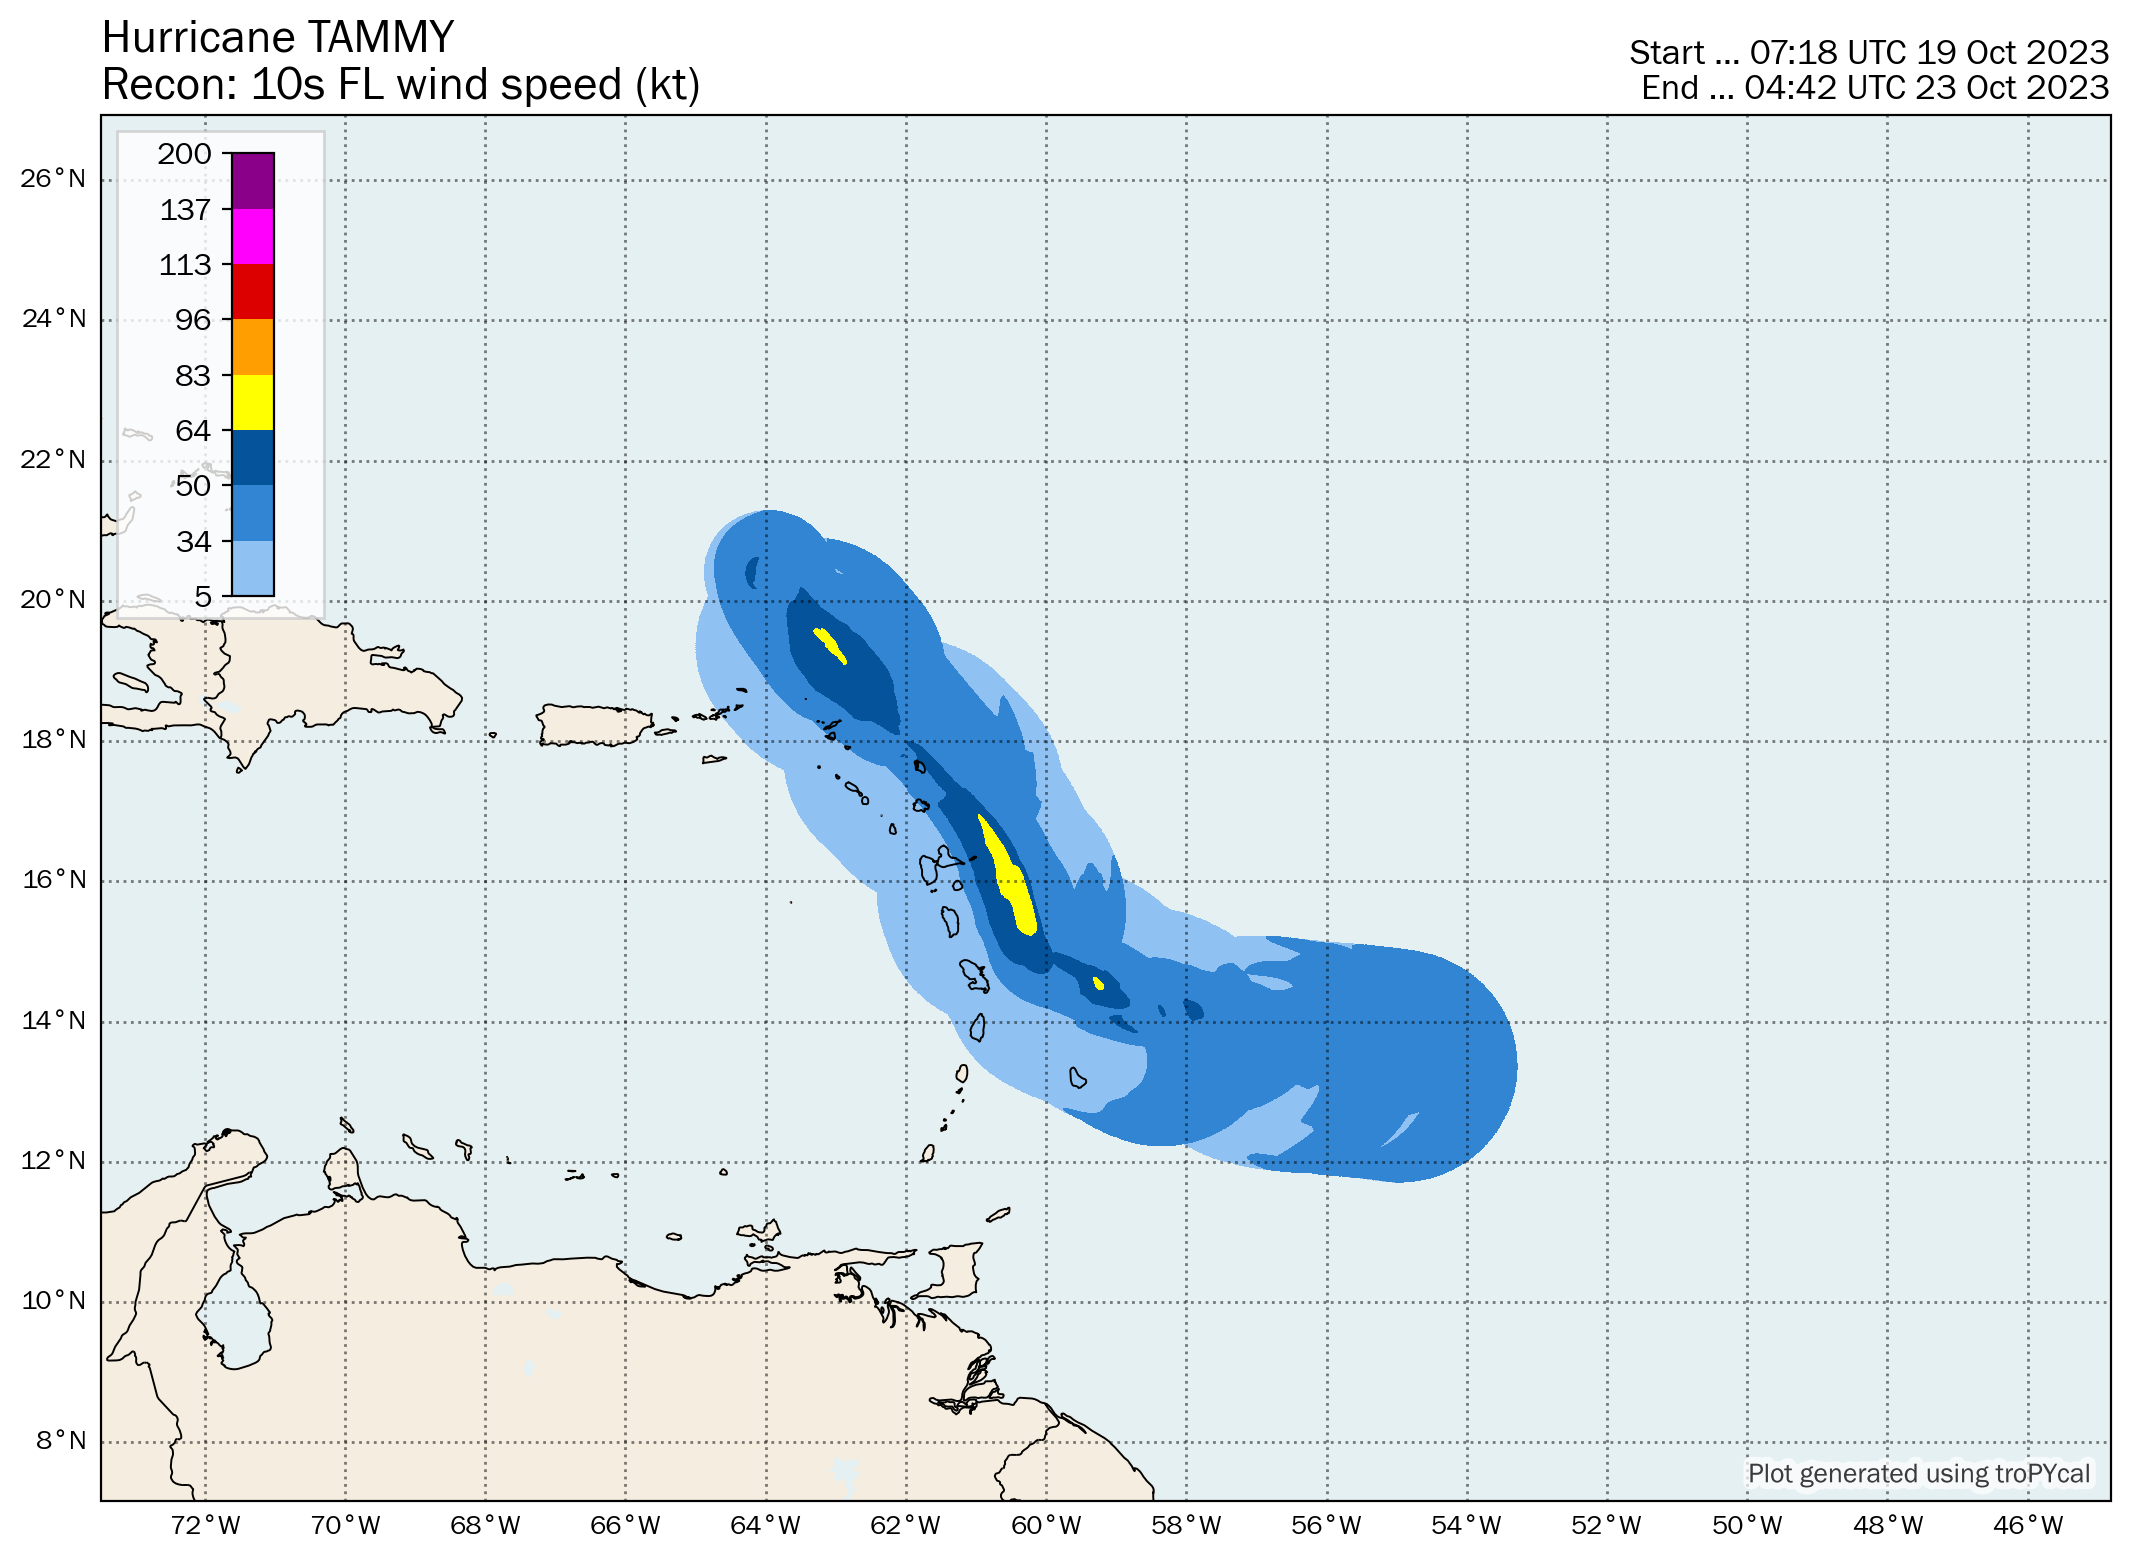
Recon-Derived Wind Swath
Recon-Derived MSLP Swath
| Time (UTC) | Lat | Lon | Wind (mph) | Pressure | Storm Type | Category |
|---|---|---|---|---|---|---|
| 1800 UTC 31 May | 26.4 | -85.9 | 25 | 1009 | Disturbance | - |
| 0000 UTC 01 Jun | 26.7 | -85.7 | 25 | 1008 | Disturbance | - |
| 0600 UTC 01 Jun | 27.2 | -85.8 | 30 | 1008 | Disturbance | - |
| 1200 UTC 01 Jun | 27.7 | -86.2 | 35 | 1007 | Tropical Depression | - |
| 1800 UTC 01 Jun | 28.0 | -86.5 | 35 | 1007 | Tropical Depression | - |
| 0000 UTC 02 Jun | 27.7 | -86.5 | 35 | 1006 | Tropical Depression | - |
| 0600 UTC 02 Jun | 27.3 | -86.4 | 40 | 1004 | Tropical Storm | - |
| 1200 UTC 02 Jun | 27.0 | -86.3 | 40 | 1002 | Tropical Storm | - |
| 1800 UTC 02 Jun | 26.7 | -86.0 | 40 | 1000 | Tropical Storm | - |
| 0000 UTC 03 Jun | 25.9 | -85.7 | 40 | 998 | Tropical Storm | - |
| 0600 UTC 03 Jun | 25.0 | -85.6 | 35 | 999 | Tropical Depression | - |
| 1200 UTC 03 Jun | 24.4 | -85.3 | 30 | 1000 | Remnant Low | - |
| 1800 UTC 03 Jun | 23.9 | -85.0 | 30 | 1001 | Remnant Low | - |
| 0000 UTC 04 Jun | 23.5 | -84.1 | 30 | 1002 | Remnant Low | - |
| 0600 UTC 04 Jun | 23.3 | -83.0 | 30 | 1002 | Remnant Low | - |
Ensemble Viewer (Click image for loop)
Summary Plot
Recon-Derived Hovmoller
Recon-Derived Wind Swath
Recon-Derived MSLP Swath
| Time (UTC) | Lat | Lon | Wind (mph) | Pressure | Storm Type | Category |
|---|---|---|---|---|---|---|
| 0600 UTC 19 Jun | 10.7 | -37.3 | 35 | 1009 | Tropical Depression | - |
| 1200 UTC 19 Jun | 10.9 | -39.1 | 35 | 1009 | Tropical Depression | - |
| 1800 UTC 19 Jun | 11.1 | -40.9 | 40 | 1008 | Tropical Storm | - |
| 0000 UTC 20 Jun | 11.3 | -42.7 | 40 | 1008 | Tropical Storm | - |
| 0600 UTC 20 Jun | 11.5 | -44.5 | 40 | 1008 | Tropical Storm | - |
| 1200 UTC 20 Jun | 11.7 | -46.3 | 40 | 1008 | Tropical Storm | - |
| 1800 UTC 20 Jun | 12.0 | -48.0 | 45 | 1006 | Tropical Storm | - |
| 0000 UTC 21 Jun | 12.4 | -49.4 | 50 | 1004 | Tropical Storm | - |
| 0600 UTC 21 Jun | 12.7 | -50.7 | 60 | 1001 | Tropical Storm | - |
| 1200 UTC 21 Jun | 13.0 | -52.0 | 60 | 1001 | Tropical Storm | - |
| 1800 UTC 21 Jun | 13.3 | -53.3 | 65 | 1000 | Tropical Storm | - |
| 0000 UTC 22 Jun | 13.4 | -54.6 | 65 | 999 | Tropical Storm | - |
| 0600 UTC 22 Jun | 13.5 | -55.9 | 70 | 996 | Tropical Storm | - |
| 1200 UTC 22 Jun | 13.5 | -57.3 | 70 | 998 | Tropical Storm | - |
| 1800 UTC 22 Jun | 13.4 | -58.8 | 65 | 1000 | Tropical Storm | - |
| 0000 UTC 23 Jun | 13.3 | -60.3 | 65 | 1001 | Tropical Storm | - |
| 0315 UTC 23 Jun | 13.3 | -61.2 | 65 | 1001 | Tropical Storm | - |
| 0600 UTC 23 Jun | 13.3 | -62.0 | 60 | 1001 | Tropical Storm | - |
| 1200 UTC 23 Jun | 13.2 | -63.8 | 60 | 1002 | Tropical Storm | - |
| 1800 UTC 23 Jun | 13.1 | -65.6 | 50 | 1003 | Tropical Storm | - |
| 0000 UTC 24 Jun | 13.0 | -67.4 | 50 | 1004 | Tropical Storm | - |
| 0600 UTC 24 Jun | 13.0 | -69.2 | 45 | 1005 | Tropical Storm | - |
| 1200 UTC 24 Jun | 13.0 | -70.9 | 45 | 1007 | Tropical Storm | - |
Ensemble Viewer (Click image for loop)
Summary Plot
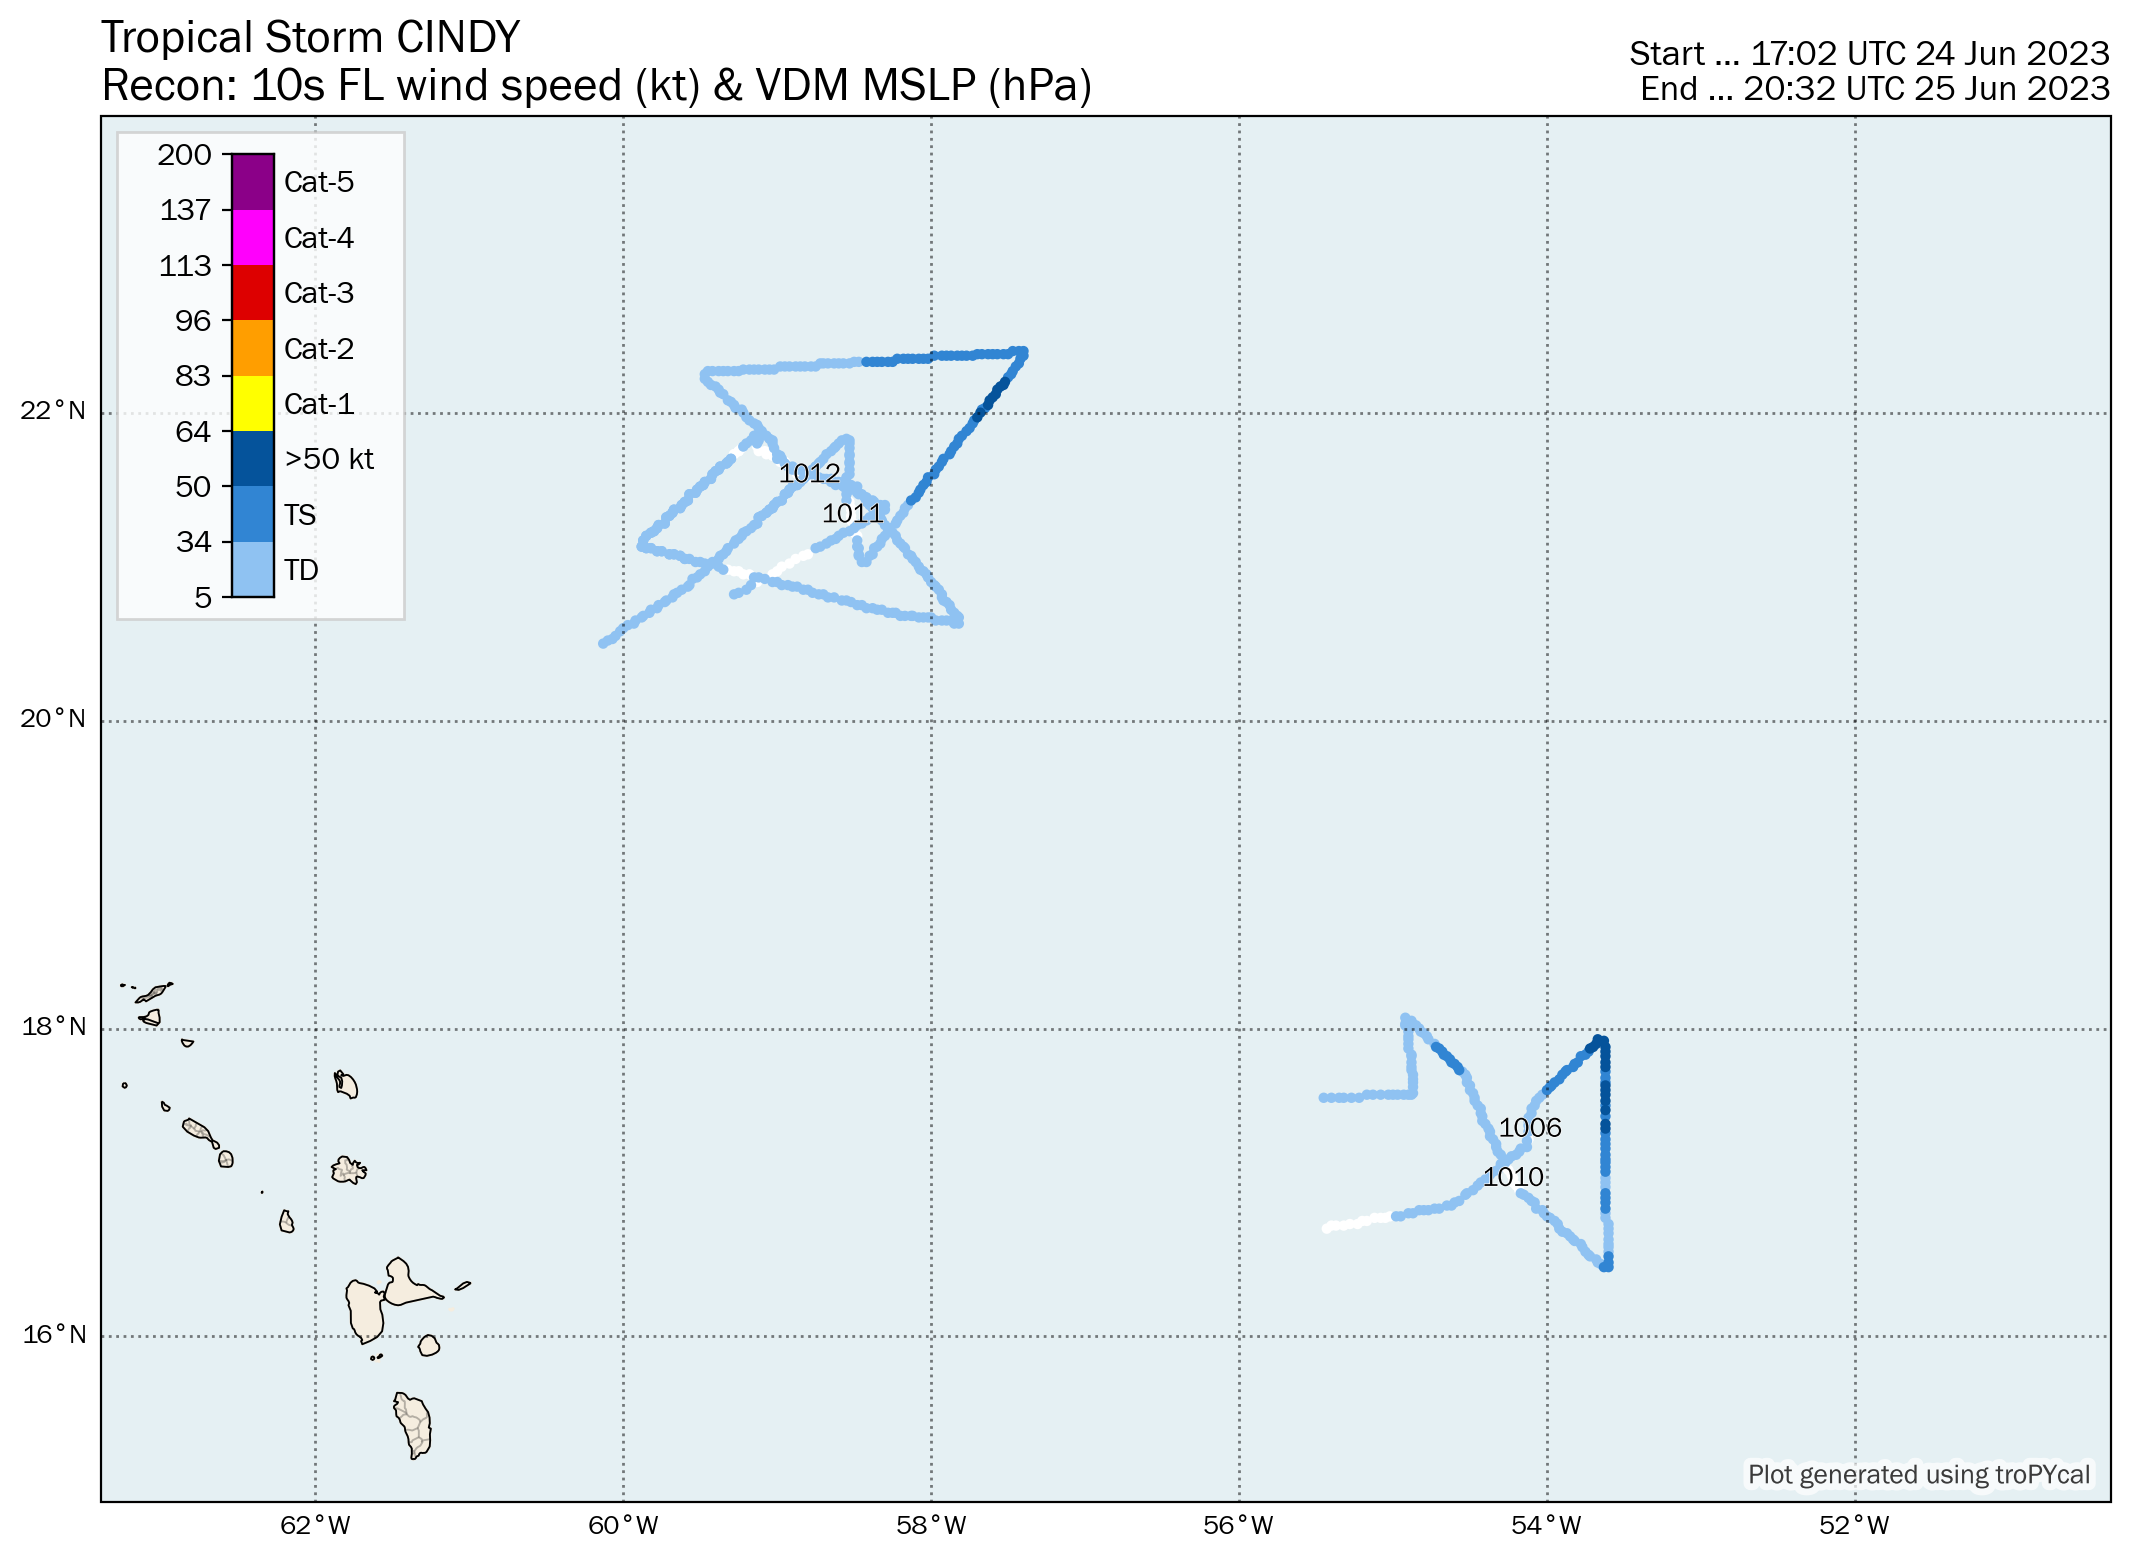
Recon-Derived Wind Swath
Recon-Derived MSLP Swath
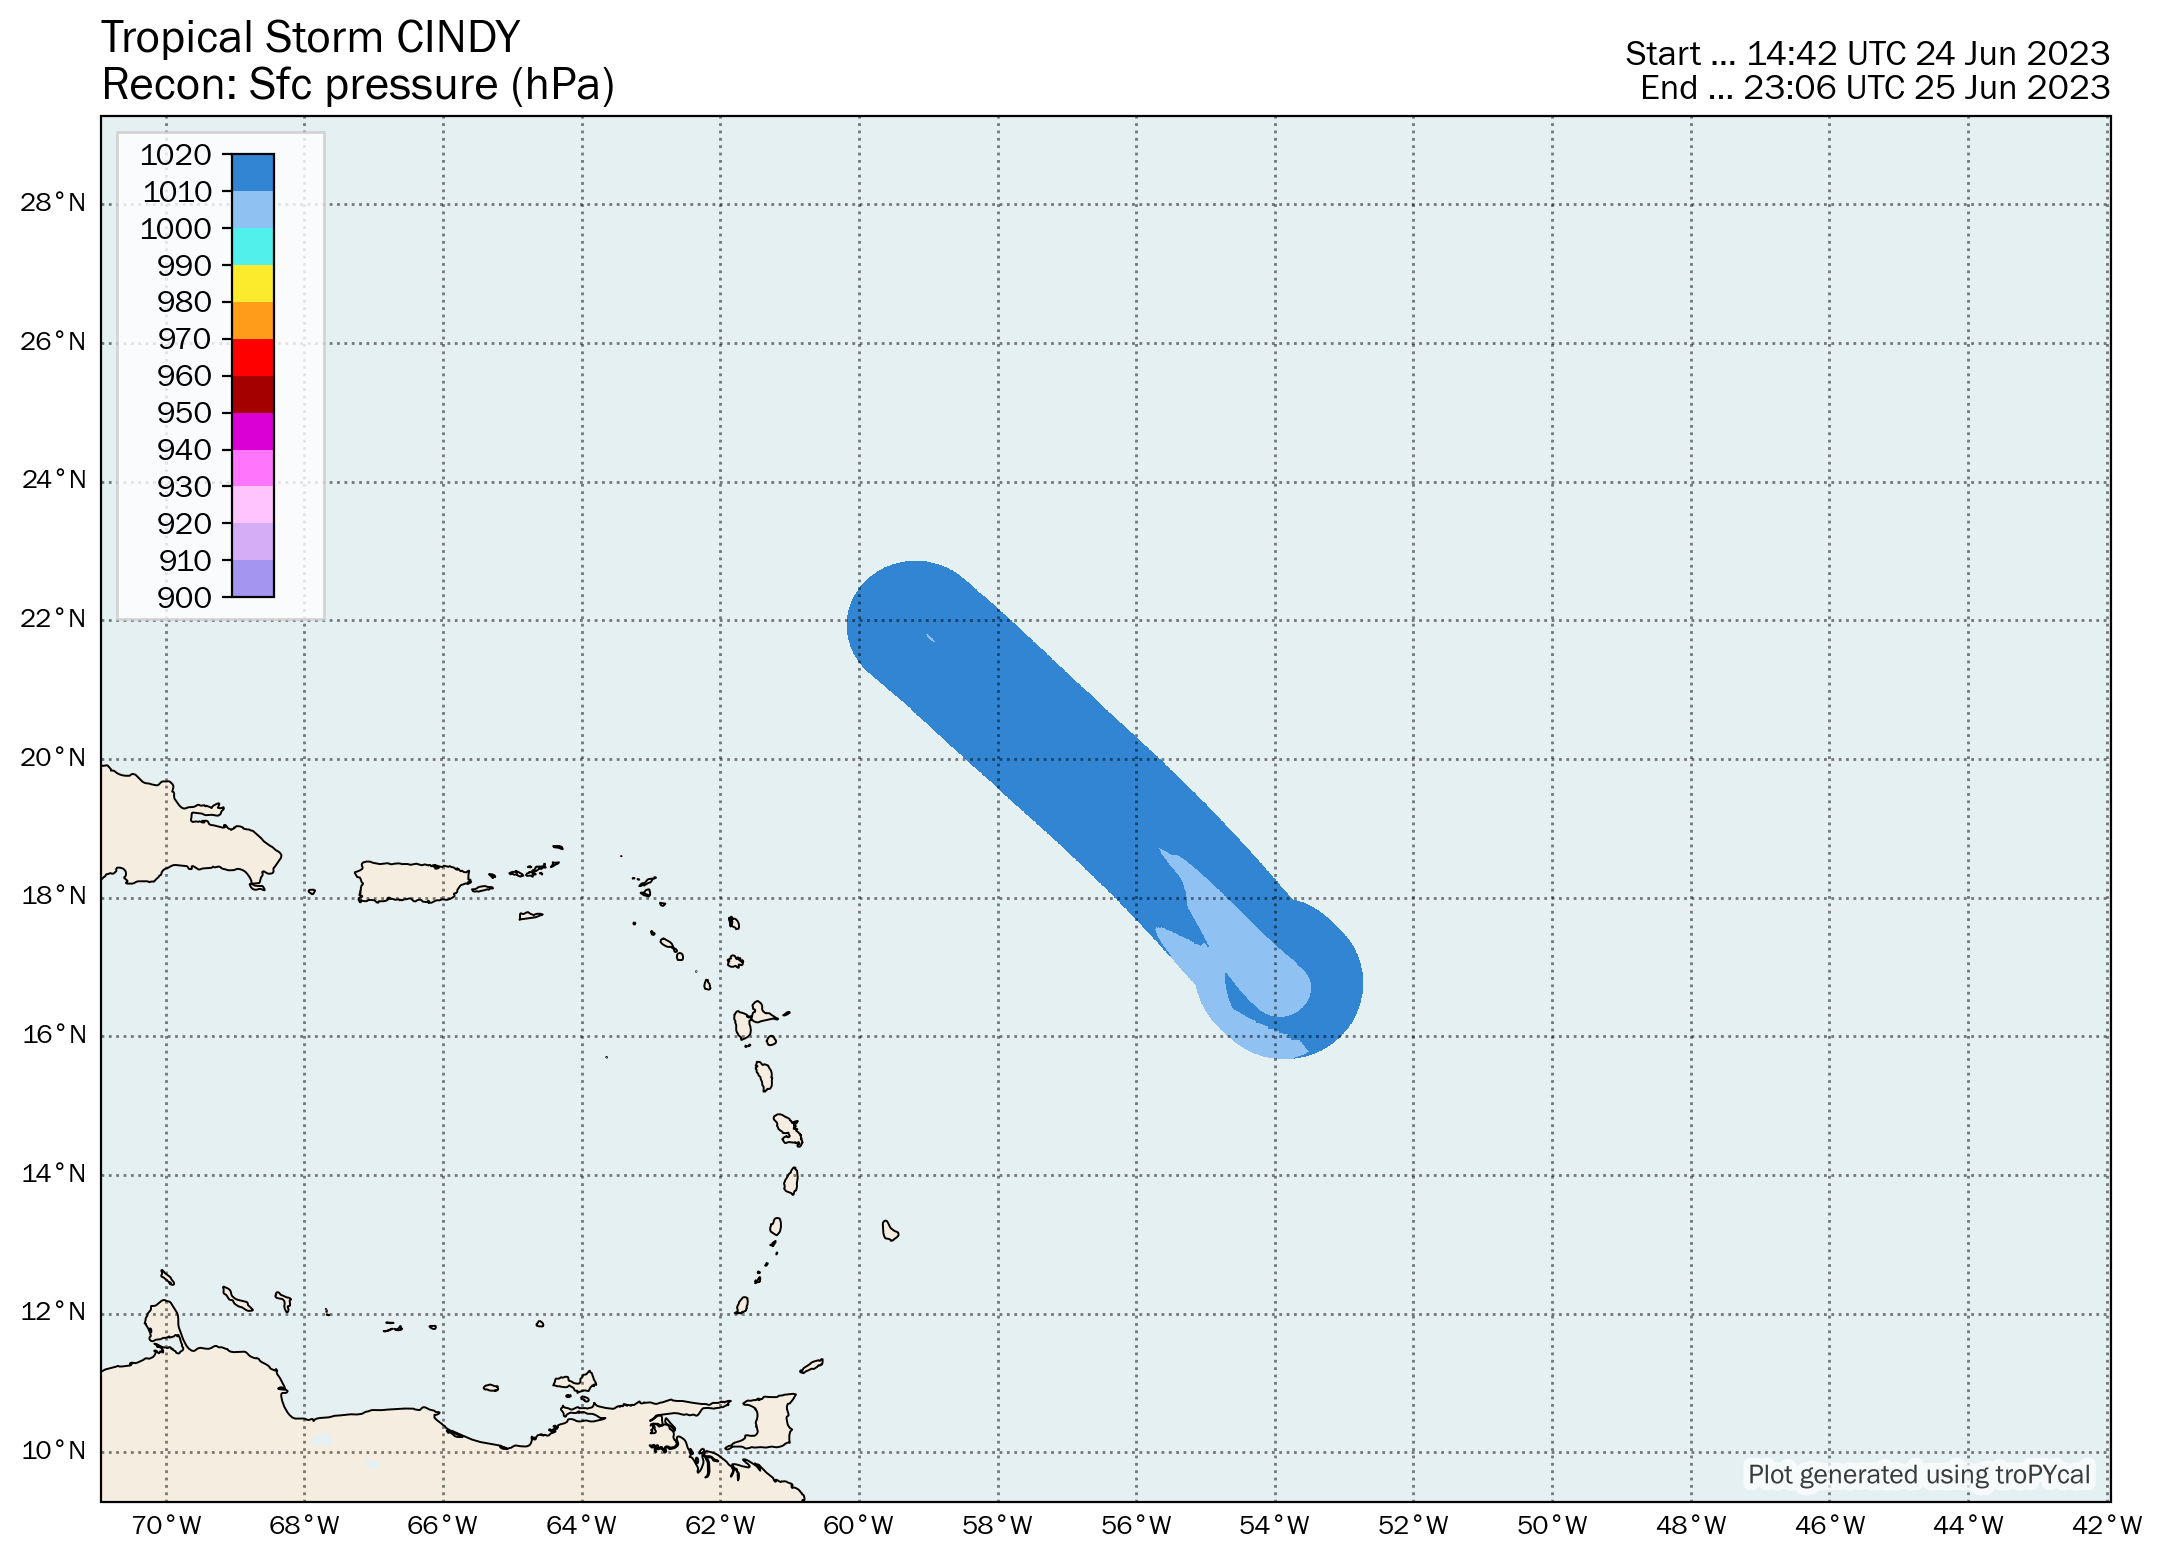
| Time (UTC) | Lat | Lon | Wind (mph) | Pressure | Storm Type | Category |
|---|---|---|---|---|---|---|
| 0000 UTC 22 Jun | 10.4 | -39.9 | 35 | 1008 | Tropical Depression | - |
| 0600 UTC 22 Jun | 10.7 | -41.1 | 35 | 1008 | Tropical Depression | - |
| 1200 UTC 22 Jun | 11.0 | -42.3 | 35 | 1008 | Tropical Depression | - |
| 1800 UTC 22 Jun | 11.3 | -43.5 | 35 | 1008 | Tropical Depression | - |
| 0000 UTC 23 Jun | 11.5 | -44.8 | 40 | 1007 | Tropical Storm | - |
| 0600 UTC 23 Jun | 11.8 | -46.1 | 45 | 1006 | Tropical Storm | - |
| 1200 UTC 23 Jun | 12.2 | -47.5 | 50 | 1005 | Tropical Storm | - |
| 1800 UTC 23 Jun | 12.8 | -48.8 | 50 | 1005 | Tropical Storm | - |
| 0000 UTC 24 Jun | 13.6 | -50.0 | 50 | 1005 | Tropical Storm | - |
| 0600 UTC 24 Jun | 14.6 | -51.2 | 60 | 1004 | Tropical Storm | - |
| 1200 UTC 24 Jun | 15.7 | -52.5 | 60 | 1004 | Tropical Storm | - |
| 1800 UTC 24 Jun | 16.8 | -53.9 | 60 | 1005 | Tropical Storm | - |
| 0000 UTC 25 Jun | 18.2 | -55.2 | 50 | 1006 | Tropical Storm | - |
| 0600 UTC 25 Jun | 19.4 | -56.4 | 50 | 1007 | Tropical Storm | - |
| 1200 UTC 25 Jun | 20.5 | -57.6 | 45 | 1009 | Tropical Storm | - |
| 1800 UTC 25 Jun | 21.6 | -58.8 | 45 | 1010 | Tropical Storm | - |
| 0000 UTC 26 Jun | 22.5 | -59.9 | 40 | 1011 | Tropical Storm | - |
Ensemble Viewer (Click image for loop)
| Time (UTC) | Lat | Lon | Wind (mph) | Pressure | Storm Type | Category |
|---|---|---|---|---|---|---|
| 1200 UTC 11 Jul | 36.5 | -55.5 | 30 | 1013 | Disturbance | - |
| 1800 UTC 11 Jul | 36.6 | -55.0 | 30 | 1013 | Disturbance | - |
| 0000 UTC 12 Jul | 36.2 | -54.4 | 30 | 1011 | Disturbance | - |
| 0600 UTC 12 Jul | 35.3 | -53.6 | 30 | 1009 | Disturbance | - |
| 1200 UTC 12 Jul | 34.0 | -52.6 | 30 | 1009 | Disturbance | - |
| 1800 UTC 12 Jul | 32.9 | -51.9 | 35 | 1008 | Disturbance | - |
| 0000 UTC 13 Jul | 32.0 | -51.0 | 35 | 1007 | Disturbance | - |
| 0600 UTC 13 Jul | 31.3 | -50.2 | 35 | 1006 | Disturbance | - |
| 1200 UTC 13 Jul | 31.2 | -48.7 | 40 | 1004 | Disturbance | - |
| 1800 UTC 13 Jul | 31.7 | -47.3 | 45 | 1003 | Disturbance | - |
| 0000 UTC 14 Jul | 32.5 | -46.7 | 50 | 1002 | Subtropical Storm | - |
| 0600 UTC 14 Jul | 32.9 | -46.8 | 50 | 1002 | Subtropical Storm | - |
| 1200 UTC 14 Jul | 33.4 | -47.0 | 45 | 1004 | Subtropical Storm | - |
| 1800 UTC 14 Jul | 33.8 | -47.2 | 45 | 1004 | Subtropical Storm | - |
| 0000 UTC 15 Jul | 34.3 | -47.2 | 45 | 1004 | Subtropical Storm | - |
| 0600 UTC 15 Jul | 35.3 | -47.7 | 45 | 1005 | Subtropical Storm | - |
| 1200 UTC 15 Jul | 36.2 | -48.4 | 45 | 1006 | Subtropical Storm | - |
| 1800 UTC 15 Jul | 37.1 | -48.7 | 40 | 1007 | Subtropical Storm | - |
| 0000 UTC 16 Jul | 37.8 | -48.8 | 40 | 1007 | Subtropical Storm | - |
| 0600 UTC 16 Jul | 38.4 | -48.7 | 40 | 1007 | Subtropical Storm | - |
| 1200 UTC 16 Jul | 38.9 | -48.5 | 35 | 1009 | Subtropical Depression | - |
| 1800 UTC 16 Jul | 39.4 | -47.5 | 35 | 1010 | Subtropical Depression | - |
| 0000 UTC 17 Jul | 39.5 | -46.4 | 35 | 1010 | Subtropical Depression | - |
| 0600 UTC 17 Jul | 39.3 | -45.0 | 35 | 1010 | Tropical Depression | - |
| 1200 UTC 17 Jul | 38.9 | -43.6 | 35 | 1010 | Tropical Depression | - |
| 1800 UTC 17 Jul | 38.4 | -42.2 | 35 | 1010 | Tropical Depression | - |
| 0000 UTC 18 Jul | 37.8 | -40.9 | 40 | 1008 | Tropical Storm | - |
| 0600 UTC 18 Jul | 36.8 | -39.9 | 40 | 1008 | Tropical Storm | - |
| 1200 UTC 18 Jul | 36.0 | -39.4 | 40 | 1008 | Tropical Storm | - |
| 1800 UTC 18 Jul | 35.3 | -39.2 | 40 | 1008 | Tropical Storm | - |
| 0000 UTC 19 Jul | 34.6 | -39.1 | 40 | 1008 | Tropical Storm | - |
| 0600 UTC 19 Jul | 34.2 | -39.1 | 40 | 1008 | Tropical Storm | - |
| 1200 UTC 19 Jul | 33.9 | -39.3 | 40 | 1008 | Tropical Storm | - |
| 1800 UTC 19 Jul | 33.8 | -39.9 | 45 | 1005 | Tropical Storm | - |
| 0000 UTC 20 Jul | 33.8 | -40.6 | 50 | 1001 | Tropical Storm | - |
| 0600 UTC 20 Jul | 34.0 | -41.3 | 50 | 1001 | Tropical Storm | - |
| 1200 UTC 20 Jul | 34.3 | -42.2 | 45 | 1004 | Tropical Storm | - |
| 1800 UTC 20 Jul | 34.5 | -43.3 | 45 | 1004 | Tropical Storm | - |
| 0000 UTC 21 Jul | 34.6 | -44.2 | 45 | 1004 | Tropical Storm | - |
| 0600 UTC 21 Jul | 35.0 | -45.1 | 45 | 1004 | Tropical Storm | - |
| 1200 UTC 21 Jul | 35.4 | -46.0 | 50 | 1001 | Tropical Storm | - |
| 1800 UTC 21 Jul | 36.2 | -47.0 | 50 | 1001 | Tropical Storm | - |
| 0000 UTC 22 Jul | 36.9 | -48.2 | 50 | 1001 | Tropical Storm | - |
| 0600 UTC 22 Jul | 37.7 | -49.3 | 50 | 1001 | Tropical Storm | - |
| 1200 UTC 22 Jul | 38.5 | -49.9 | 65 | 995 | Tropical Storm | - |
| 1800 UTC 22 Jul | 39.5 | -50.1 | 75 | 986 | Hurricane | 1 |
| 0000 UTC 23 Jul | 40.7 | -49.9 | 75 | 986 | Hurricane | 1 |
| 0600 UTC 23 Jul | 42.0 | -49.4 | 70 | 989 | Tropical Storm | - |
| 1200 UTC 23 Jul | 43.3 | -48.5 | 65 | 992 | Tropical Storm | - |
| 1800 UTC 23 Jul | 44.7 | -47.3 | 60 | 996 | Tropical Storm | - |
| 0000 UTC 24 Jul | 45.9 | -45.7 | 50 | 1002 | Tropical Storm | - |
| 0600 UTC 24 Jul | 46.7 | -44.1 | 45 | 1005 | Remnant Low | - |
| 1200 UTC 24 Jul | 47.3 | -41.9 | 45 | 1005 | Remnant Low | - |
| 1800 UTC 24 Jul | 47.8 | -39.7 | 45 | 1005 | Remnant Low | - |
| 0000 UTC 25 Jul | 48.5 | -36.8 | 40 | 1008 | Remnant Low | - |
| 0600 UTC 25 Jul | 49.1 | -33.7 | 40 | 1008 | Remnant Low | - |
| 1200 UTC 25 Jul | 49.8 | -29.4 | 35 | 1010 | Remnant Low | - |
| 1800 UTC 25 Jul | 50.4 | -24.5 | 35 | 1010 | Post-Tropical Cyclone | - |
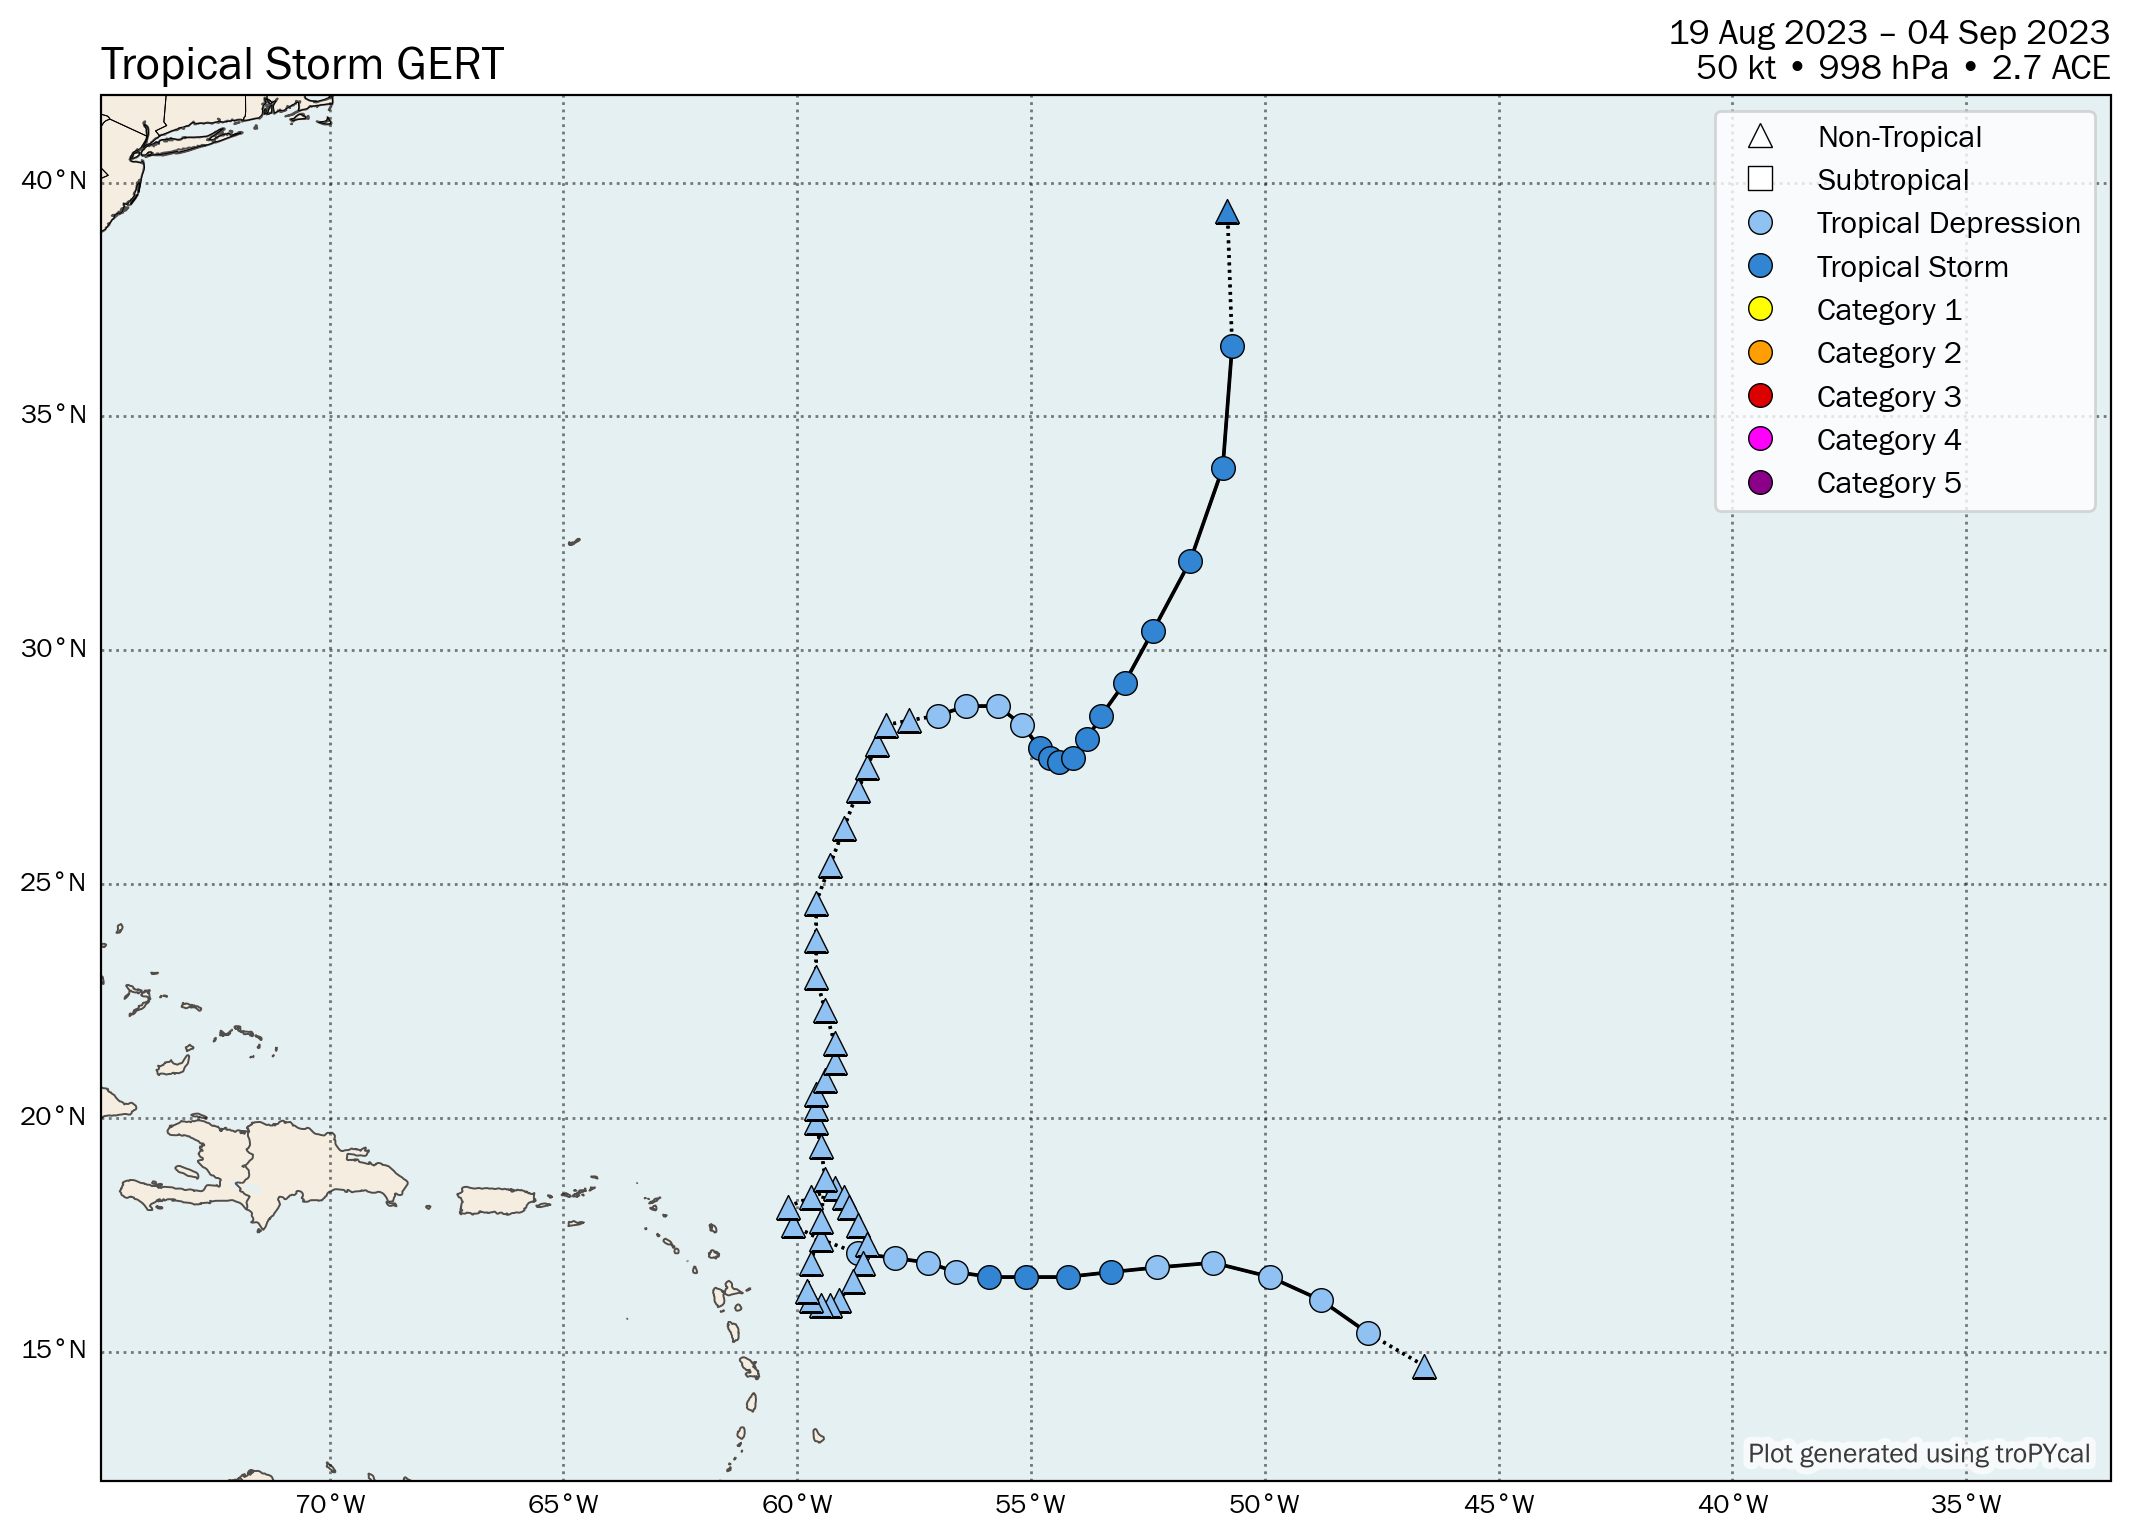
| Time (UTC) | Lat | Lon | Wind (mph) | Pressure | Storm Type | Category |
|---|---|---|---|---|---|---|
| 0000 UTC 19 Aug | 14.7 | -46.6 | 35 | 1008 | Disturbance | - |
| 0600 UTC 19 Aug | 15.4 | -47.8 | 35 | 1007 | Tropical Depression | - |
| 1200 UTC 19 Aug | 16.1 | -48.8 | 35 | 1006 | Tropical Depression | - |
| 1800 UTC 19 Aug | 16.6 | -49.9 | 35 | 1006 | Tropical Depression | - |
| 0000 UTC 20 Aug | 16.9 | -51.1 | 35 | 1006 | Tropical Depression | - |
| 0600 UTC 20 Aug | 16.8 | -52.3 | 35 | 1006 | Tropical Depression | - |
| 1200 UTC 20 Aug | 16.7 | -53.3 | 40 | 1005 | Tropical Storm | - |
| 1800 UTC 20 Aug | 16.6 | -54.2 | 40 | 1005 | Tropical Storm | - |
| 0000 UTC 21 Aug | 16.6 | -55.1 | 40 | 1005 | Tropical Storm | - |
| 0600 UTC 21 Aug | 16.6 | -55.9 | 40 | 1005 | Tropical Storm | - |
| 1200 UTC 21 Aug | 16.7 | -56.6 | 35 | 1006 | Tropical Depression | - |
| 1800 UTC 21 Aug | 16.9 | -57.2 | 30 | 1006 | Tropical Depression | - |
| 0000 UTC 22 Aug | 17.0 | -57.9 | 30 | 1006 | Tropical Depression | - |
| 0600 UTC 22 Aug | 17.1 | -58.7 | 30 | 1007 | Tropical Depression | - |
| 1200 UTC 22 Aug | 17.4 | -59.5 | 30 | 1008 | Remnant Low | - |
| 1800 UTC 22 Aug | 17.7 | -60.1 | 30 | 1008 | Remnant Low | - |
| 0000 UTC 23 Aug | 18.1 | -60.2 | 30 | 1008 | Remnant Low | - |
| 0600 UTC 23 Aug | 18.3 | -59.7 | 30 | 1008 | Remnant Low | - |
| 1200 UTC 23 Aug | 18.5 | -59.2 | 30 | 1009 | Remnant Low | - |
| 1800 UTC 23 Aug | 18.3 | -59.0 | 30 | 1009 | Remnant Low | - |
| 0000 UTC 24 Aug | 18.1 | -58.9 | 25 | 1010 | Remnant Low | - |
| 0600 UTC 24 Aug | 17.7 | -58.7 | 25 | 1010 | Remnant Low | - |
| 1200 UTC 24 Aug | 17.3 | -58.5 | 25 | 1010 | Remnant Low | - |
| 1800 UTC 24 Aug | 16.9 | -58.6 | 25 | 1010 | Remnant Low | - |
| 0000 UTC 25 Aug | 16.5 | -58.8 | 25 | 1010 | Remnant Low | - |
| 0600 UTC 25 Aug | 16.1 | -59.1 | 25 | 1010 | Remnant Low | - |
| 1200 UTC 25 Aug | 16.0 | -59.3 | 25 | 1010 | Remnant Low | - |
| 1800 UTC 25 Aug | 16.0 | -59.5 | 25 | 1010 | Remnant Low | - |
| 0000 UTC 26 Aug | 16.1 | -59.7 | 25 | 1010 | Remnant Low | - |
| 0600 UTC 26 Aug | 16.3 | -59.8 | 30 | 1010 | Remnant Low | - |
| 1200 UTC 26 Aug | 16.9 | -59.7 | 30 | 1010 | Remnant Low | - |
| 1800 UTC 26 Aug | 17.8 | -59.5 | 30 | 1010 | Remnant Low | - |
| 0000 UTC 27 Aug | 18.7 | -59.4 | 30 | 1010 | Remnant Low | - |
| 0600 UTC 27 Aug | 19.4 | -59.5 | 30 | 1010 | Remnant Low | - |
| 1200 UTC 27 Aug | 19.9 | -59.6 | 30 | 1010 | Remnant Low | - |
| 1800 UTC 27 Aug | 20.2 | -59.6 | 30 | 1010 | Remnant Low | - |
| 0000 UTC 28 Aug | 20.5 | -59.6 | 30 | 1010 | Remnant Low | - |
| 0600 UTC 28 Aug | 20.8 | -59.4 | 30 | 1010 | Remnant Low | - |
| 1200 UTC 28 Aug | 21.2 | -59.2 | 30 | 1010 | Remnant Low | - |
| 1800 UTC 28 Aug | 21.6 | -59.2 | 30 | 1010 | Remnant Low | - |
| 0000 UTC 29 Aug | 22.3 | -59.4 | 30 | 1011 | Remnant Low | - |
| 0600 UTC 29 Aug | 23.0 | -59.6 | 30 | 1011 | Remnant Low | - |
| 1200 UTC 29 Aug | 23.8 | -59.6 | 30 | 1012 | Remnant Low | - |
| 1800 UTC 29 Aug | 24.6 | -59.6 | 30 | 1012 | Remnant Low | - |
| 0000 UTC 30 Aug | 25.4 | -59.3 | 30 | 1012 | Remnant Low | - |
| 0600 UTC 30 Aug | 26.2 | -59.0 | 30 | 1010 | Remnant Low | - |
| 1200 UTC 30 Aug | 27.0 | -58.7 | 30 | 1010 | Remnant Low | - |
| 1800 UTC 30 Aug | 27.5 | -58.5 | 30 | 1009 | Remnant Low | - |
| 0000 UTC 31 Aug | 28.0 | -58.3 | 35 | 1009 | Remnant Low | - |
| 0600 UTC 31 Aug | 28.4 | -58.1 | 35 | 1008 | Remnant Low | - |
| 1200 UTC 31 Aug | 28.5 | -57.6 | 35 | 1008 | Remnant Low | - |
| 1800 UTC 31 Aug | 28.6 | -57.0 | 35 | 1007 | Tropical Depression | - |
| 0000 UTC 01 Sep | 28.8 | -56.4 | 35 | 1006 | Tropical Depression | - |
| 0600 UTC 01 Sep | 28.8 | -55.7 | 35 | 1006 | Tropical Depression | - |
| 1200 UTC 01 Sep | 28.4 | -55.2 | 35 | 1006 | Tropical Depression | - |
| 1800 UTC 01 Sep | 27.9 | -54.8 | 40 | 1005 | Tropical Storm | - |
| 0000 UTC 02 Sep | 27.7 | -54.6 | 40 | 1005 | Tropical Storm | - |
| 0600 UTC 02 Sep | 27.6 | -54.4 | 45 | 1003 | Tropical Storm | - |
| 1200 UTC 02 Sep | 27.7 | -54.1 | 50 | 999 | Tropical Storm | - |
| 1800 UTC 02 Sep | 28.1 | -53.8 | 50 | 999 | Tropical Storm | - |
| 0000 UTC 03 Sep | 28.6 | -53.5 | 60 | 998 | Tropical Storm | - |
| 0600 UTC 03 Sep | 29.3 | -53.0 | 60 | 998 | Tropical Storm | - |
| 1200 UTC 03 Sep | 30.4 | -52.4 | 60 | 998 | Tropical Storm | - |
| 1800 UTC 03 Sep | 31.9 | -51.6 | 50 | 999 | Tropical Storm | - |
| 0000 UTC 04 Sep | 33.9 | -50.9 | 50 | 1000 | Tropical Storm | - |
| 0600 UTC 04 Sep | 36.5 | -50.7 | 50 | 1000 | Tropical Storm | - |
| 1200 UTC 04 Sep | 39.4 | -50.8 | 45 | 1001 | Remnant Low | - |
Ensemble Viewer (Click image for loop)
| Time (UTC) | Lat | Lon | Wind (mph) | Pressure | Storm Type | Category |
|---|---|---|---|---|---|---|
| 1200 UTC 18 Aug | 15.4 | -32.9 | 35 | 1009 | Disturbance | - |
| 1800 UTC 18 Aug | 15.5 | -33.9 | 35 | 1008 | Disturbance | - |
| 0000 UTC 19 Aug | 15.6 | -34.8 | 35 | 1007 | Disturbance | - |
| 0600 UTC 19 Aug | 15.8 | -35.3 | 35 | 1006 | Disturbance | - |
| 1200 UTC 19 Aug | 16.4 | -35.7 | 35 | 1006 | Disturbance | - |
| 1800 UTC 19 Aug | 17.2 | -36.1 | 35 | 1006 | Disturbance | - |
| 0000 UTC 20 Aug | 18.0 | -36.7 | 40 | 1004 | Tropical Storm | - |
| 0600 UTC 20 Aug | 18.8 | -37.5 | 45 | 1001 | Tropical Storm | - |
| 1200 UTC 20 Aug | 19.4 | -38.3 | 50 | 998 | Tropical Storm | - |
| 1800 UTC 20 Aug | 20.0 | -39.0 | 50 | 998 | Tropical Storm | - |
| 0000 UTC 21 Aug | 20.3 | -39.8 | 45 | 1000 | Tropical Storm | - |
| 0600 UTC 21 Aug | 20.6 | -40.6 | 40 | 1003 | Remnant Low | - |
| 1200 UTC 21 Aug | 21.0 | -41.4 | 40 | 1004 | Remnant Low | - |
| 1800 UTC 21 Aug | 21.4 | -42.2 | 35 | 1005 | Remnant Low | - |
| 0000 UTC 22 Aug | 21.9 | -43.1 | 35 | 1006 | Remnant Low | - |
| 0600 UTC 22 Aug | 22.5 | -44.1 | 35 | 1006 | Remnant Low | - |
| 1200 UTC 22 Aug | 23.4 | -45.1 | 35 | 1006 | Remnant Low | - |
| 1800 UTC 22 Aug | 24.4 | -46.1 | 35 | 1006 | Remnant Low | - |
| 0000 UTC 23 Aug | 25.3 | -47.2 | 40 | 1006 | Remnant Low | - |
| 0600 UTC 23 Aug | 26.1 | -48.4 | 40 | 1006 | Remnant Low | - |
| 1200 UTC 23 Aug | 26.9 | -49.2 | 40 | 1006 | Remnant Low | - |
| 1800 UTC 23 Aug | 27.8 | -49.6 | 40 | 1006 | Remnant Low | - |
| 0000 UTC 24 Aug | 28.6 | -49.6 | 40 | 1006 | Remnant Low | - |
| 0600 UTC 24 Aug | 29.3 | -49.2 | 40 | 1006 | Remnant Low | - |
| 1200 UTC 24 Aug | 29.8 | -48.9 | 40 | 1008 | Remnant Low | - |
| 1800 UTC 24 Aug | 30.5 | -48.7 | 35 | 1010 | Remnant Low | - |
| 0000 UTC 25 Aug | 31.4 | -48.6 | 35 | 1010 | Remnant Low | - |
| 0600 UTC 25 Aug | 32.4 | -48.6 | 35 | 1010 | Remnant Low | - |
Ensemble Viewer (Click image for loop)
Summary Plot
Recon-Derived Hovmoller
Recon-Derived Wind Swath
Recon-Derived MSLP Swath
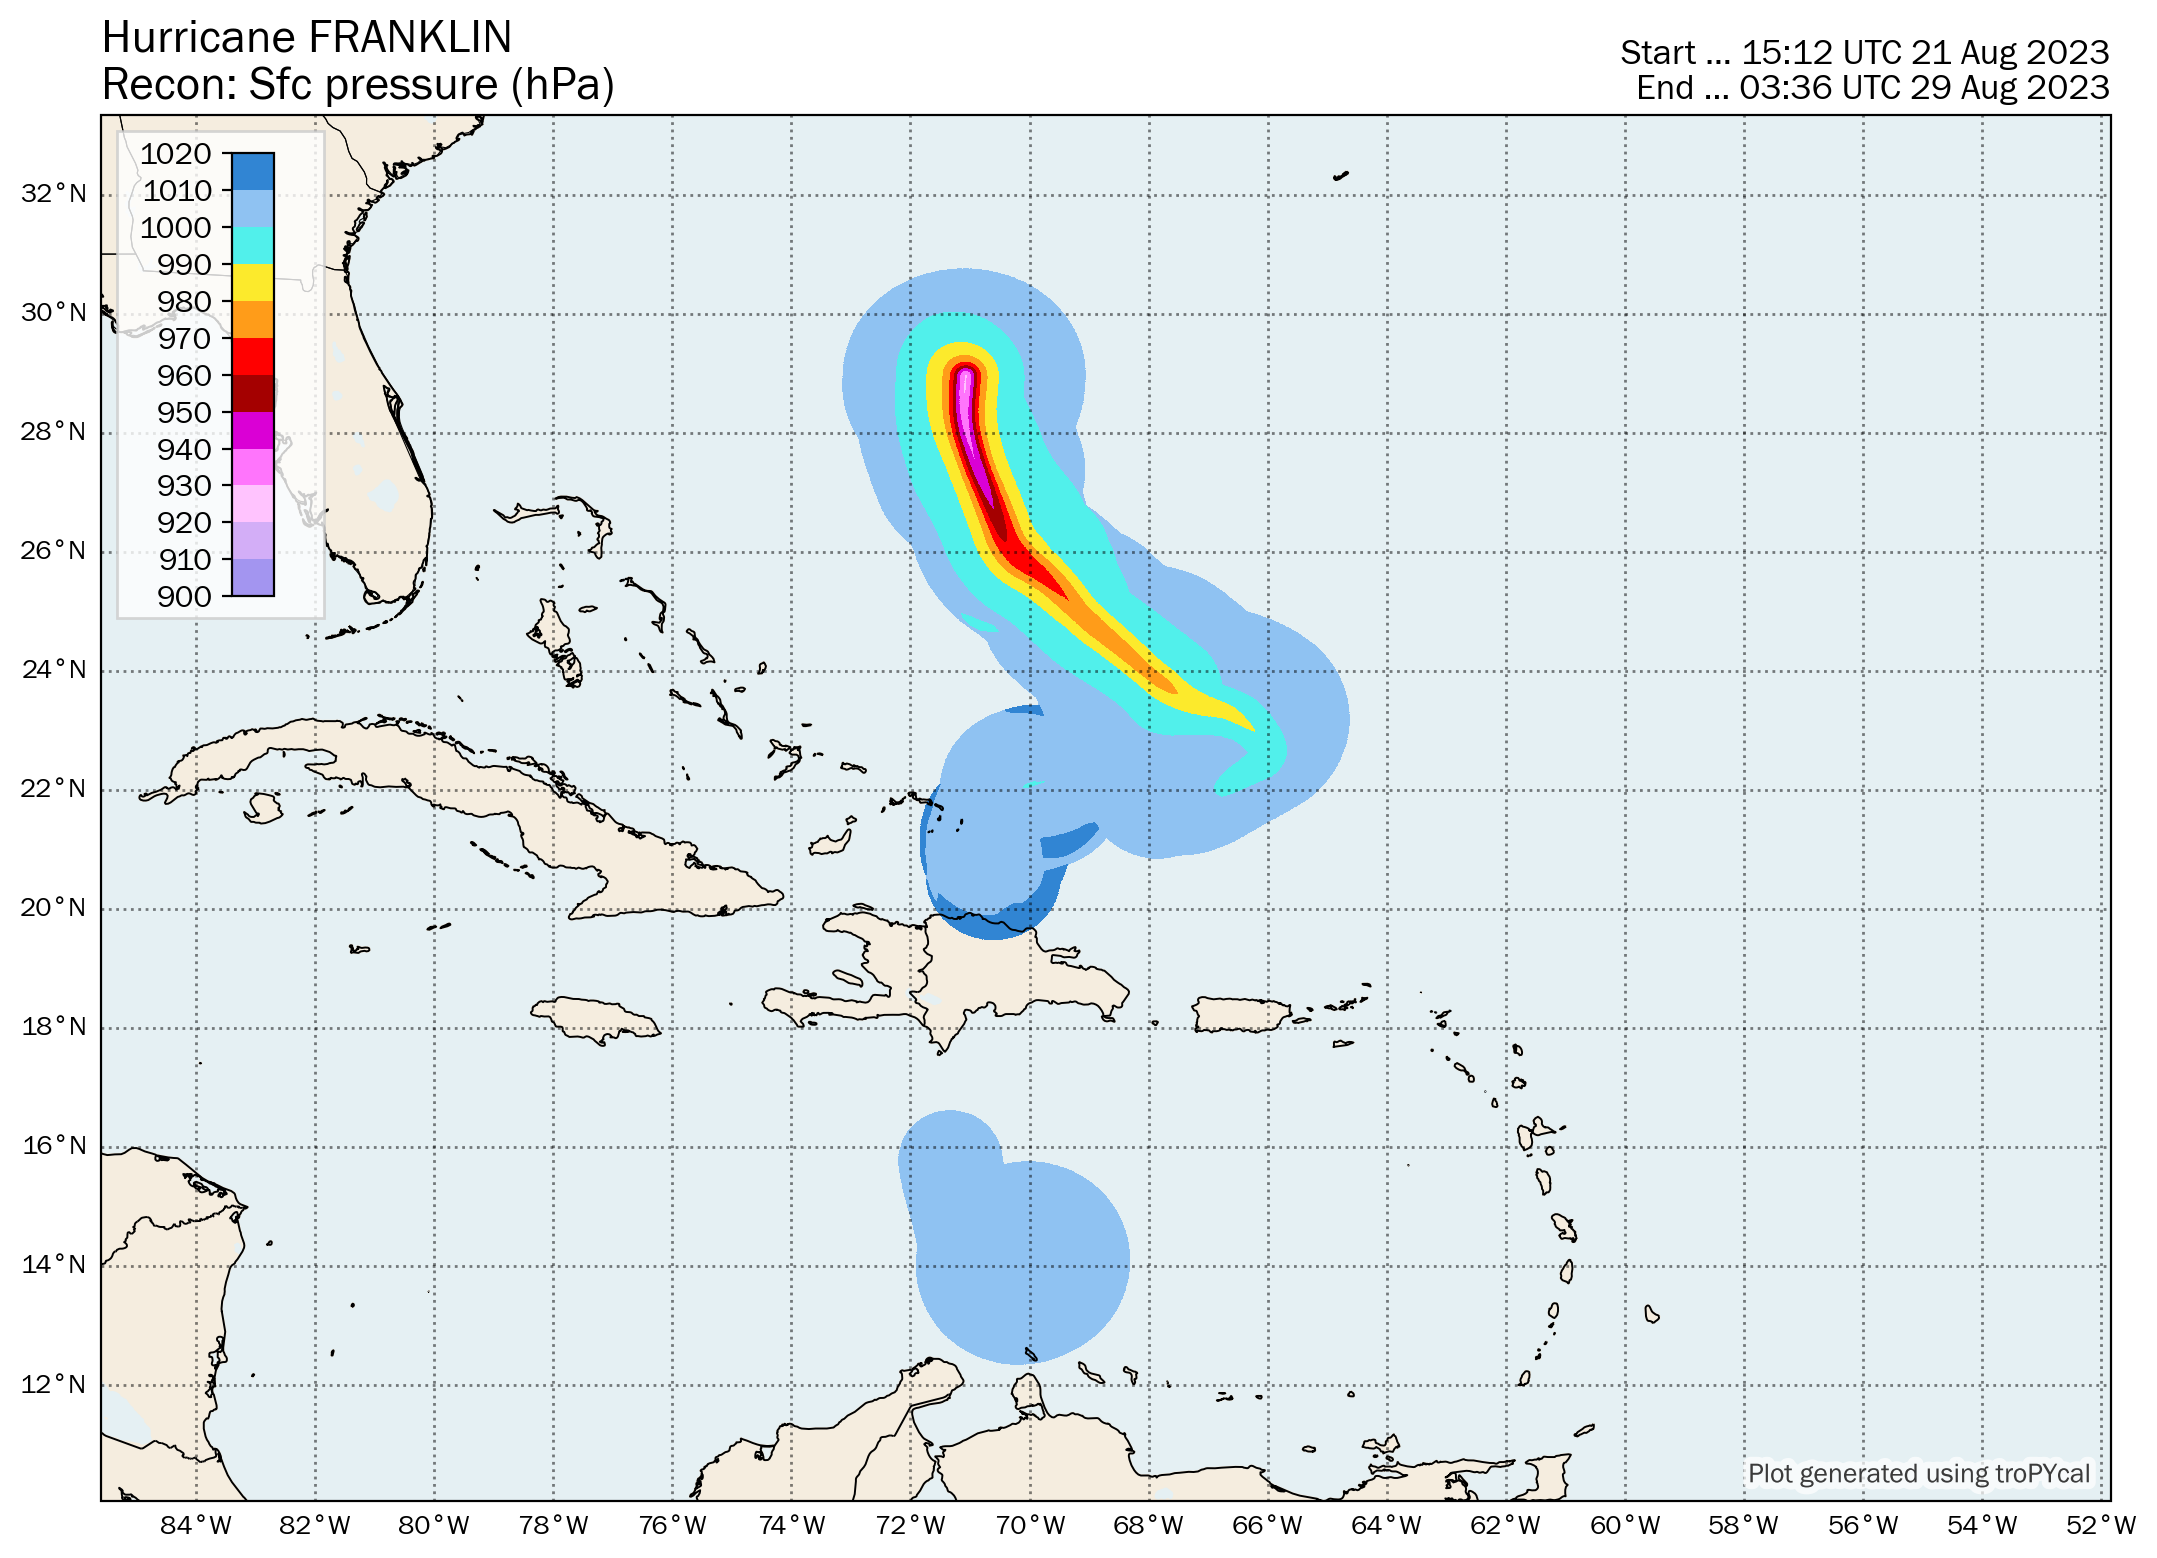
| Time (UTC) | Lat | Lon | Wind (mph) | Pressure | Storm Type | Category |
|---|---|---|---|---|---|---|
| 1800 UTC 19 Aug | 12.8 | -60.5 | 30 | 1006 | Disturbance | - |
| 0000 UTC 20 Aug | 13.1 | -62.1 | 30 | 1006 | Disturbance | - |
| 0600 UTC 20 Aug | 13.5 | -63.7 | 35 | 1004 | Tropical Depression | - |
| 1200 UTC 20 Aug | 14.0 | -65.2 | 40 | 1002 | Tropical Storm | - |
| 1800 UTC 20 Aug | 14.5 | -66.6 | 45 | 1001 | Tropical Storm | - |
| 0000 UTC 21 Aug | 14.8 | -67.9 | 50 | 999 | Tropical Storm | - |
| 0600 UTC 21 Aug | 14.8 | -68.8 | 50 | 999 | Tropical Storm | - |
| 1200 UTC 21 Aug | 14.6 | -69.5 | 50 | 999 | Tropical Storm | - |
| 1800 UTC 21 Aug | 14.1 | -70.0 | 50 | 1002 | Tropical Storm | - |
| 0000 UTC 22 Aug | 14.0 | -70.4 | 50 | 1002 | Tropical Storm | - |
| 0600 UTC 22 Aug | 14.1 | -70.9 | 45 | 1002 | Tropical Storm | - |
| 1200 UTC 22 Aug | 14.8 | -71.1 | 45 | 1003 | Tropical Storm | - |
| 1800 UTC 22 Aug | 15.6 | -71.3 | 40 | 1003 | Tropical Storm | - |
| 0000 UTC 23 Aug | 16.5 | -71.4 | 40 | 1003 | Tropical Storm | - |
| 0600 UTC 23 Aug | 17.3 | -71.4 | 45 | 1003 | Tropical Storm | - |
| 1000 UTC 23 Aug | 17.9 | -71.2 | 45 | 1003 | Tropical Storm | - |
| 1200 UTC 23 Aug | 18.3 | -71.1 | 45 | 1005 | Tropical Storm | - |
| 1800 UTC 23 Aug | 19.4 | -70.8 | 40 | 1004 | Tropical Storm | - |
| 0000 UTC 24 Aug | 20.6 | -70.6 | 45 | 1005 | Tropical Storm | - |
| 0600 UTC 24 Aug | 21.6 | -70.5 | 50 | 1001 | Tropical Storm | - |
| 1200 UTC 24 Aug | 22.0 | -70.0 | 60 | 998 | Tropical Storm | - |
| 1800 UTC 24 Aug | 22.2 | -69.3 | 60 | 1000 | Tropical Storm | - |
| 0000 UTC 25 Aug | 22.4 | -68.5 | 60 | 1000 | Tropical Storm | - |
| 0600 UTC 25 Aug | 22.2 | -68.1 | 60 | 1000 | Tropical Storm | - |
| 1200 UTC 25 Aug | 21.9 | -67.9 | 50 | 1003 | Tropical Storm | - |
| 1800 UTC 25 Aug | 21.8 | -67.3 | 50 | 1003 | Tropical Storm | - |
| 0000 UTC 26 Aug | 22.2 | -66.5 | 60 | 1002 | Tropical Storm | - |
| 0600 UTC 26 Aug | 22.6 | -66.0 | 65 | 992 | Tropical Storm | - |
| 1200 UTC 26 Aug | 23.2 | -66.5 | 75 | 989 | Hurricane | 1 |
| 1800 UTC 26 Aug | 23.5 | -67.3 | 80 | 982 | Hurricane | 1 |
| 0000 UTC 27 Aug | 23.9 | -67.9 | 85 | 977 | Hurricane | 1 |
| 0600 UTC 27 Aug | 24.4 | -68.5 | 85 | 973 | Hurricane | 1 |
| 1200 UTC 27 Aug | 24.9 | -69.1 | 90 | 970 | Hurricane | 1 |
| 1800 UTC 27 Aug | 25.5 | -69.7 | 90 | 967 | Hurricane | 1 |
| 0000 UTC 28 Aug | 26.0 | -70.3 | 100 | 964 | Hurricane | 2 |
| 0600 UTC 28 Aug | 26.7 | -70.6 | 115 | 951 | Hurricane | 3 |
| 1200 UTC 28 Aug | 27.5 | -70.9 | 145 | 937 | Hurricane | 4 |
| 1800 UTC 28 Aug | 28.2 | -71.1 | 145 | 931 | Hurricane | 4 |
| 0000 UTC 29 Aug | 28.9 | -71.1 | 150 | 926 | Hurricane | 4 |
| 0600 UTC 29 Aug | 29.7 | -71.0 | 140 | 935 | Hurricane | 4 |
| 1200 UTC 29 Aug | 30.3 | -70.7 | 130 | 941 | Hurricane | 4 |
| 1800 UTC 29 Aug | 31.1 | -70.2 | 125 | 947 | Hurricane | 3 |
| 0000 UTC 30 Aug | 31.8 | -69.5 | 115 | 953 | Hurricane | 3 |
| 0600 UTC 30 Aug | 32.6 | -68.7 | 110 | 956 | Hurricane | 2 |
| 1200 UTC 30 Aug | 33.2 | -67.8 | 110 | 958 | Hurricane | 2 |
| 1800 UTC 30 Aug | 33.9 | -66.7 | 105 | 960 | Hurricane | 2 |
| 0000 UTC 31 Aug | 34.4 | -65.2 | 105 | 961 | Hurricane | 2 |
| 0600 UTC 31 Aug | 34.7 | -63.9 | 100 | 963 | Hurricane | 2 |
| 1200 UTC 31 Aug | 35.1 | -62.6 | 100 | 964 | Hurricane | 2 |
| 1800 UTC 31 Aug | 35.6 | -61.1 | 90 | 969 | Hurricane | 1 |
| 0000 UTC 01 Sep | 36.4 | -59.7 | 85 | 975 | Hurricane | 1 |
| 0600 UTC 01 Sep | 37.4 | -58.2 | 80 | 978 | Hurricane | 1 |
| 1200 UTC 01 Sep | 38.2 | -56.6 | 75 | 982 | Hurricane | 1 |
| 1800 UTC 01 Sep | 38.8 | -54.6 | 80 | 979 | Post-Tropical Cyclone | 1 |
| 0000 UTC 02 Sep | 39.6 | -52.0 | 80 | 979 | Post-Tropical Cyclone | 1 |
| 0600 UTC 02 Sep | 41.2 | -48.8 | 80 | 980 | Post-Tropical Cyclone | 1 |
| 1200 UTC 02 Sep | 43.0 | -45.9 | 75 | 981 | Post-Tropical Cyclone | 1 |
| 1800 UTC 02 Sep | 44.8 | -43.4 | 75 | 982 | Post-Tropical Cyclone | 1 |
| 0000 UTC 03 Sep | 45.8 | -41.0 | 75 | 984 | Post-Tropical Cyclone | 1 |
| 0600 UTC 03 Sep | 46.4 | -38.7 | 70 | 986 | Post-Tropical Cyclone | - |
| 1200 UTC 03 Sep | 47.0 | -36.2 | 65 | 988 | Post-Tropical Cyclone | - |
| 1800 UTC 03 Sep | 47.7 | -33.4 | 65 | 990 | Post-Tropical Cyclone | - |
| 0000 UTC 04 Sep | 47.8 | -30.8 | 60 | 991 | Post-Tropical Cyclone | - |
| 0600 UTC 04 Sep | 47.5 | -28.6 | 50 | 993 | Post-Tropical Cyclone | - |
| 1200 UTC 04 Sep | 47.1 | -27.3 | 45 | 994 | Post-Tropical Cyclone | - |
| 1800 UTC 04 Sep | 46.7 | -26.8 | 45 | 995 | Post-Tropical Cyclone | - |
| 0000 UTC 05 Sep | 46.0 | -26.6 | 45 | 995 | Post-Tropical Cyclone | - |
| 0600 UTC 05 Sep | 44.6 | -26.3 | 45 | 995 | Post-Tropical Cyclone | - |
| 1200 UTC 05 Sep | 42.8 | -25.4 | 45 | 995 | Post-Tropical Cyclone | - |
| 1800 UTC 05 Sep | 41.0 | -23.8 | 45 | 995 | Post-Tropical Cyclone | - |
| 0000 UTC 06 Sep | 40.1 | -21.6 | 40 | 995 | Post-Tropical Cyclone | - |
| 0600 UTC 06 Sep | 40.1 | -19.4 | 40 | 995 | Post-Tropical Cyclone | - |
| 1200 UTC 06 Sep | 41.3 | -17.7 | 45 | 993 | Post-Tropical Cyclone | - |
| 1800 UTC 06 Sep | 43.3 | -16.5 | 50 | 992 | Post-Tropical Cyclone | - |
| 0000 UTC 07 Sep | 45.4 | -16.0 | 60 | 991 | Post-Tropical Cyclone | - |
| 0600 UTC 07 Sep | 46.8 | -16.1 | 60 | 991 | Post-Tropical Cyclone | - |
| 1200 UTC 07 Sep | 47.7 | -16.3 | 50 | 993 | Post-Tropical Cyclone | - |
| 1800 UTC 07 Sep | 48.5 | -16.5 | 45 | 996 | Post-Tropical Cyclone | - |
| 0000 UTC 08 Sep | 48.5 | -17.2 | 40 | 998 | Post-Tropical Cyclone | - |
| 0600 UTC 08 Sep | 48.3 | -17.8 | 35 | 1001 | Post-Tropical Cyclone | - |
| 1200 UTC 08 Sep | 47.9 | -18.5 | 35 | 1004 | Post-Tropical Cyclone | - |
| 1800 UTC 08 Sep | 47.2 | -18.9 | 35 | 1006 | Post-Tropical Cyclone | - |
| 0000 UTC 09 Sep | 46.3 | -19.1 | 35 | 1007 | Post-Tropical Cyclone | - |
| 0600 UTC 09 Sep | 45.3 | -19.4 | 35 | 1007 | Post-Tropical Cyclone | - |
| 1200 UTC 09 Sep | 44.1 | -19.8 | 30 | 1008 | Post-Tropical Cyclone | - |
| 1800 UTC 09 Sep | 43.1 | -20.3 | 30 | 1008 | Post-Tropical Cyclone | - |
Ensemble Viewer (Click image for loop)
Summary Plot
Recon-Derived Wind Swath
Recon-Derived MSLP Swath
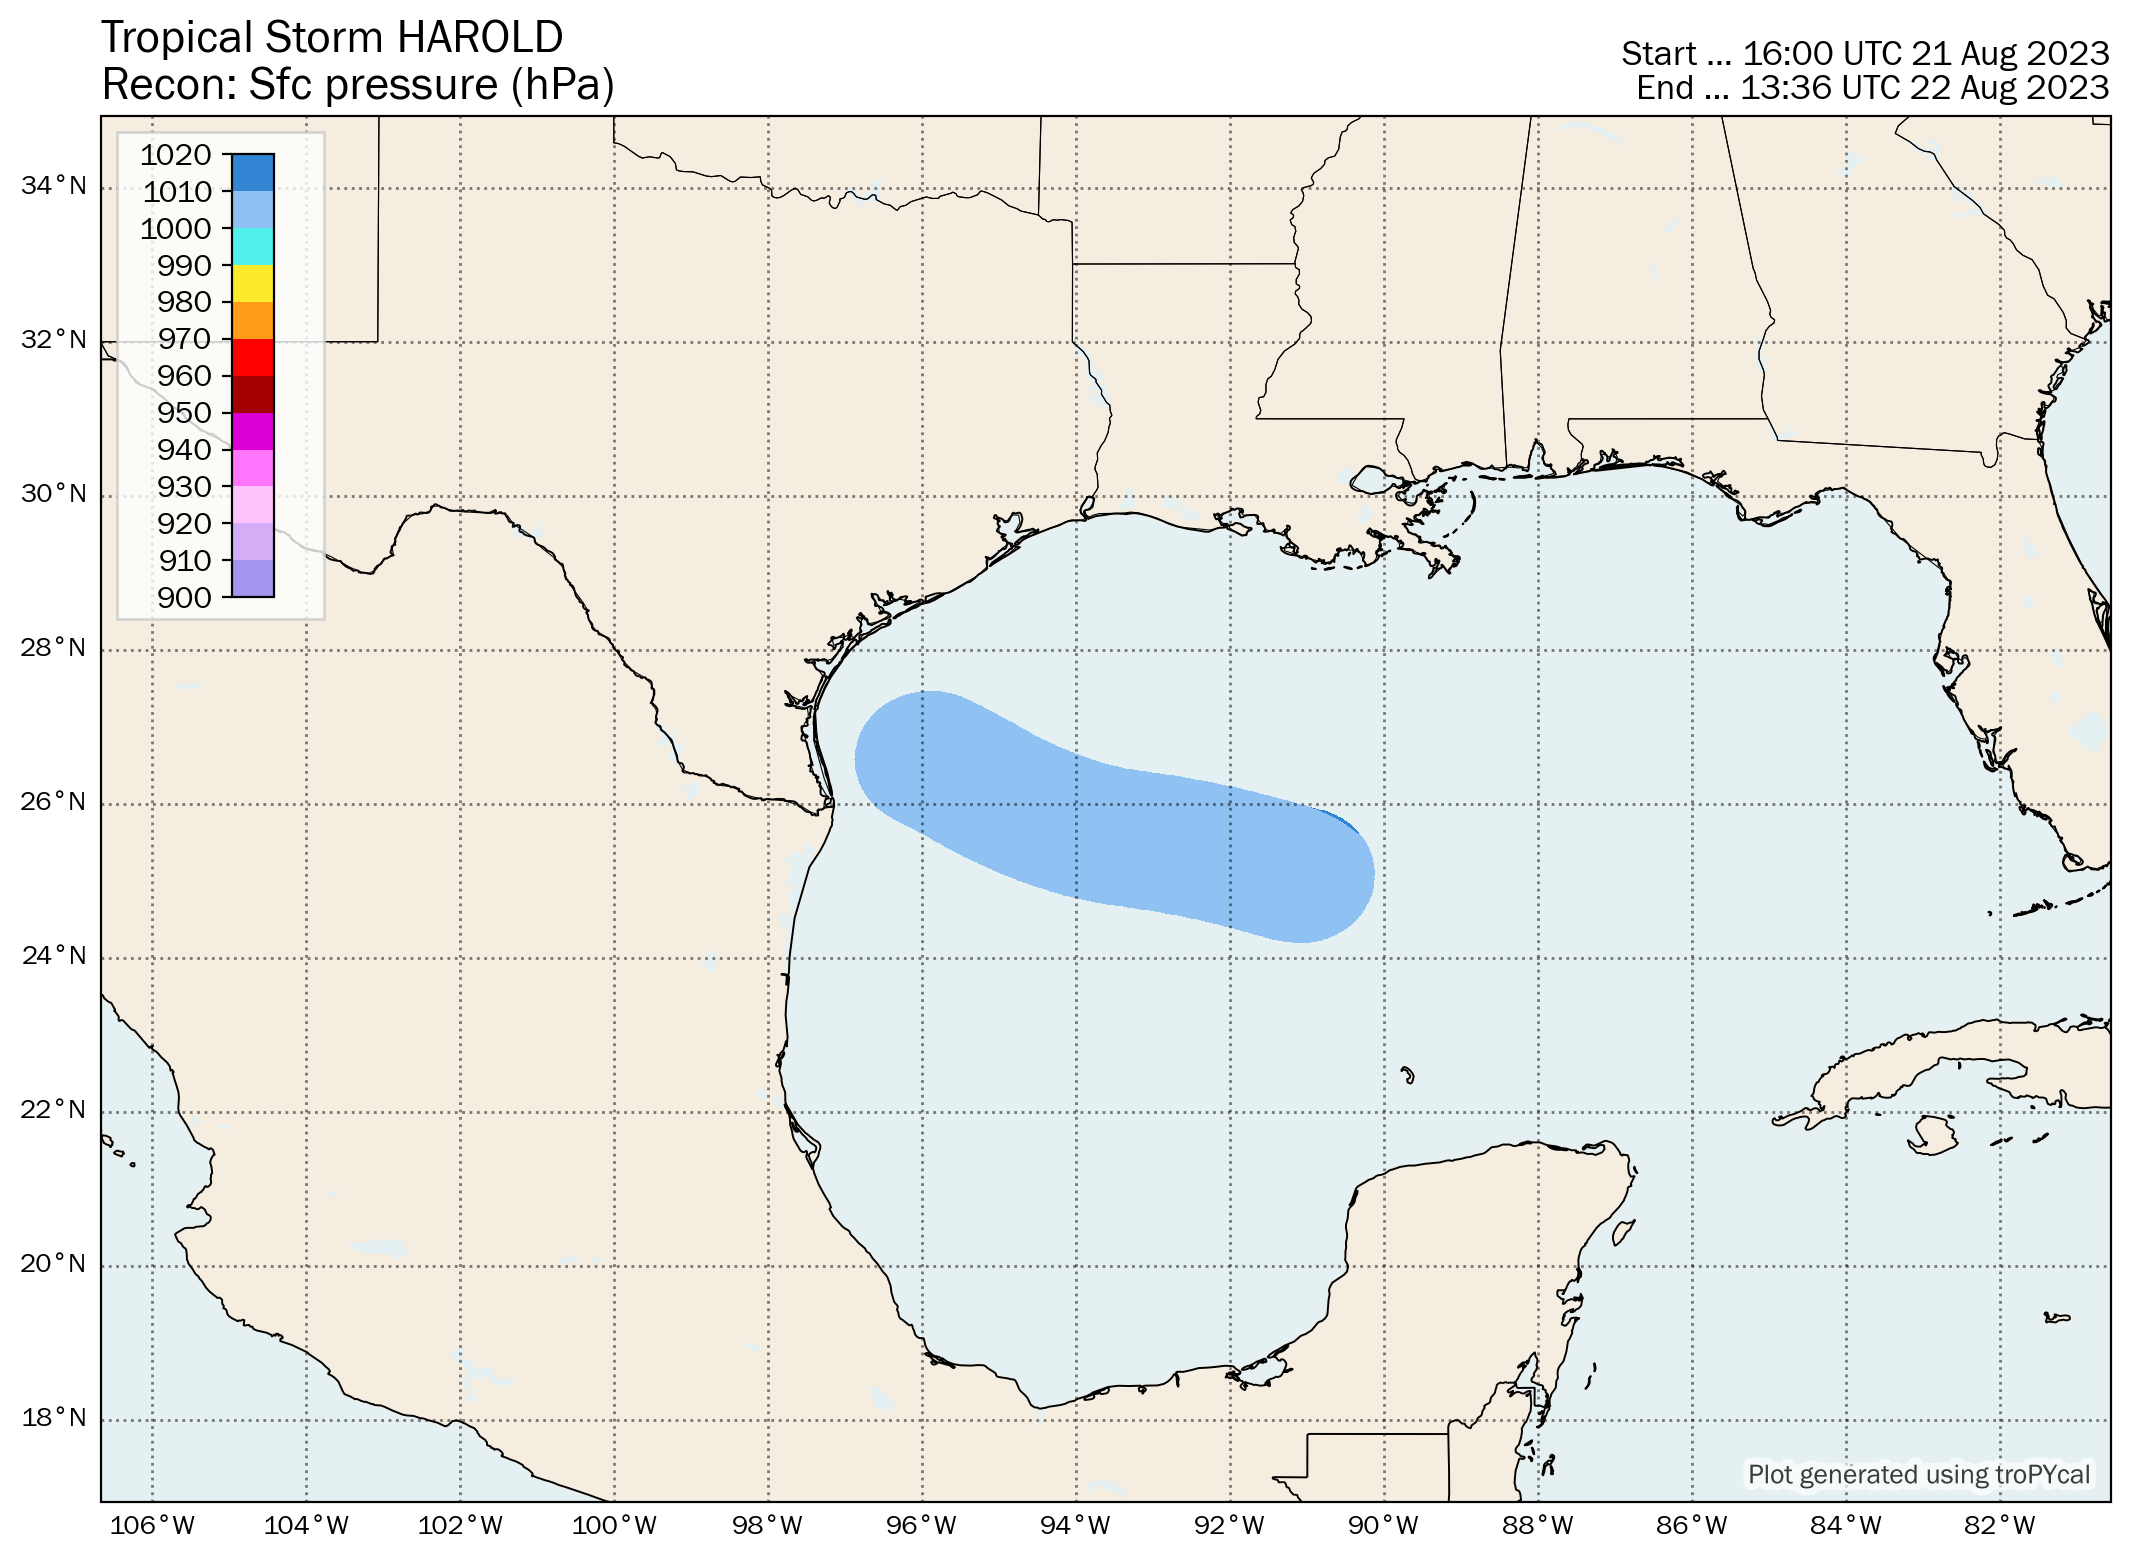
| Time (UTC) | Lat | Lon | Wind (mph) | Pressure | Storm Type | Category |
|---|---|---|---|---|---|---|
| 1200 UTC 21 Aug | 24.7 | -89.2 | 30 | 1008 | Disturbance | - |
| 1800 UTC 21 Aug | 25.0 | -90.8 | 35 | 1008 | Tropical Depression | - |
| 0000 UTC 22 Aug | 25.4 | -92.4 | 35 | 1008 | Tropical Depression | - |
| 0600 UTC 22 Aug | 25.8 | -94.3 | 45 | 1003 | Tropical Storm | - |
| 1200 UTC 22 Aug | 26.8 | -96.4 | 60 | 996 | Tropical Storm | - |
| 1500 UTC 22 Aug | 27.1 | -97.4 | 60 | 995 | Tropical Storm | - |
| 1800 UTC 22 Aug | 27.3 | -98.3 | 45 | 997 | Tropical Storm | - |
| 0000 UTC 23 Aug | 27.7 | -100.1 | 35 | 1002 | Tropical Depression | - |
| 0600 UTC 23 Aug | 28.5 | -101.7 | 30 | 1007 | Tropical Depression | - |
| 1200 UTC 23 Aug | 29.7 | -103.3 | 25 | 1011 | Remnant Low | - |
Ensemble Viewer (Click image for loop)
Summary Plot

Recon-Derived Hovmoller
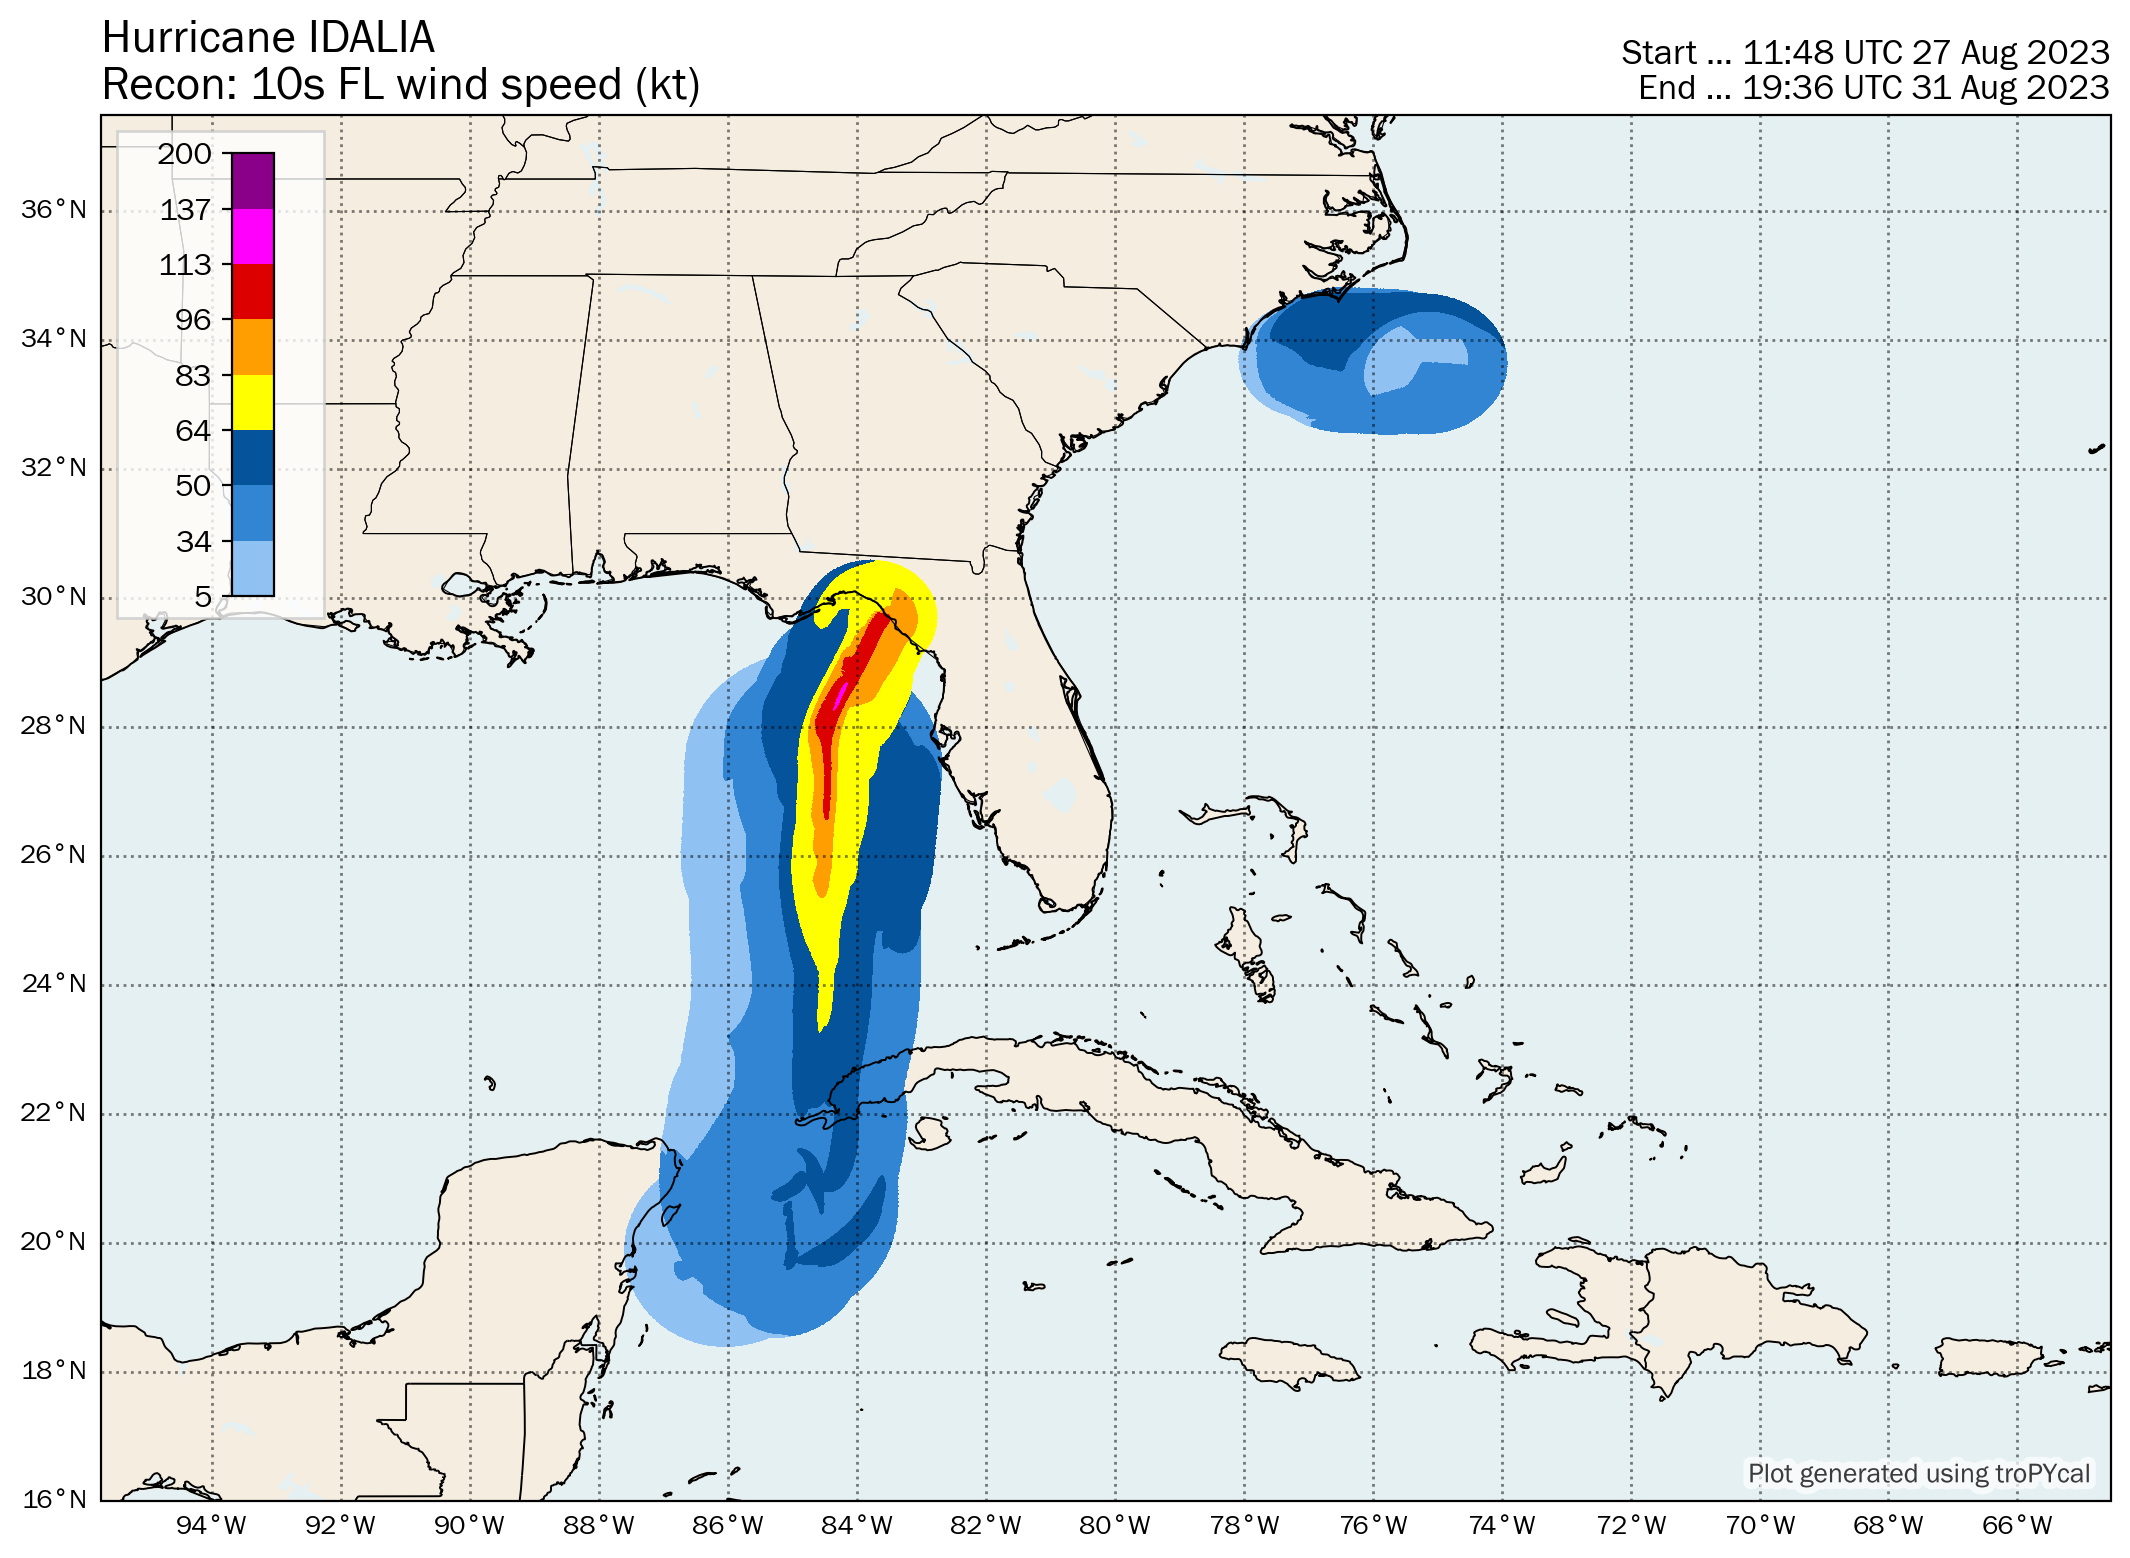
Recon-Derived Wind Swath
Recon-Derived MSLP Swath
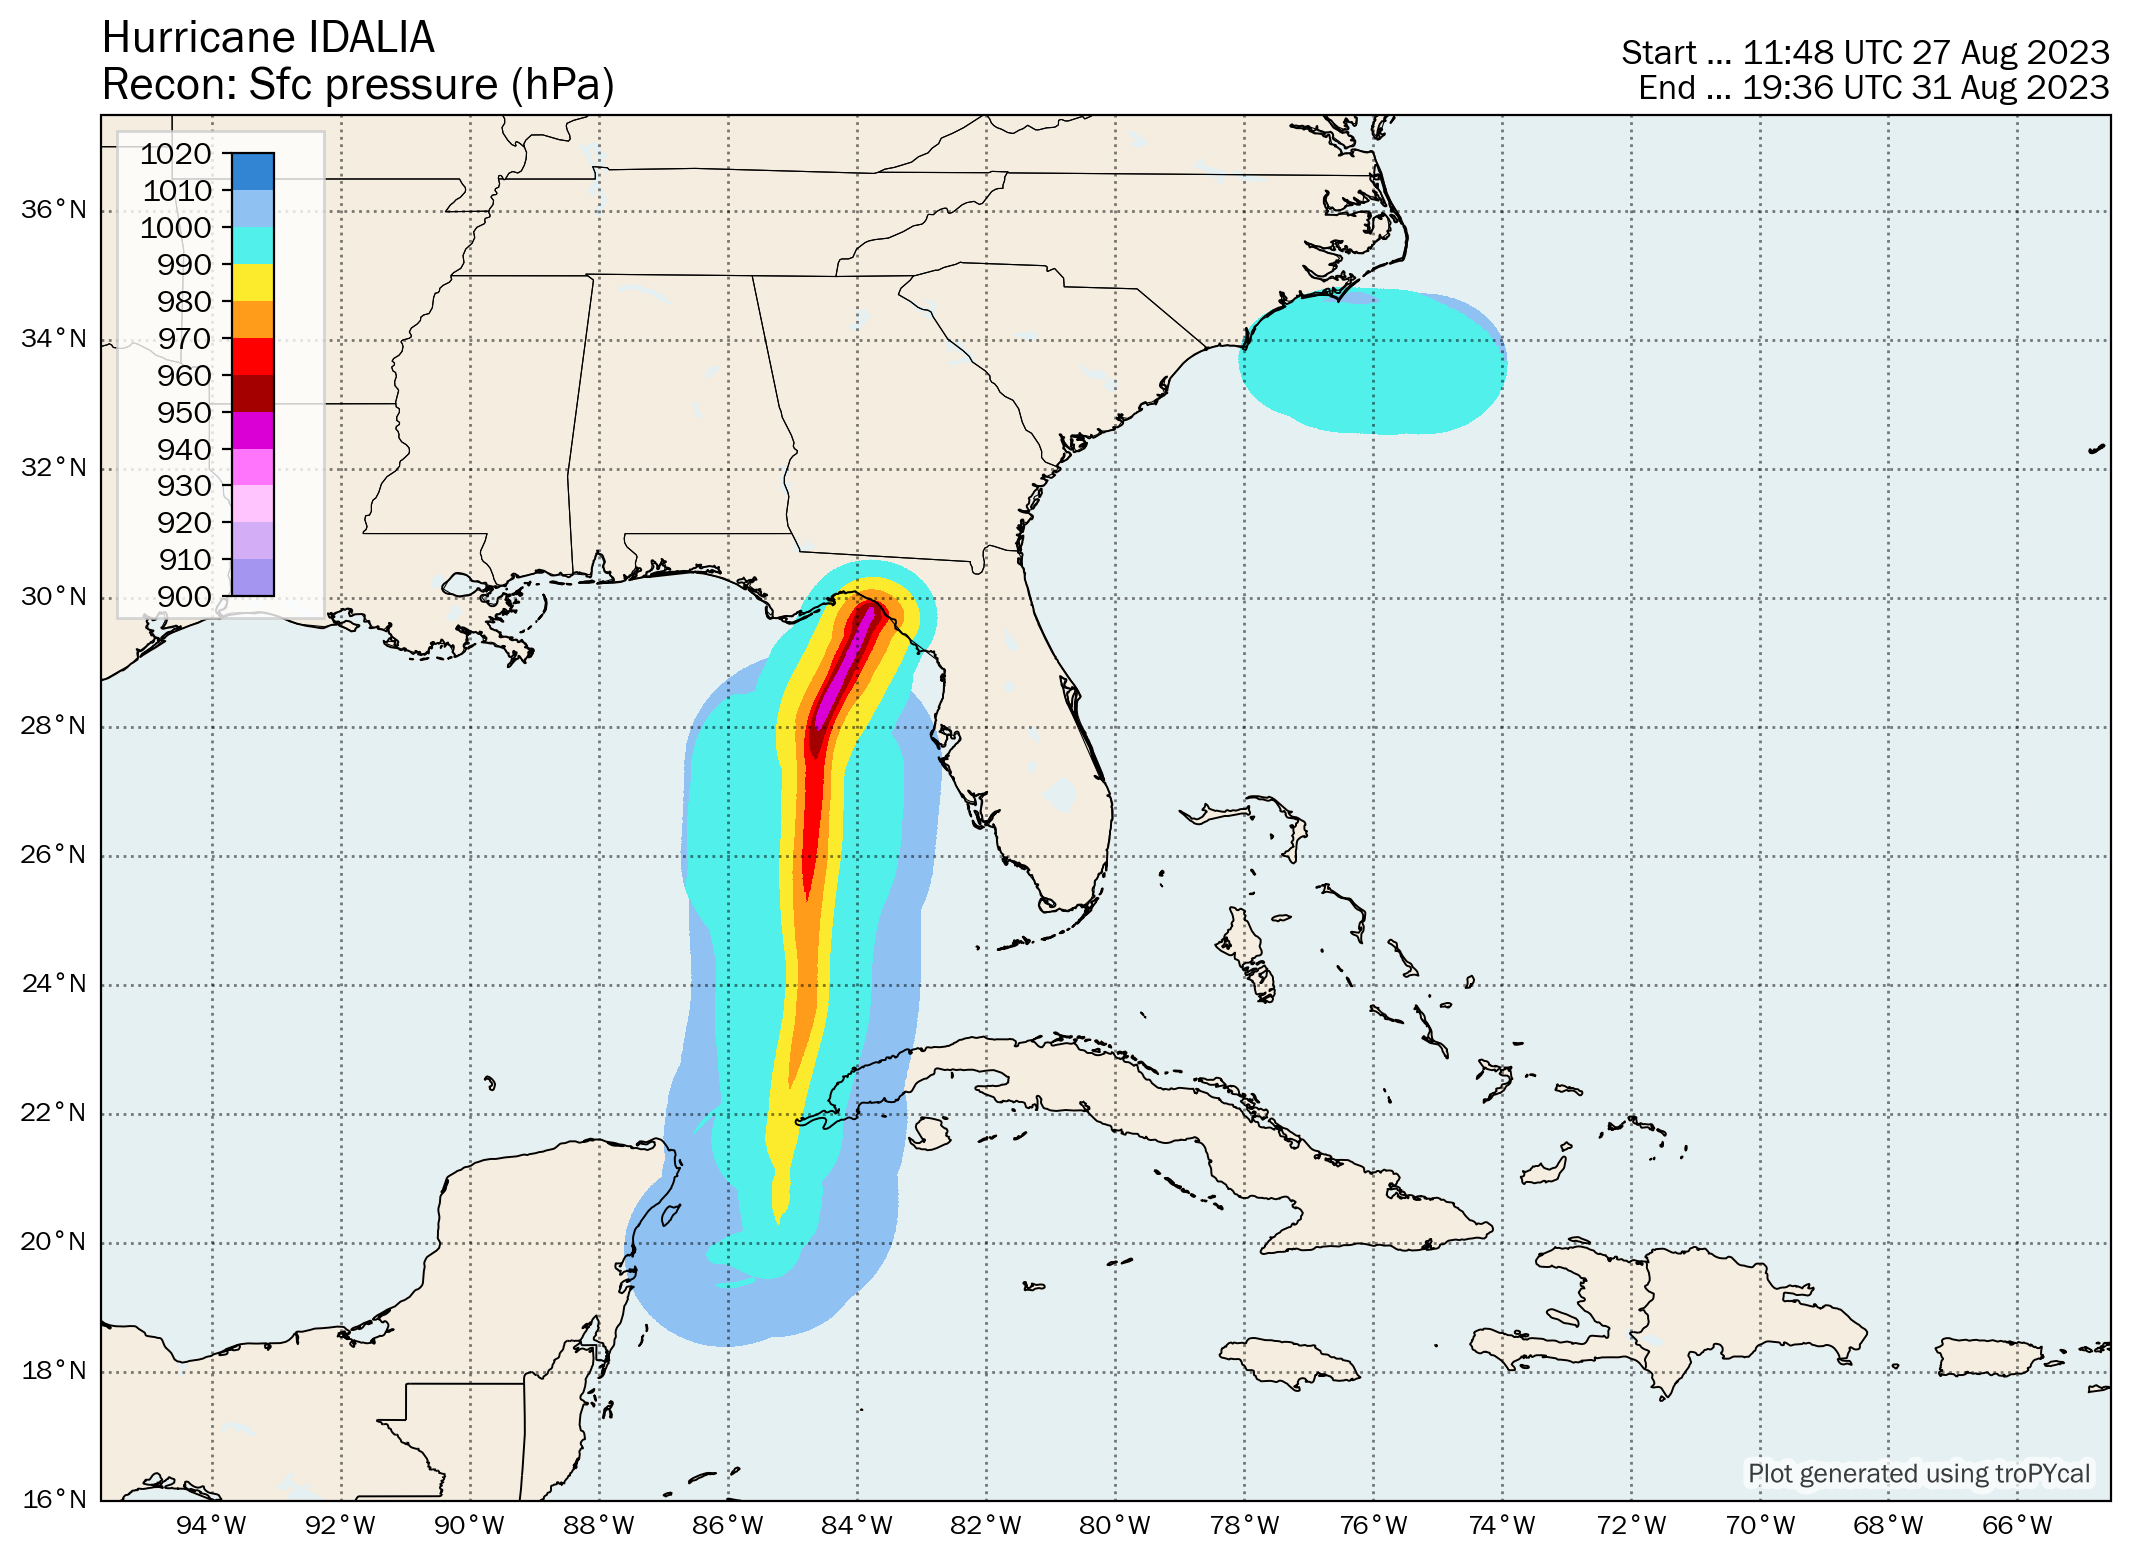
| Time (UTC) | Lat | Lon | Wind (mph) | Pressure | Storm Type | Category |
|---|---|---|---|---|---|---|
| 1200 UTC 26 Aug | 20.8 | -86.1 | 30 | 1006 | Tropical Depression | - |
| 1800 UTC 26 Aug | 21.3 | -86.2 | 30 | 1006 | Tropical Depression | - |
| 0000 UTC 27 Aug | 21.1 | -86.4 | 35 | 1004 | Tropical Depression | - |
| 0600 UTC 27 Aug | 20.5 | -86.8 | 35 | 1002 | Tropical Depression | - |
| 1200 UTC 27 Aug | 19.9 | -86.3 | 40 | 999 | Tropical Storm | - |
| 1800 UTC 27 Aug | 19.9 | -85.8 | 45 | 996 | Tropical Storm | - |
| 0000 UTC 28 Aug | 19.8 | -85.4 | 50 | 992 | Tropical Storm | - |
| 0600 UTC 28 Aug | 19.9 | -85.2 | 65 | 989 | Tropical Storm | - |
| 1200 UTC 28 Aug | 20.6 | -85.2 | 65 | 989 | Tropical Storm | - |
| 1800 UTC 28 Aug | 21.2 | -85.2 | 70 | 986 | Tropical Storm | - |
| 0000 UTC 29 Aug | 21.8 | -85.1 | 70 | 984 | Tropical Storm | - |
| 0600 UTC 29 Aug | 22.6 | -85.0 | 75 | 981 | Hurricane | 1 |
| 1200 UTC 29 Aug | 23.8 | -84.8 | 80 | 978 | Hurricane | 1 |
| 1800 UTC 29 Aug | 25.3 | -84.8 | 90 | 973 | Hurricane | 1 |
| 0000 UTC 30 Aug | 26.9 | -84.7 | 105 | 965 | Hurricane | 2 |
| 0600 UTC 30 Aug | 28.3 | -84.5 | 120 | 945 | Hurricane | 3 |
| 0900 UTC 30 Aug | 29.1 | -84.1 | 130 | 942 | Hurricane | 4 |
| 1145 UTC 30 Aug | 29.9 | -83.6 | 115 | 950 | Hurricane | 3 |
| 1200 UTC 30 Aug | 30.0 | -83.5 | 115 | 954 | Hurricane | 3 |
| 1800 UTC 30 Aug | 31.5 | -82.5 | 70 | 981 | Tropical Storm | - |
| 0000 UTC 31 Aug | 32.7 | -80.9 | 60 | 985 | Tropical Storm | - |
| 0600 UTC 31 Aug | 33.5 | -78.9 | 60 | 990 | Tropical Storm | - |
| 1200 UTC 31 Aug | 33.7 | -77.0 | 65 | 990 | Post-Tropical Cyclone | - |
| 1800 UTC 31 Aug | 33.6 | -74.6 | 65 | 993 | Post-Tropical Cyclone | - |
| 0000 UTC 01 Sep | 33.4 | -72.3 | 65 | 996 | Post-Tropical Cyclone | - |
| 0600 UTC 01 Sep | 32.7 | -70.5 | 60 | 997 | Post-Tropical Cyclone | - |
| 1200 UTC 01 Sep | 32.3 | -68.8 | 60 | 998 | Post-Tropical Cyclone | - |
| 1800 UTC 01 Sep | 32.1 | -67.1 | 60 | 999 | Post-Tropical Cyclone | - |
| 0000 UTC 02 Sep | 31.9 | -65.7 | 60 | 999 | Post-Tropical Cyclone | - |
| 0600 UTC 02 Sep | 31.8 | -64.7 | 60 | 999 | Post-Tropical Cyclone | - |
| 1200 UTC 02 Sep | 31.8 | -63.9 | 60 | 998 | Post-Tropical Cyclone | - |
| 1800 UTC 02 Sep | 31.8 | -63.1 | 60 | 997 | Post-Tropical Cyclone | - |
| 0000 UTC 03 Sep | 32.0 | -62.2 | 60 | 996 | Post-Tropical Cyclone | - |
| 0600 UTC 03 Sep | 32.5 | -61.3 | 60 | 994 | Post-Tropical Cyclone | - |
| 1200 UTC 03 Sep | 33.4 | -60.5 | 60 | 992 | Post-Tropical Cyclone | - |
| 1800 UTC 03 Sep | 34.9 | -59.7 | 65 | 990 | Post-Tropical Cyclone | - |
| 0000 UTC 04 Sep | 36.2 | -58.9 | 70 | 988 | Post-Tropical Cyclone | - |
| 0600 UTC 04 Sep | 37.6 | -58.0 | 70 | 985 | Post-Tropical Cyclone | - |
| 1200 UTC 04 Sep | 39.2 | -57.5 | 65 | 985 | Post-Tropical Cyclone | - |
| 1800 UTC 04 Sep | 40.5 | -57.9 | 65 | 986 | Post-Tropical Cyclone | - |
| 0000 UTC 05 Sep | 41.1 | -58.7 | 60 | 986 | Post-Tropical Cyclone | - |
| 0600 UTC 05 Sep | 41.6 | -59.1 | 60 | 986 | Post-Tropical Cyclone | - |
| 1200 UTC 05 Sep | 42.2 | -59.3 | 50 | 986 | Post-Tropical Cyclone | - |
| 1800 UTC 05 Sep | 42.6 | -59.8 | 45 | 987 | Post-Tropical Cyclone | - |
| 0000 UTC 06 Sep | 42.6 | -60.5 | 40 | 988 | Post-Tropical Cyclone | - |
| 0600 UTC 06 Sep | 42.6 | -61.4 | 40 | 991 | Post-Tropical Cyclone | - |
| 1200 UTC 06 Sep | 42.6 | -62.0 | 40 | 992 | Post-Tropical Cyclone | - |
| 1800 UTC 06 Sep | 42.6 | -62.8 | 40 | 994 | Post-Tropical Cyclone | - |
| 0000 UTC 07 Sep | 42.9 | -62.9 | 35 | 996 | Post-Tropical Cyclone | - |
| 0600 UTC 07 Sep | 43.0 | -62.1 | 35 | 998 | Post-Tropical Cyclone | - |
| 1200 UTC 07 Sep | 43.2 | -61.1 | 35 | 1000 | Post-Tropical Cyclone | - |
| 1800 UTC 07 Sep | 43.6 | -60.1 | 35 | 1001 | Post-Tropical Cyclone | - |
| 0000 UTC 08 Sep | 44.3 | -59.3 | 35 | 1002 | Post-Tropical Cyclone | - |
| 0600 UTC 08 Sep | 45.2 | -58.3 | 35 | 1003 | Post-Tropical Cyclone | - |
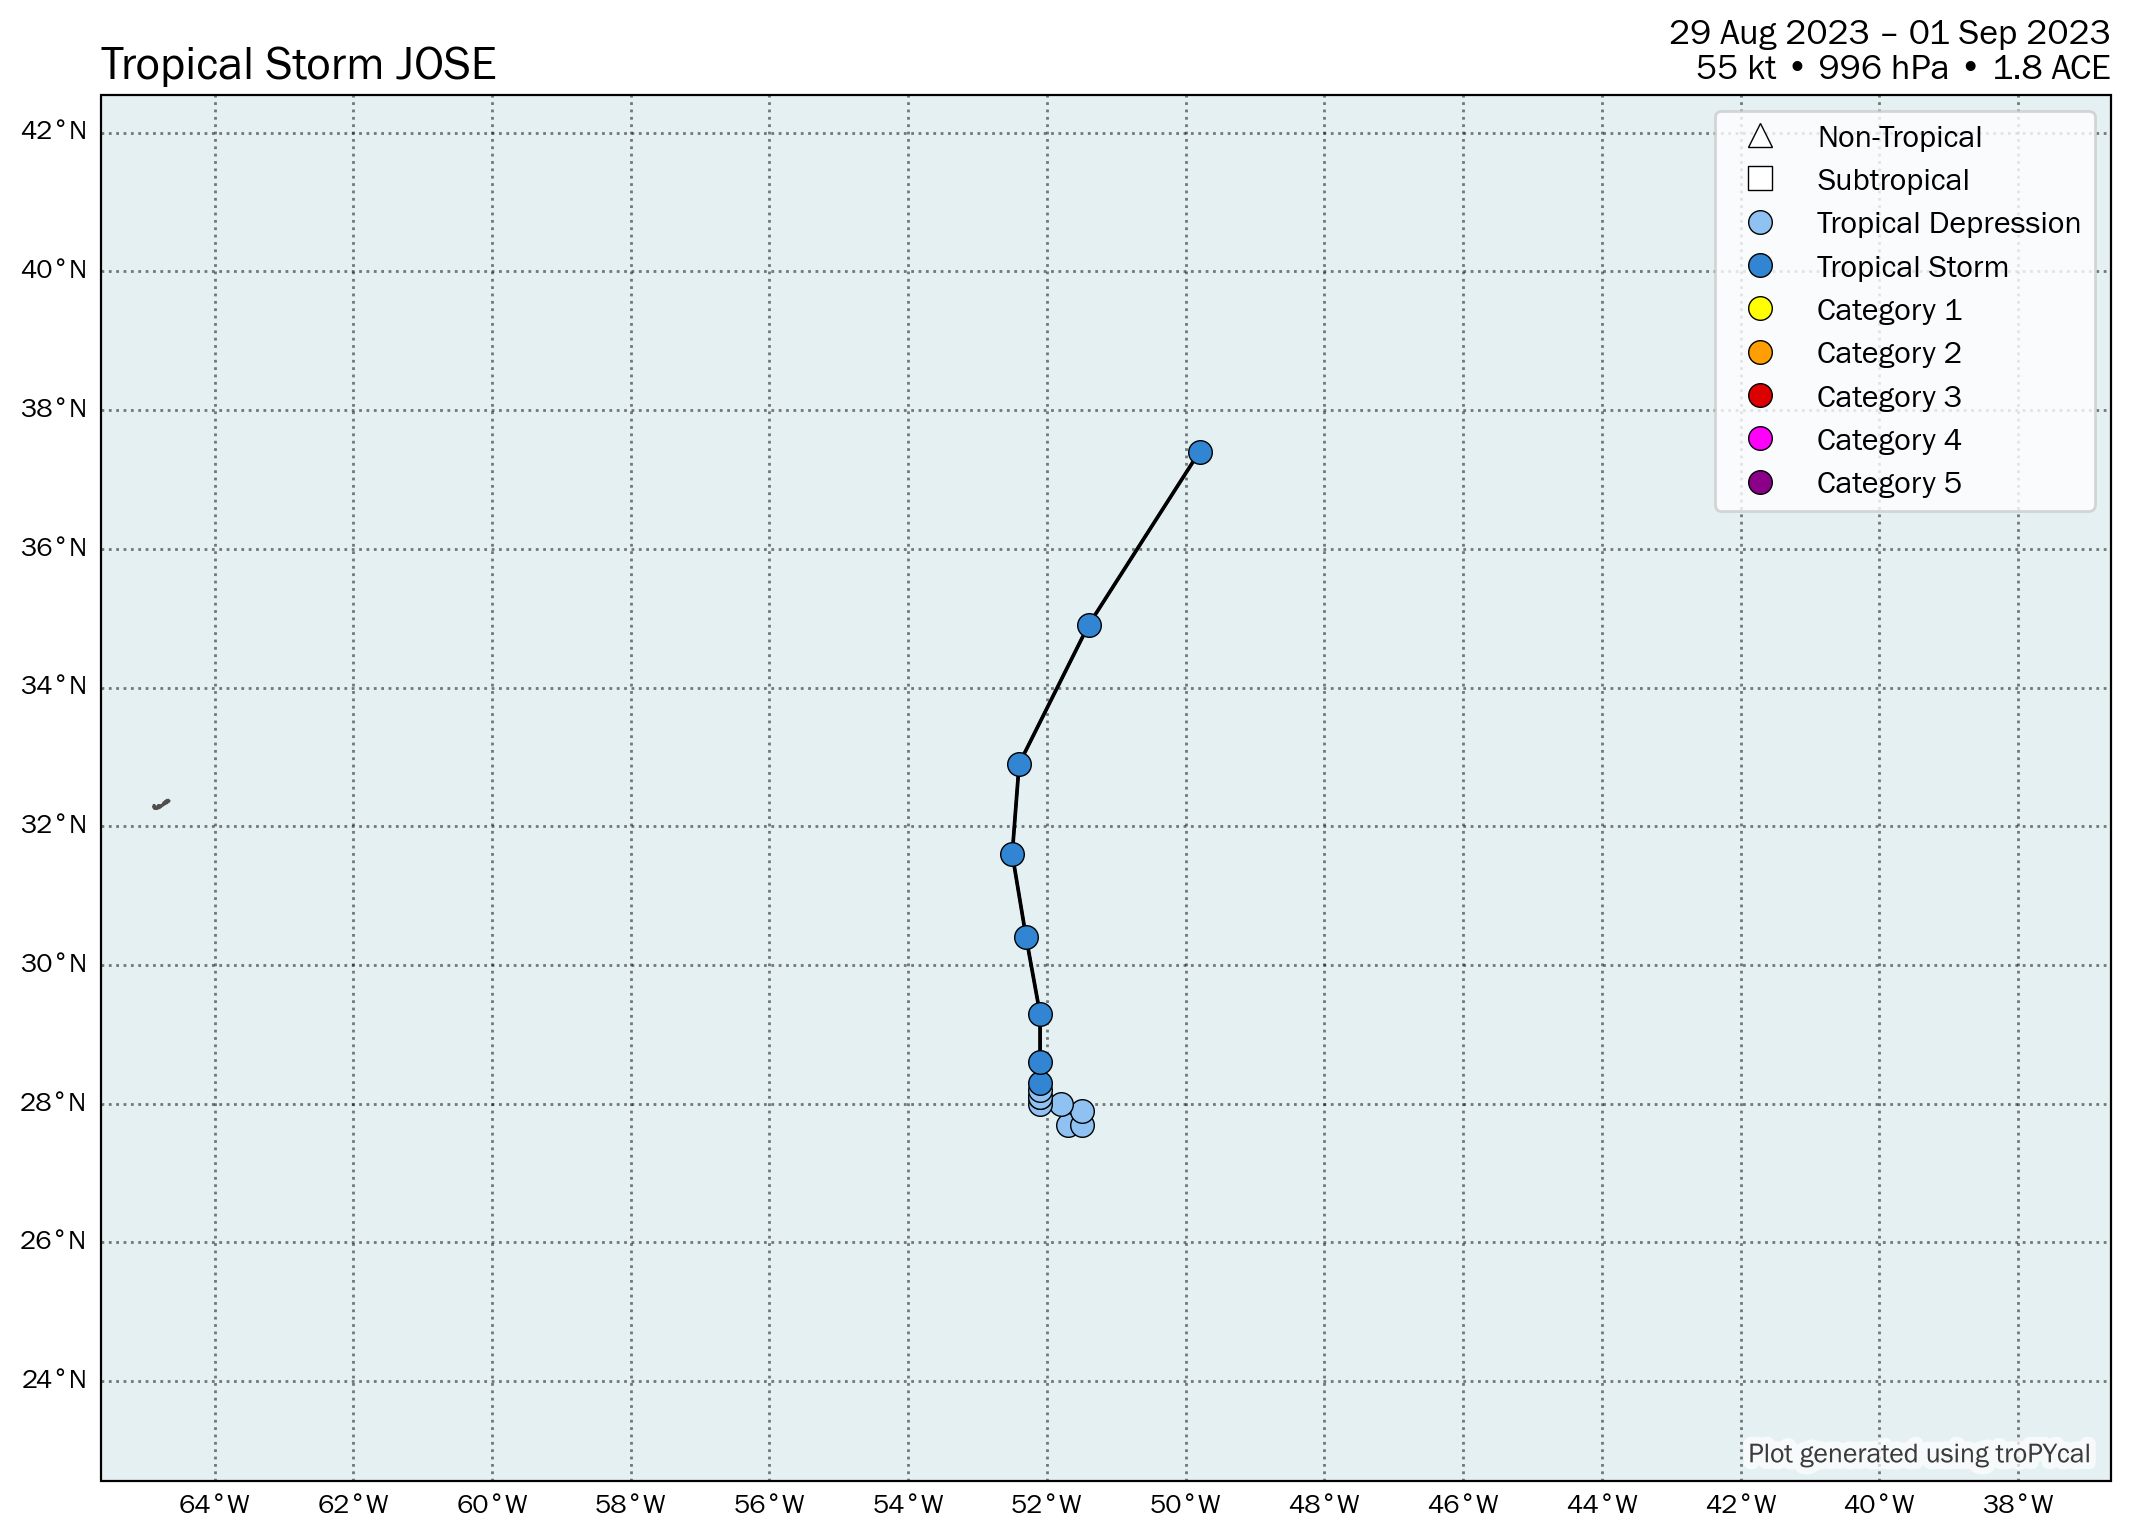
| Time (UTC) | Lat | Lon | Wind (mph) | Pressure | Storm Type | Category |
|---|---|---|---|---|---|---|
| 0000 UTC 29 Aug | 27.7 | -51.7 | 35 | 1014 | Tropical Depression | - |
| 0600 UTC 29 Aug | 27.7 | -51.5 | 35 | 1013 | Tropical Depression | - |
| 1200 UTC 29 Aug | 27.9 | -51.5 | 35 | 1012 | Tropical Depression | - |
| 1800 UTC 29 Aug | 28.0 | -51.8 | 35 | 1012 | Tropical Depression | - |
| 0000 UTC 30 Aug | 28.0 | -52.1 | 35 | 1011 | Tropical Depression | - |
| 0600 UTC 30 Aug | 28.1 | -52.1 | 35 | 1010 | Tropical Depression | - |
| 1200 UTC 30 Aug | 28.1 | -52.1 | 35 | 1010 | Tropical Depression | - |
| 1800 UTC 30 Aug | 28.2 | -52.1 | 35 | 1010 | Tropical Depression | - |
| 0000 UTC 31 Aug | 28.3 | -52.1 | 40 | 1009 | Tropical Storm | - |
| 0600 UTC 31 Aug | 28.6 | -52.1 | 45 | 1006 | Tropical Storm | - |
| 1200 UTC 31 Aug | 29.3 | -52.1 | 50 | 1004 | Tropical Storm | - |
| 1800 UTC 31 Aug | 30.4 | -52.3 | 60 | 999 | Tropical Storm | - |
| 0000 UTC 01 Sep | 31.6 | -52.5 | 65 | 996 | Tropical Storm | - |
| 0600 UTC 01 Sep | 32.9 | -52.4 | 65 | 996 | Tropical Storm | - |
| 1200 UTC 01 Sep | 34.9 | -51.4 | 60 | 997 | Tropical Storm | - |
| 1800 UTC 01 Sep | 37.4 | -49.8 | 60 | 997 | Tropical Storm | - |
Ensemble Viewer (Click image for loop)

| Time (UTC) | Lat | Lon | Wind (mph) | Pressure | Storm Type | Category |
|---|---|---|---|---|---|---|
| 0000 UTC 30 Aug | 14.9 | -21.3 | 30 | 1008 | Disturbance | - |
| 0600 UTC 30 Aug | 15.2 | -22.4 | 30 | 1007 | Disturbance | - |
| 1200 UTC 30 Aug | 15.4 | -23.4 | 30 | 1007 | Disturbance | - |
| 1800 UTC 30 Aug | 15.5 | -24.1 | 30 | 1007 | Disturbance | - |
| 0000 UTC 31 Aug | 15.8 | -24.8 | 30 | 1007 | Disturbance | - |
| 0600 UTC 31 Aug | 16.1 | -25.5 | 30 | 1007 | Disturbance | - |
| 1200 UTC 31 Aug | 16.5 | -26.2 | 35 | 1006 | Disturbance | - |
| 1800 UTC 31 Aug | 17.0 | -27.0 | 35 | 1006 | Tropical Depression | - |
| 0000 UTC 01 Sep | 17.7 | -27.6 | 35 | 1006 | Tropical Depression | - |
| 0600 UTC 01 Sep | 18.5 | -27.9 | 35 | 1006 | Tropical Depression | - |
| 1200 UTC 01 Sep | 19.3 | -28.1 | 35 | 1006 | Tropical Depression | - |
| 1800 UTC 01 Sep | 20.2 | -28.3 | 35 | 1006 | Tropical Depression | - |
| 0000 UTC 02 Sep | 21.1 | -28.5 | 40 | 1005 | Tropical Storm | - |
| 0600 UTC 02 Sep | 22.3 | -28.8 | 45 | 1004 | Tropical Storm | - |
| 1200 UTC 02 Sep | 23.5 | -29.4 | 50 | 1000 | Tropical Storm | - |
| 1800 UTC 02 Sep | 24.5 | -30.1 | 60 | 998 | Tropical Storm | - |
| 0000 UTC 03 Sep | 25.3 | -30.9 | 50 | 1000 | Tropical Storm | - |
| 0600 UTC 03 Sep | 26.0 | -31.5 | 45 | 1002 | Tropical Storm | - |
| 1200 UTC 03 Sep | 26.5 | -32.0 | 40 | 1006 | Tropical Storm | - |
| 1800 UTC 03 Sep | 26.9 | -32.7 | 40 | 1006 | Tropical Storm | - |
| 0000 UTC 04 Sep | 27.1 | -33.3 | 35 | 1007 | Tropical Depression | - |
| 0600 UTC 04 Sep | 27.4 | -33.6 | 35 | 1008 | Remnant Low | - |
| 1200 UTC 04 Sep | 27.7 | -34.0 | 35 | 1009 | Remnant Low | - |
| 1800 UTC 04 Sep | 27.9 | -34.4 | 35 | 1010 | Remnant Low | - |
| 0000 UTC 05 Sep | 28.0 | -34.5 | 30 | 1010 | Remnant Low | - |
| 0600 UTC 05 Sep | 28.2 | -34.6 | 30 | 1010 | Remnant Low | - |
| 1200 UTC 05 Sep | 28.3 | -34.6 | 30 | 1010 | Remnant Low | - |
| 1800 UTC 05 Sep | 28.3 | -34.2 | 30 | 1010 | Remnant Low | - |
| 0000 UTC 06 Sep | 28.0 | -33.7 | 30 | 1010 | Remnant Low | - |
| 0600 UTC 06 Sep | 27.6 | -33.1 | 30 | 1010 | Remnant Low | - |
| 1200 UTC 06 Sep | 27.4 | -32.2 | 30 | 1011 | Remnant Low | - |
| 1800 UTC 06 Sep | 26.7 | -31.8 | 30 | 1011 | Remnant Low | - |
| 0000 UTC 07 Sep | 26.0 | -31.8 | 35 | 1010 | Remnant Low | - |
| 0600 UTC 07 Sep | 25.4 | -32.2 | 35 | 1010 | Remnant Low | - |
| 1200 UTC 07 Sep | 24.6 | -32.7 | 30 | 1011 | Remnant Low | - |
| 1800 UTC 07 Sep | 24.0 | -33.8 | 30 | 1011 | Remnant Low | - |
| 0000 UTC 08 Sep | 23.2 | -34.8 | 30 | 1011 | Remnant Low | - |
| 0600 UTC 08 Sep | 22.3 | -36.0 | 30 | 1011 | Remnant Low | - |
| 1200 UTC 08 Sep | 21.5 | -37.6 | 30 | 1011 | Remnant Low | - |
| 1800 UTC 08 Sep | 20.5 | -39.2 | 30 | 1011 | Remnant Low | - |
| 0000 UTC 09 Sep | 19.6 | -40.9 | 30 | 1011 | Remnant Low | - |
| 0600 UTC 09 Sep | 18.4 | -42.0 | 30 | 1011 | Remnant Low | - |
| 1200 UTC 09 Sep | 17.6 | -42.9 | 30 | 1011 | Remnant Low | - |
| 1800 UTC 09 Sep | 16.8 | -43.7 | 30 | 1011 | Remnant Low | - |
| 0000 UTC 10 Sep | 16.0 | -44.5 | 25 | 1012 | Remnant Low | - |
| 0600 UTC 10 Sep | 15.4 | -45.5 | 25 | 1012 | Remnant Low | - |
| 1200 UTC 10 Sep | 15.0 | -46.3 | 25 | 1012 | Remnant Low | - |
| 1800 UTC 10 Sep | 14.8 | -46.9 | 25 | 1012 | Remnant Low | - |
| 0000 UTC 11 Sep | 14.6 | -47.4 | 25 | 1012 | Remnant Low | - |
| 0600 UTC 11 Sep | 14.5 | -47.9 | 25 | 1012 | Remnant Low | - |
| 1200 UTC 11 Sep | 14.4 | -48.1 | 25 | 1012 | Remnant Low | - |
| 1800 UTC 11 Sep | 14.4 | -48.3 | 25 | 1012 | Remnant Low | - |
| 0000 UTC 12 Sep | 14.4 | -48.3 | 25 | 1012 | Remnant Low | - |
| 0600 UTC 12 Sep | 14.5 | -48.3 | 25 | 1012 | Remnant Low | - |
| 1200 UTC 12 Sep | 14.6 | -48.2 | 25 | 1012 | Remnant Low | - |
| 1800 UTC 12 Sep | 14.7 | -48.1 | 20 | 1012 | Remnant Low | - |
| 0000 UTC 13 Sep | 14.9 | -48.0 | 20 | 1012 | Remnant Low | - |
| 0600 UTC 13 Sep | 15.1 | -47.8 | 20 | 1012 | Remnant Low | - |
| 1200 UTC 13 Sep | 15.0 | -47.6 | 20 | 1012 | Remnant Low | - |
| 1800 UTC 13 Sep | 14.9 | -47.7 | 20 | 1012 | Remnant Low | - |
| 0000 UTC 14 Sep | 14.7 | -47.8 | 20 | 1012 | Remnant Low | - |
| 0600 UTC 14 Sep | 14.5 | -48.0 | 20 | 1012 | Remnant Low | - |
| 1200 UTC 14 Sep | 14.2 | -48.4 | 20 | 1012 | Remnant Low | - |
| 1800 UTC 14 Sep | 13.6 | -48.8 | 20 | 1012 | Remnant Low | - |
| 0000 UTC 15 Sep | 13.0 | -49.2 | 20 | 1012 | Remnant Low | - |
| 0600 UTC 15 Sep | 12.4 | -49.1 | 20 | 1012 | Remnant Low | - |
| 1200 UTC 15 Sep | 11.8 | -48.8 | 20 | 1012 | Remnant Low | - |
Ensemble Viewer (Click image for loop)
Summary Plot
Recon-Derived Hovmoller
Recon-Derived Wind Swath
Recon-Derived MSLP Swath
| Time (UTC) | Lat | Lon | Wind (mph) | Pressure | Storm Type | Category |
|---|---|---|---|---|---|---|
| 1200 UTC 05 Sep | 12.2 | -39.6 | 35 | 1008 | Tropical Depression | - |
| 1800 UTC 05 Sep | 12.9 | -41.1 | 40 | 1006 | Tropical Storm | - |
| 0000 UTC 06 Sep | 13.2 | -42.5 | 50 | 1003 | Tropical Storm | - |
| 0600 UTC 06 Sep | 13.5 | -43.9 | 65 | 997 | Tropical Storm | - |
| 1200 UTC 06 Sep | 14.0 | -45.0 | 70 | 994 | Tropical Storm | - |
| 1800 UTC 06 Sep | 14.6 | -46.1 | 75 | 991 | Hurricane | 1 |
| 0000 UTC 07 Sep | 15.1 | -47.1 | 80 | 989 | Hurricane | 1 |
| 0600 UTC 07 Sep | 15.6 | -48.2 | 85 | 986 | Hurricane | 1 |
| 1200 UTC 07 Sep | 16.1 | -49.4 | 100 | 980 | Hurricane | 2 |
| 1800 UTC 07 Sep | 16.6 | -50.7 | 120 | 961 | Hurricane | 3 |
| 0000 UTC 08 Sep | 17.0 | -51.8 | 155 | 933 | Hurricane | 4 |
| 0600 UTC 08 Sep | 17.5 | -53.0 | 165 | 926 | Hurricane | 5 |
| 1200 UTC 08 Sep | 17.9 | -54.1 | 155 | 940 | Hurricane | 4 |
| 1800 UTC 08 Sep | 18.5 | -55.1 | 145 | 941 | Hurricane | 4 |
| 0000 UTC 09 Sep | 19.0 | -56.0 | 120 | 958 | Hurricane | 3 |
| 0600 UTC 09 Sep | 19.5 | -57.0 | 115 | 963 | Hurricane | 3 |
| 1200 UTC 09 Sep | 20.0 | -57.9 | 115 | 954 | Hurricane | 3 |
| 1800 UTC 09 Sep | 20.4 | -58.8 | 110 | 958 | Hurricane | 2 |
| 0000 UTC 10 Sep | 20.8 | -59.5 | 100 | 960 | Hurricane | 2 |
| 0600 UTC 10 Sep | 21.2 | -60.2 | 105 | 960 | Hurricane | 2 |
| 1200 UTC 10 Sep | 21.5 | -60.8 | 110 | 956 | Hurricane | 2 |
| 1800 UTC 10 Sep | 21.9 | -61.4 | 120 | 954 | Hurricane | 3 |
| 0000 UTC 11 Sep | 22.3 | -61.9 | 120 | 950 | Hurricane | 3 |
| 0600 UTC 11 Sep | 22.8 | -62.5 | 120 | 950 | Hurricane | 3 |
| 1200 UTC 11 Sep | 23.2 | -63.2 | 120 | 948 | Hurricane | 3 |
| 1800 UTC 11 Sep | 23.5 | -63.9 | 115 | 948 | Hurricane | 3 |
| 0000 UTC 12 Sep | 23.7 | -64.5 | 115 | 948 | Hurricane | 3 |
| 0600 UTC 12 Sep | 23.9 | -65.1 | 115 | 948 | Hurricane | 3 |
| 1200 UTC 12 Sep | 24.1 | -65.7 | 115 | 948 | Hurricane | 3 |
| 1800 UTC 12 Sep | 24.5 | -66.2 | 115 | 946 | Hurricane | 3 |
| 0000 UTC 13 Sep | 24.9 | -66.6 | 115 | 946 | Hurricane | 3 |
| 0600 UTC 13 Sep | 25.3 | -66.9 | 115 | 948 | Hurricane | 3 |
| 1200 UTC 13 Sep | 26.0 | -67.2 | 110 | 950 | Hurricane | 2 |
| 1800 UTC 13 Sep | 26.8 | -67.6 | 105 | 951 | Hurricane | 2 |
| 0000 UTC 14 Sep | 27.6 | -67.8 | 105 | 951 | Hurricane | 2 |
| 0600 UTC 14 Sep | 28.5 | -68.0 | 100 | 953 | Hurricane | 2 |
| 1200 UTC 14 Sep | 29.8 | -68.2 | 90 | 955 | Hurricane | 1 |
| 1800 UTC 14 Sep | 31.1 | -68.3 | 85 | 955 | Hurricane | 1 |
| 0000 UTC 15 Sep | 32.1 | -67.8 | 85 | 955 | Hurricane | 1 |
| 0600 UTC 15 Sep | 33.6 | -67.6 | 85 | 957 | Hurricane | 1 |
| 1200 UTC 15 Sep | 35.1 | -67.1 | 85 | 962 | Hurricane | 1 |
| 1800 UTC 15 Sep | 37.1 | -66.7 | 85 | 962 | Hurricane | 1 |
| 0000 UTC 16 Sep | 38.7 | -65.9 | 85 | 963 | Hurricane | 1 |
| 0600 UTC 16 Sep | 40.9 | -66.0 | 80 | 965 | Post-Tropical Cyclone | 1 |
| 1200 UTC 16 Sep | 42.7 | -66.3 | 75 | 965 | Post-Tropical Cyclone | 1 |
| 1800 UTC 16 Sep | 43.8 | -66.4 | 65 | 968 | Post-Tropical Cyclone | - |
| 2000 UTC 16 Sep | 44.3 | -66.3 | 65 | 970 | Post-Tropical Cyclone | - |
| 0000 UTC 17 Sep | 44.7 | -66.2 | 65 | 979 | Post-Tropical Cyclone | - |
| 0600 UTC 17 Sep | 45.9 | -64.8 | 60 | 986 | Post-Tropical Cyclone | - |
| 1200 UTC 17 Sep | 47.3 | -63.0 | 45 | 989 | Post-Tropical Cyclone | - |
| 1800 UTC 17 Sep | 48.6 | -60.1 | 45 | 989 | Post-Tropical Cyclone | - |
| 0000 UTC 18 Sep | 50.7 | -57.9 | 40 | 994 | Post-Tropical Cyclone | - |
| 0600 UTC 18 Sep | 51.7 | -53.2 | 40 | 994 | Post-Tropical Cyclone | - |
| 1200 UTC 18 Sep | 52.6 | -48.6 | 45 | 993 | Post-Tropical Cyclone | - |
| 1800 UTC 18 Sep | 53.0 | -42.0 | 45 | 993 | Post-Tropical Cyclone | - |
Ensemble Viewer (Click image for loop)
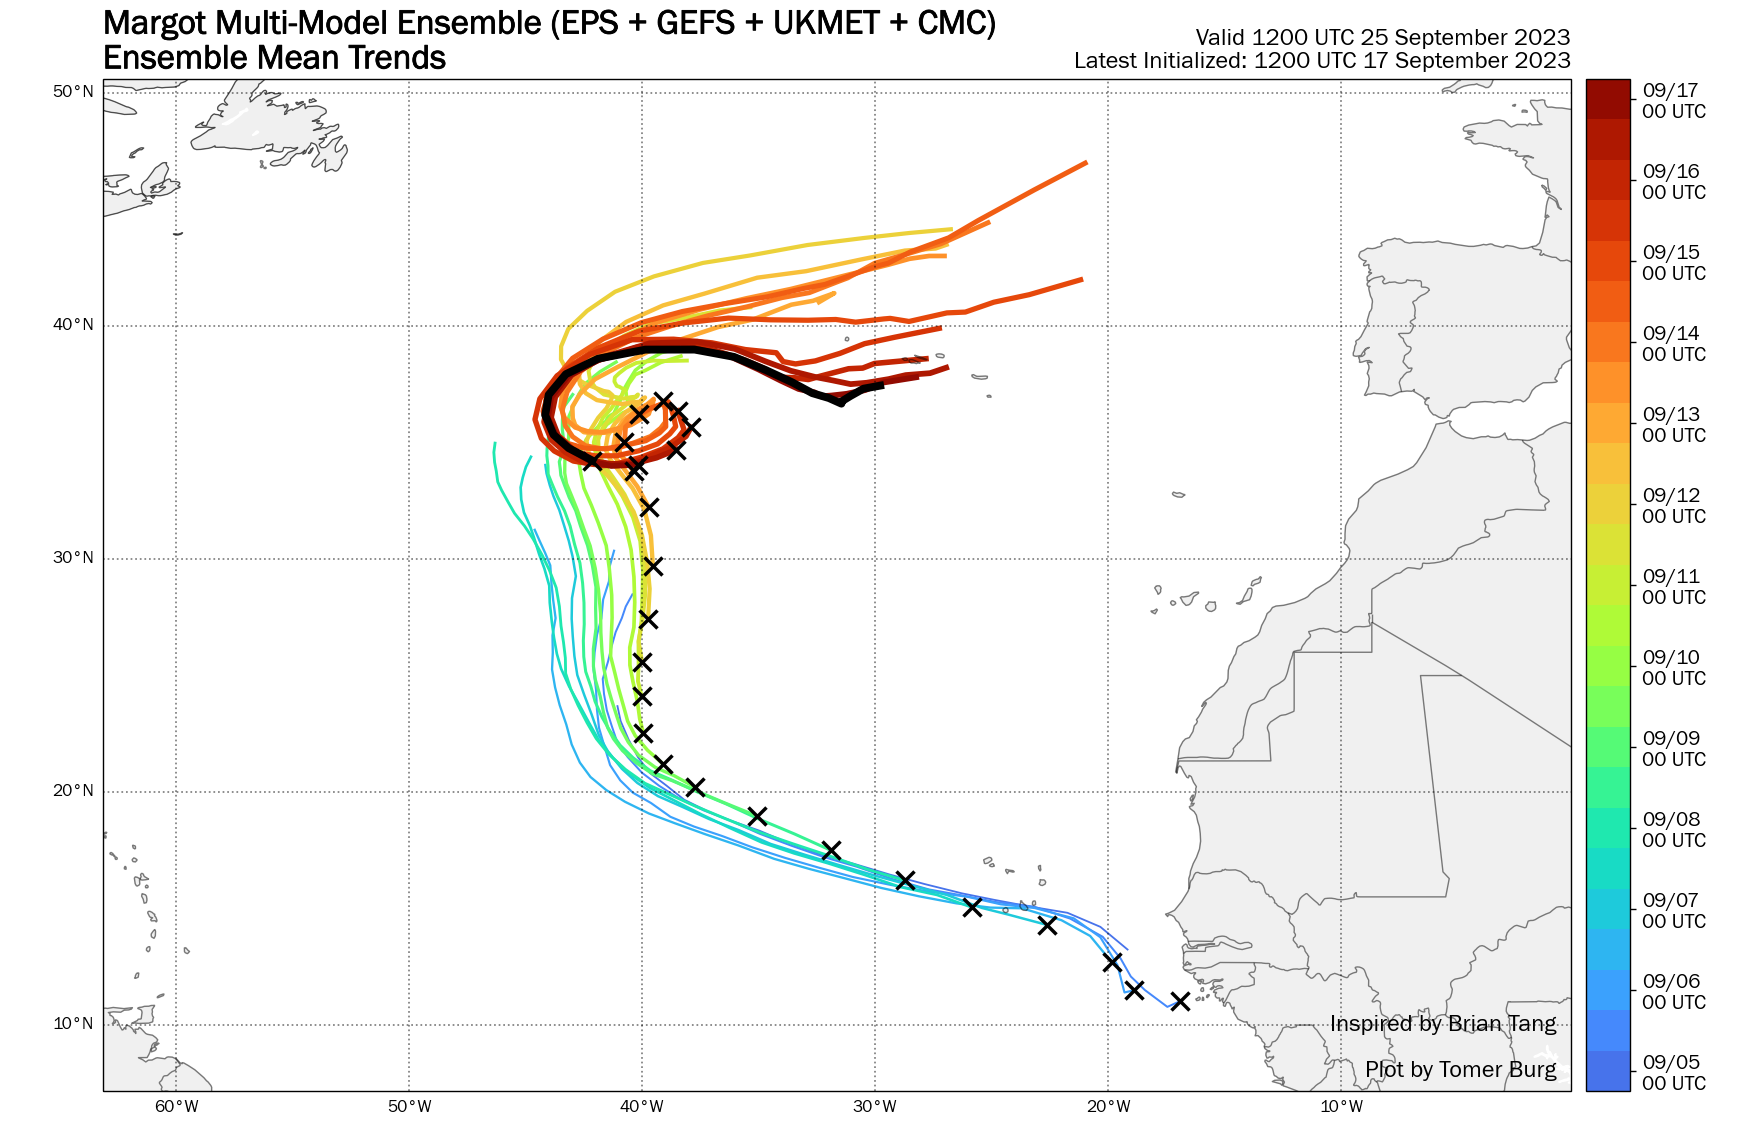
| Time (UTC) | Lat | Lon | Wind (mph) | Pressure | Storm Type | Category |
|---|---|---|---|---|---|---|
| 1200 UTC 07 Sep | 15.5 | -26.0 | 35 | 1006 | Tropical Depression | - |
| 1800 UTC 07 Sep | 16.0 | -27.3 | 40 | 1005 | Tropical Storm | - |
| 0000 UTC 08 Sep | 16.5 | -28.6 | 40 | 1005 | Tropical Storm | - |
| 0600 UTC 08 Sep | 17.1 | -30.1 | 40 | 1005 | Tropical Storm | - |
| 1200 UTC 08 Sep | 17.8 | -31.8 | 40 | 1005 | Tropical Storm | - |
| 1800 UTC 08 Sep | 18.5 | -33.6 | 40 | 1005 | Tropical Storm | - |
| 0000 UTC 09 Sep | 19.1 | -35.1 | 40 | 1005 | Tropical Storm | - |
| 0600 UTC 09 Sep | 19.7 | -36.4 | 45 | 1004 | Tropical Storm | - |
| 1200 UTC 09 Sep | 20.2 | -37.5 | 45 | 1004 | Tropical Storm | - |
| 1800 UTC 09 Sep | 20.7 | -38.3 | 45 | 1004 | Tropical Storm | - |
| 0000 UTC 10 Sep | 21.2 | -38.9 | 50 | 1003 | Tropical Storm | - |
| 0600 UTC 10 Sep | 21.8 | -39.4 | 50 | 1002 | Tropical Storm | - |
| 1200 UTC 10 Sep | 22.5 | -39.8 | 50 | 1000 | Tropical Storm | - |
| 1800 UTC 10 Sep | 23.3 | -40.0 | 60 | 998 | Tropical Storm | - |
| 0000 UTC 11 Sep | 24.0 | -40.0 | 65 | 996 | Tropical Storm | - |
| 0600 UTC 11 Sep | 24.7 | -40.0 | 65 | 993 | Tropical Storm | - |
| 1200 UTC 11 Sep | 25.5 | -40.0 | 70 | 990 | Tropical Storm | - |
| 1800 UTC 11 Sep | 26.4 | -39.9 | 75 | 986 | Hurricane | 1 |
| 0000 UTC 12 Sep | 27.5 | -39.6 | 80 | 981 | Hurricane | 1 |
| 0600 UTC 12 Sep | 28.6 | -39.4 | 85 | 977 | Hurricane | 1 |
| 1200 UTC 12 Sep | 29.8 | -39.3 | 85 | 974 | Hurricane | 1 |
| 1800 UTC 12 Sep | 31.0 | -39.4 | 85 | 972 | Hurricane | 1 |
| 0000 UTC 13 Sep | 32.1 | -39.6 | 85 | 970 | Hurricane | 1 |
| 0600 UTC 13 Sep | 33.0 | -39.9 | 90 | 969 | Hurricane | 1 |
| 1200 UTC 13 Sep | 33.7 | -40.3 | 90 | 969 | Hurricane | 1 |
| 1800 UTC 13 Sep | 34.4 | -40.6 | 85 | 970 | Hurricane | 1 |
| 0000 UTC 14 Sep | 35.1 | -40.7 | 85 | 972 | Hurricane | 1 |
| 0600 UTC 14 Sep | 35.8 | -40.5 | 80 | 974 | Hurricane | 1 |
| 1200 UTC 14 Sep | 36.3 | -40.1 | 80 | 976 | Hurricane | 1 |
| 1800 UTC 14 Sep | 36.6 | -39.6 | 80 | 978 | Hurricane | 1 |
| 0000 UTC 15 Sep | 36.7 | -39.1 | 75 | 980 | Hurricane | 1 |
| 0600 UTC 15 Sep | 36.7 | -38.6 | 70 | 982 | Tropical Storm | - |
| 1200 UTC 15 Sep | 36.5 | -38.1 | 65 | 984 | Tropical Storm | - |
| 1800 UTC 15 Sep | 36.1 | -37.8 | 65 | 986 | Tropical Storm | - |
| 0000 UTC 16 Sep | 35.7 | -37.8 | 65 | 988 | Tropical Storm | - |
| 0600 UTC 16 Sep | 35.2 | -38.0 | 65 | 990 | Tropical Storm | - |
| 1200 UTC 16 Sep | 34.7 | -38.5 | 60 | 993 | Tropical Storm | - |
| 1800 UTC 16 Sep | 34.3 | -39.2 | 50 | 996 | Tropical Storm | - |
| 0000 UTC 17 Sep | 34.0 | -40.1 | 45 | 999 | Remnant Low | - |
| 0600 UTC 17 Sep | 34.0 | -41.1 | 40 | 1001 | Remnant Low | - |
| 1200 UTC 17 Sep | 34.3 | -42.0 | 40 | 1003 | Remnant Low | - |
| 1800 UTC 17 Sep | 34.7 | -43.0 | 40 | 1005 | Remnant Low | - |
| 0000 UTC 18 Sep | 35.3 | -43.6 | 35 | 1006 | Remnant Low | - |
| 0600 UTC 18 Sep | 36.0 | -43.8 | 35 | 1007 | Remnant Low | - |
| 1200 UTC 18 Sep | 36.8 | -43.6 | 35 | 1008 | Remnant Low | - |
| 1800 UTC 18 Sep | 37.8 | -42.7 | 35 | 1009 | Remnant Low | - |
Ensemble Viewer (Click image for loop)
Summary Plot
Recon-Derived Wind Swath
Recon-Derived MSLP Swath
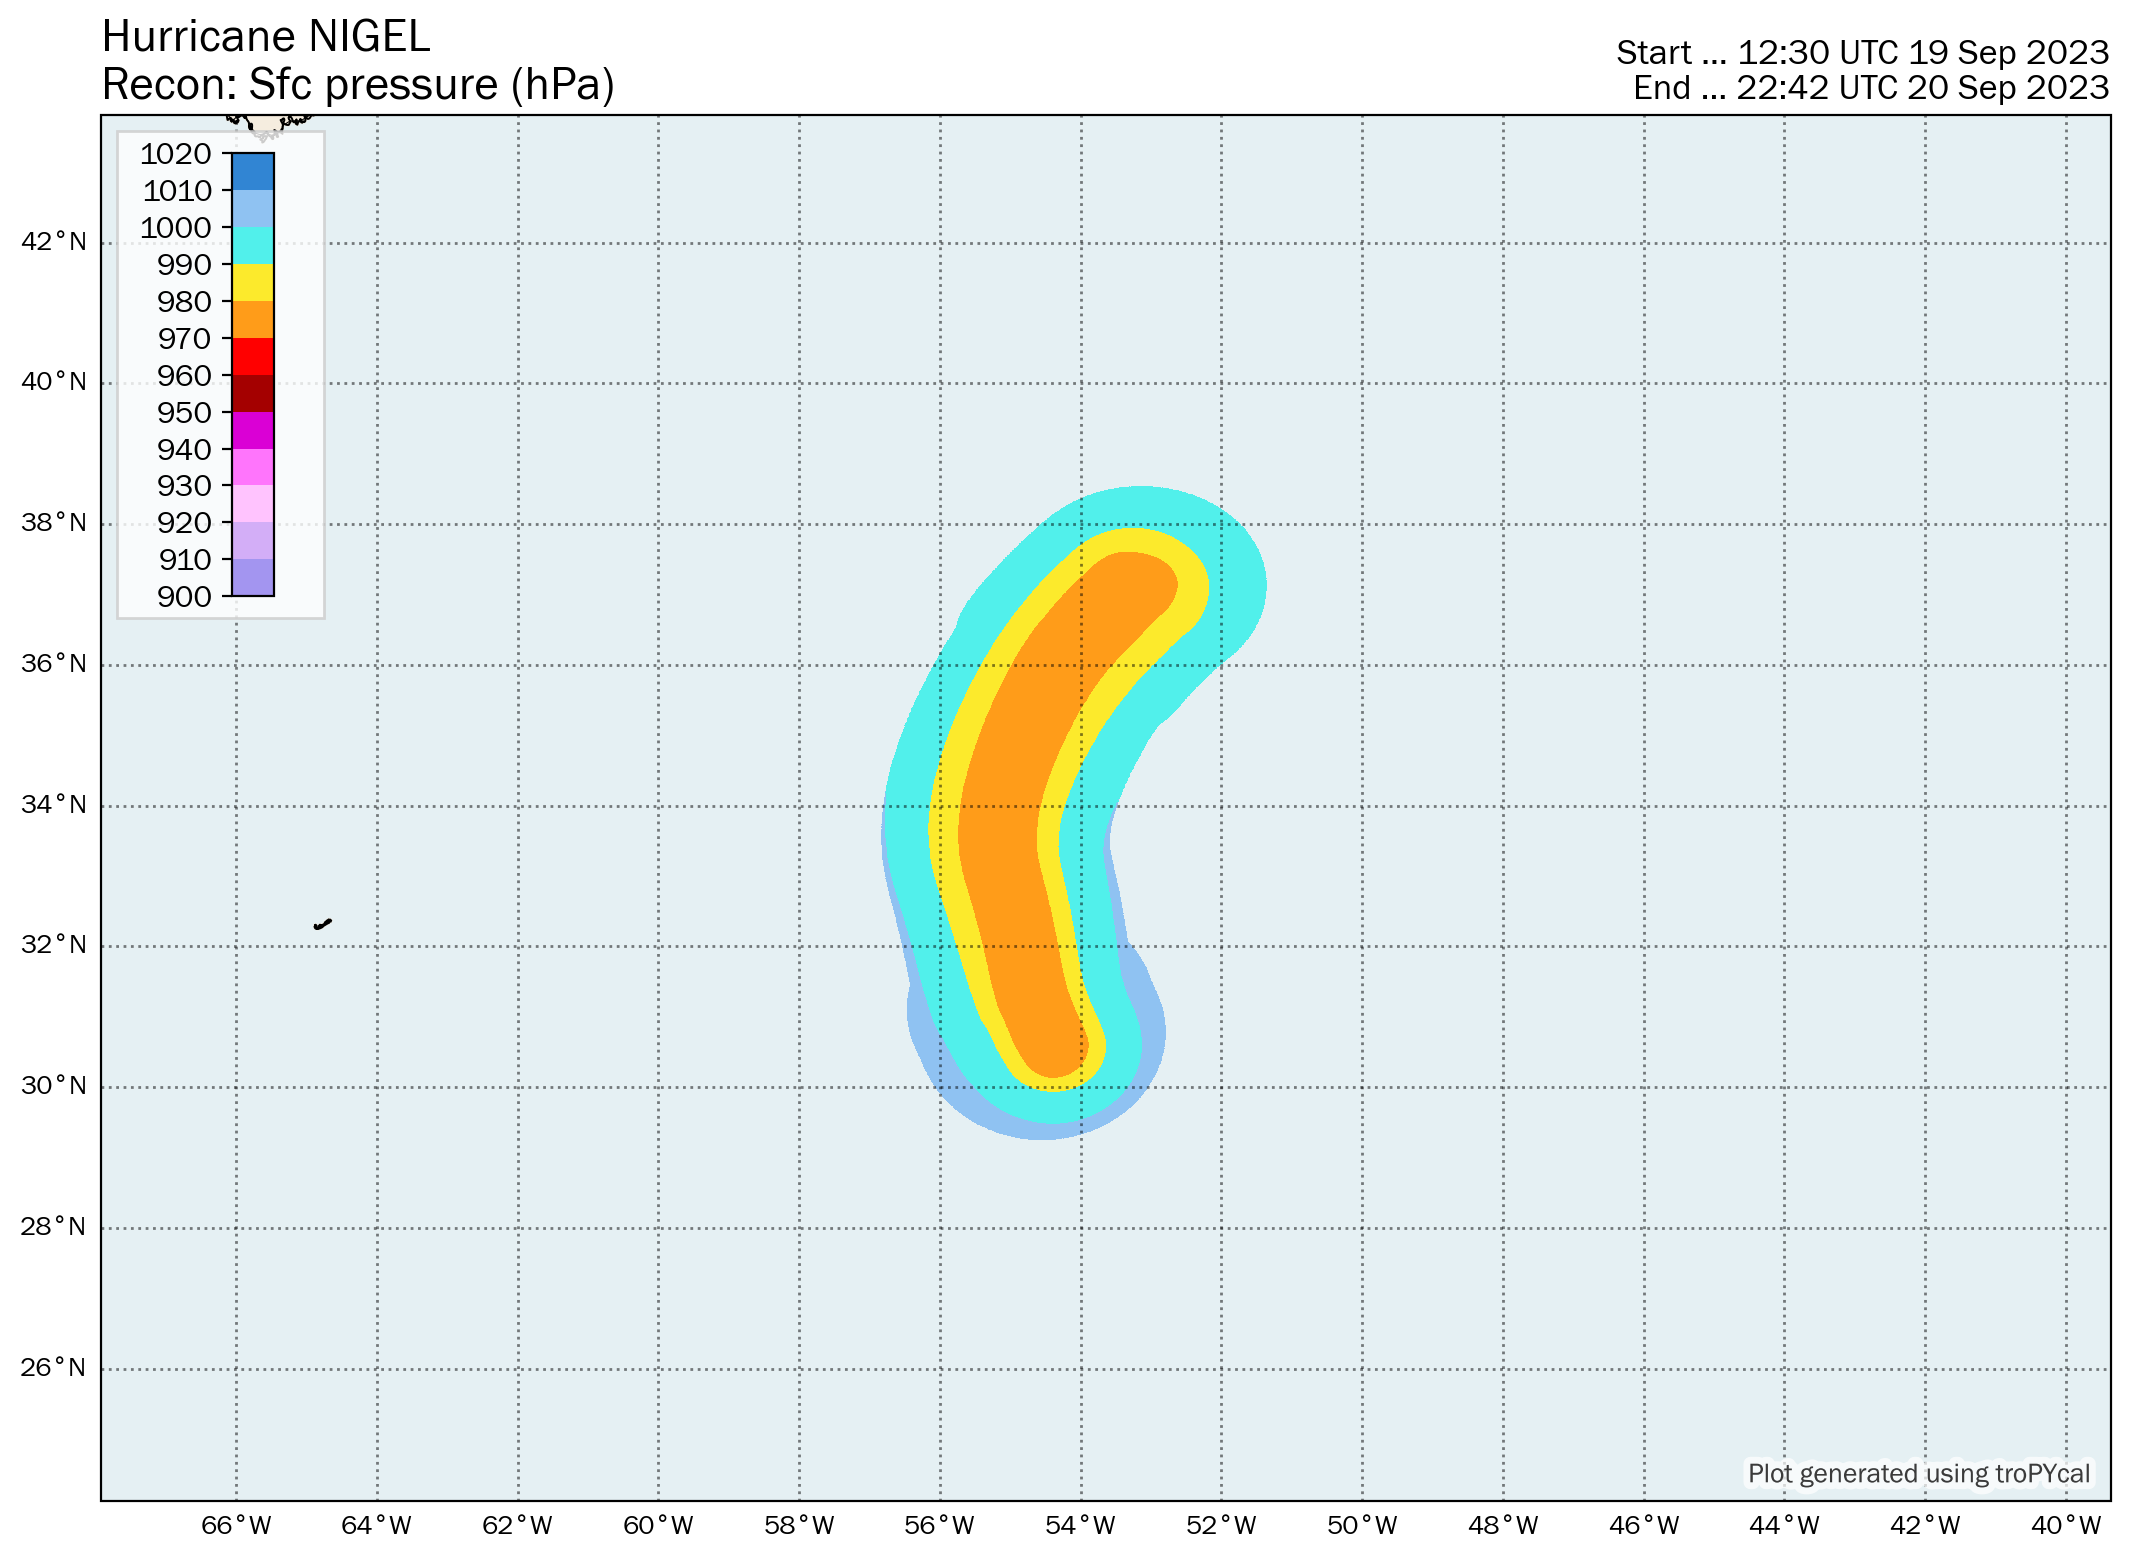
| Time (UTC) | Lat | Lon | Wind (mph) | Pressure | Storm Type | Category |
|---|---|---|---|---|---|---|
| 0600 UTC 15 Sep | 13.6 | -42.2 | 35 | 1007 | Tropical Depression | - |
| 1200 UTC 15 Sep | 14.3 | -43.2 | 35 | 1007 | Tropical Depression | - |
| 1800 UTC 15 Sep | 15.2 | -44.0 | 35 | 1007 | Tropical Depression | - |
| 0000 UTC 16 Sep | 16.1 | -44.8 | 35 | 1007 | Tropical Depression | - |
| 0600 UTC 16 Sep | 17.4 | -45.4 | 35 | 1007 | Tropical Depression | - |
| 1200 UTC 16 Sep | 18.7 | -46.0 | 35 | 1006 | Tropical Depression | - |
| 1800 UTC 16 Sep | 20.1 | -46.7 | 35 | 1006 | Tropical Depression | - |
| 0000 UTC 17 Sep | 21.4 | -47.6 | 40 | 1005 | Tropical Storm | - |
| 0600 UTC 17 Sep | 22.5 | -48.3 | 50 | 1001 | Tropical Storm | - |
| 1200 UTC 17 Sep | 23.5 | -48.8 | 60 | 997 | Tropical Storm | - |
| 1800 UTC 17 Sep | 24.5 | -49.4 | 65 | 994 | Tropical Storm | - |
| 0000 UTC 18 Sep | 25.3 | -50.0 | 70 | 992 | Tropical Storm | - |
| 0600 UTC 18 Sep | 26.0 | -50.6 | 75 | 987 | Hurricane | 1 |
| 1200 UTC 18 Sep | 26.8 | -51.1 | 75 | 987 | Hurricane | 1 |
| 1800 UTC 18 Sep | 27.5 | -51.7 | 80 | 982 | Hurricane | 1 |
| 0000 UTC 19 Sep | 28.2 | -52.4 | 85 | 979 | Hurricane | 1 |
| 0600 UTC 19 Sep | 29.0 | -53.2 | 85 | 979 | Hurricane | 1 |
| 1200 UTC 19 Sep | 29.9 | -54.0 | 90 | 975 | Hurricane | 1 |
| 1800 UTC 19 Sep | 31.1 | -54.7 | 100 | 972 | Hurricane | 2 |
| 0000 UTC 20 Sep | 32.4 | -55.0 | 100 | 971 | Hurricane | 2 |
| 0600 UTC 20 Sep | 33.7 | -55.2 | 100 | 971 | Hurricane | 2 |
| 1200 UTC 20 Sep | 35.2 | -54.7 | 90 | 972 | Hurricane | 1 |
| 1800 UTC 20 Sep | 36.7 | -53.6 | 90 | 972 | Hurricane | 1 |
| 0000 UTC 21 Sep | 38.3 | -51.6 | 90 | 973 | Hurricane | 1 |
| 0600 UTC 21 Sep | 40.0 | -49.2 | 85 | 975 | Hurricane | 1 |
| 1200 UTC 21 Sep | 41.3 | -46.3 | 85 | 975 | Hurricane | 1 |
| 1800 UTC 21 Sep | 42.8 | -42.8 | 80 | 975 | Hurricane | 1 |
| 0000 UTC 22 Sep | 44.3 | -38.7 | 75 | 975 | Hurricane | 1 |
| 0600 UTC 22 Sep | 45.4 | -34.3 | 70 | 974 | Post-Tropical Cyclone | - |
| 1200 UTC 22 Sep | 47.2 | -30.2 | 65 | 972 | Post-Tropical Cyclone | - |
| 1800 UTC 22 Sep | 48.9 | -26.8 | 65 | 971 | Post-Tropical Cyclone | - |
| 0000 UTC 23 Sep | 50.9 | -24.0 | 65 | 969 | Post-Tropical Cyclone | - |
| 0600 UTC 23 Sep | 53.3 | -22.2 | 65 | 967 | Post-Tropical Cyclone | - |
| 1200 UTC 23 Sep | 55.6 | -22.7 | 65 | 964 | Post-Tropical Cyclone | - |
| 1800 UTC 23 Sep | 57.7 | -23.2 | 65 | 961 | Post-Tropical Cyclone | - |
| 0000 UTC 24 Sep | 58.3 | -25.6 | 60 | 958 | Post-Tropical Cyclone | - |
| 0600 UTC 24 Sep | 57.4 | -27.4 | 60 | 958 | Post-Tropical Cyclone | - |
| 1200 UTC 24 Sep | 56.1 | -26.7 | 50 | 961 | Post-Tropical Cyclone | - |
| 1800 UTC 24 Sep | 56.4 | -23.5 | 50 | 964 | Post-Tropical Cyclone | - |
| 0000 UTC 25 Sep | 58.0 | -20.9 | 45 | 969 | Post-Tropical Cyclone | - |
| 0600 UTC 25 Sep | 60.1 | -18.6 | 45 | 971 | Post-Tropical Cyclone | - |
| 1200 UTC 25 Sep | 61.0 | -18.5 | 45 | 972 | Post-Tropical Cyclone | - |
| 1800 UTC 25 Sep | 61.5 | -19.4 | 45 | 974 | Post-Tropical Cyclone | - |
| 0000 UTC 26 Sep | 61.5 | -20.9 | 45 | 976 | Post-Tropical Cyclone | - |
| 0600 UTC 26 Sep | 61.5 | -22.5 | 45 | 977 | Post-Tropical Cyclone | - |
| 1200 UTC 26 Sep | 61.5 | -23.3 | 45 | 977 | Post-Tropical Cyclone | - |
Ensemble Viewer (Click image for loop)
Summary Plot
Recon-Derived Hovmoller
Recon-Derived Wind Swath
Recon-Derived MSLP Swath
| Time (UTC) | Lat | Lon | Wind (mph) | Pressure | Storm Type | Category |
|---|---|---|---|---|---|---|
| 1200 UTC 21 Sep | 28.5 | -76.0 | 35 | 1012 | Disturbance | - |
| 1800 UTC 21 Sep | 29.0 | -75.6 | 35 | 1012 | Disturbance | - |
| 0000 UTC 22 Sep | 29.5 | -75.3 | 40 | 1008 | Disturbance | - |
| 0600 UTC 22 Sep | 30.3 | -75.1 | 45 | 1002 | Disturbance | - |
| 1200 UTC 22 Sep | 31.6 | -75.5 | 60 | 996 | Disturbance | - |
| 1800 UTC 22 Sep | 32.7 | -76.1 | 70 | 989 | Tropical Storm | - |
| 0000 UTC 23 Sep | 33.3 | -76.6 | 70 | 983 | Tropical Storm | - |
| 0600 UTC 23 Sep | 33.8 | -77.1 | 70 | 981 | Tropical Storm | - |
| 1015 UTC 23 Sep | 34.7 | -77.1 | 70 | 981 | Tropical Storm | - |
| 1200 UTC 23 Sep | 35.1 | -77.1 | 60 | 982 | Tropical Storm | - |
| 1800 UTC 23 Sep | 36.3 | -77.5 | 45 | 997 | Tropical Storm | - |
| 0000 UTC 24 Sep | 36.8 | -77.6 | 35 | 1002 | Post-Tropical Cyclone | - |
| 0600 UTC 24 Sep | 37.2 | -77.6 | 30 | 1006 | Post-Tropical Cyclone | - |
| 1200 UTC 24 Sep | 37.9 | -77.4 | 25 | 1009 | Post-Tropical Cyclone | - |
| 1800 UTC 24 Sep | 38.9 | -76.9 | 25 | 1010 | Post-Tropical Cyclone | - |
Ensemble Viewer (Click image for loop)
Summary Plot
Recon-Derived Hovmoller
Recon-Derived Wind Swath
Recon-Derived MSLP Swath
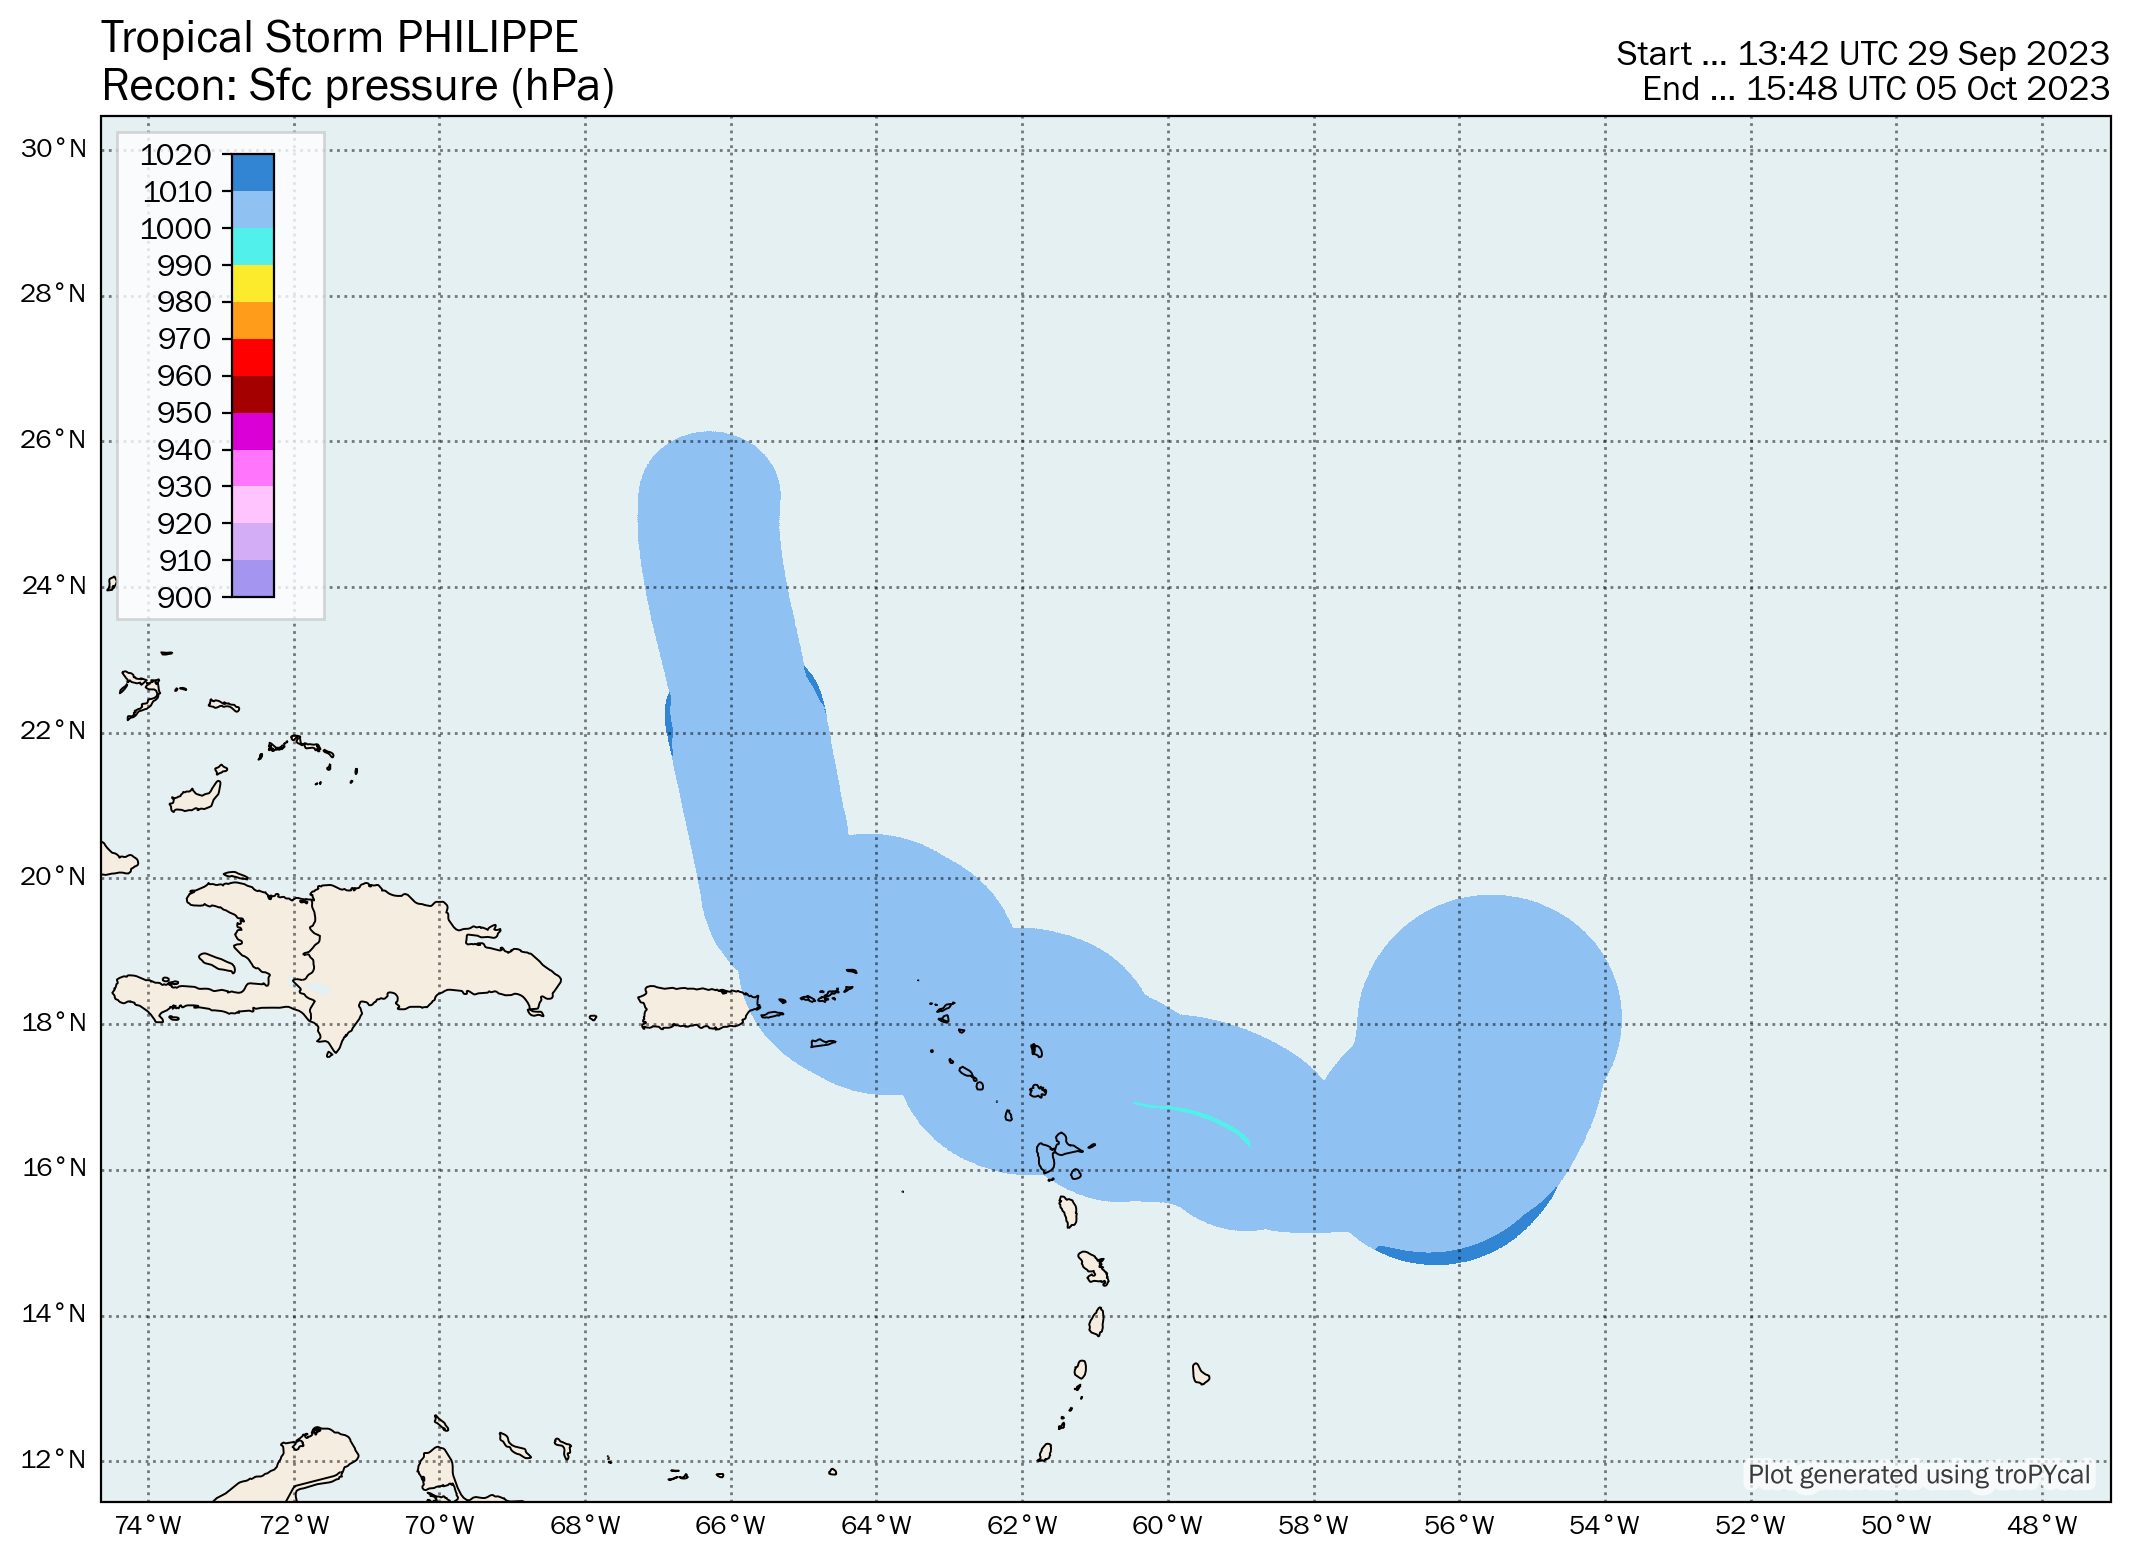
| Time (UTC) | Lat | Lon | Wind (mph) | Pressure | Storm Type | Category |
|---|---|---|---|---|---|---|
| 0600 UTC 23 Sep | 15.5 | -36.6 | 35 | 1007 | Tropical Depression | - |
| 1200 UTC 23 Sep | 15.6 | -38.0 | 35 | 1007 | Tropical Depression | - |
| 1800 UTC 23 Sep | 15.7 | -39.1 | 40 | 1005 | Tropical Storm | - |
| 0000 UTC 24 Sep | 15.8 | -39.8 | 45 | 1003 | Tropical Storm | - |
| 0600 UTC 24 Sep | 16.0 | -40.5 | 50 | 1001 | Tropical Storm | - |
| 1200 UTC 24 Sep | 16.3 | -41.3 | 50 | 1000 | Tropical Storm | - |
| 1800 UTC 24 Sep | 16.6 | -42.0 | 50 | 1000 | Tropical Storm | - |
| 0000 UTC 25 Sep | 16.9 | -42.9 | 50 | 1000 | Tropical Storm | - |
| 0600 UTC 25 Sep | 17.1 | -43.8 | 60 | 998 | Tropical Storm | - |
| 1200 UTC 25 Sep | 17.1 | -44.8 | 60 | 998 | Tropical Storm | - |
| 1800 UTC 25 Sep | 17.1 | -46.2 | 50 | 1000 | Tropical Storm | - |
| 0000 UTC 26 Sep | 17.4 | -47.3 | 50 | 1001 | Tropical Storm | - |
| 0600 UTC 26 Sep | 17.5 | -48.5 | 50 | 1001 | Tropical Storm | - |
| 1200 UTC 26 Sep | 17.4 | -49.7 | 45 | 1003 | Tropical Storm | - |
| 1800 UTC 26 Sep | 17.1 | -50.8 | 45 | 1003 | Tropical Storm | - |
| 0000 UTC 27 Sep | 17.2 | -51.6 | 45 | 1003 | Tropical Storm | - |
| 0600 UTC 27 Sep | 17.4 | -52.3 | 45 | 1003 | Tropical Storm | - |
| 1200 UTC 27 Sep | 17.5 | -53.0 | 50 | 1000 | Tropical Storm | - |
| 1800 UTC 27 Sep | 17.8 | -53.7 | 50 | 1000 | Tropical Storm | - |
| 0000 UTC 28 Sep | 18.1 | -54.3 | 45 | 1002 | Tropical Storm | - |
| 0600 UTC 28 Sep | 18.5 | -54.5 | 45 | 1002 | Tropical Storm | - |
| 1200 UTC 28 Sep | 18.7 | -54.7 | 45 | 1002 | Tropical Storm | - |
| 1800 UTC 28 Sep | 18.6 | -54.8 | 45 | 1002 | Tropical Storm | - |
| 0000 UTC 29 Sep | 18.5 | -54.9 | 45 | 1002 | Tropical Storm | - |
| 0600 UTC 29 Sep | 18.4 | -55.0 | 45 | 1002 | Tropical Storm | - |
| 1200 UTC 29 Sep | 18.2 | -55.3 | 50 | 1002 | Tropical Storm | - |
| 1800 UTC 29 Sep | 18.0 | -55.6 | 50 | 1002 | Tropical Storm | - |
| 0000 UTC 30 Sep | 17.6 | -55.7 | 50 | 1001 | Tropical Storm | - |
| 0600 UTC 30 Sep | 17.2 | -55.8 | 50 | 999 | Tropical Storm | - |
| 1200 UTC 30 Sep | 16.8 | -56.0 | 50 | 999 | Tropical Storm | - |
| 1800 UTC 30 Sep | 16.4 | -56.3 | 60 | 998 | Tropical Storm | - |
| 0000 UTC 01 Oct | 16.1 | -56.7 | 60 | 998 | Tropical Storm | - |
| 0600 UTC 01 Oct | 16.0 | -57.5 | 60 | 999 | Tropical Storm | - |
| 1200 UTC 01 Oct | 16.0 | -58.4 | 50 | 1001 | Tropical Storm | - |
| 1800 UTC 01 Oct | 16.2 | -58.8 | 50 | 1001 | Tropical Storm | - |
| 0000 UTC 02 Oct | 16.5 | -59.0 | 50 | 999 | Tropical Storm | - |
| 0600 UTC 02 Oct | 16.8 | -59.7 | 50 | 999 | Tropical Storm | - |
| 1200 UTC 02 Oct | 16.9 | -60.5 | 50 | 1000 | Tropical Storm | - |
| 1800 UTC 02 Oct | 17.3 | -61.2 | 50 | 1001 | Tropical Storm | - |
| 2245 UTC 02 Oct | 17.6 | -61.8 | 50 | 1001 | Tropical Storm | - |
| 0000 UTC 03 Oct | 17.6 | -61.9 | 50 | 1001 | Tropical Storm | - |
| 0600 UTC 03 Oct | 18.1 | -62.7 | 50 | 1001 | Tropical Storm | - |
| 1200 UTC 03 Oct | 18.6 | -63.6 | 45 | 1003 | Tropical Storm | - |
| 1800 UTC 03 Oct | 19.1 | -64.5 | 45 | 1004 | Tropical Storm | - |
| 0000 UTC 04 Oct | 19.5 | -65.2 | 45 | 1004 | Tropical Storm | - |
| 0600 UTC 04 Oct | 20.2 | -65.4 | 45 | 1004 | Tropical Storm | - |
| 1200 UTC 04 Oct | 21.2 | -65.6 | 45 | 1004 | Tropical Storm | - |
| 1800 UTC 04 Oct | 22.2 | -65.8 | 40 | 1004 | Tropical Storm | - |
| 0000 UTC 05 Oct | 23.1 | -66.0 | 40 | 1004 | Tropical Storm | - |
| 0600 UTC 05 Oct | 24.0 | -66.2 | 45 | 1004 | Tropical Storm | - |
| 1200 UTC 05 Oct | 25.1 | -66.3 | 50 | 1004 | Tropical Storm | - |
| 1800 UTC 05 Oct | 26.4 | -66.1 | 50 | 1004 | Tropical Storm | - |
| 0000 UTC 06 Oct | 27.6 | -66.0 | 50 | 1004 | Tropical Storm | - |
| 0600 UTC 06 Oct | 28.7 | -65.5 | 50 | 1003 | Tropical Storm | - |
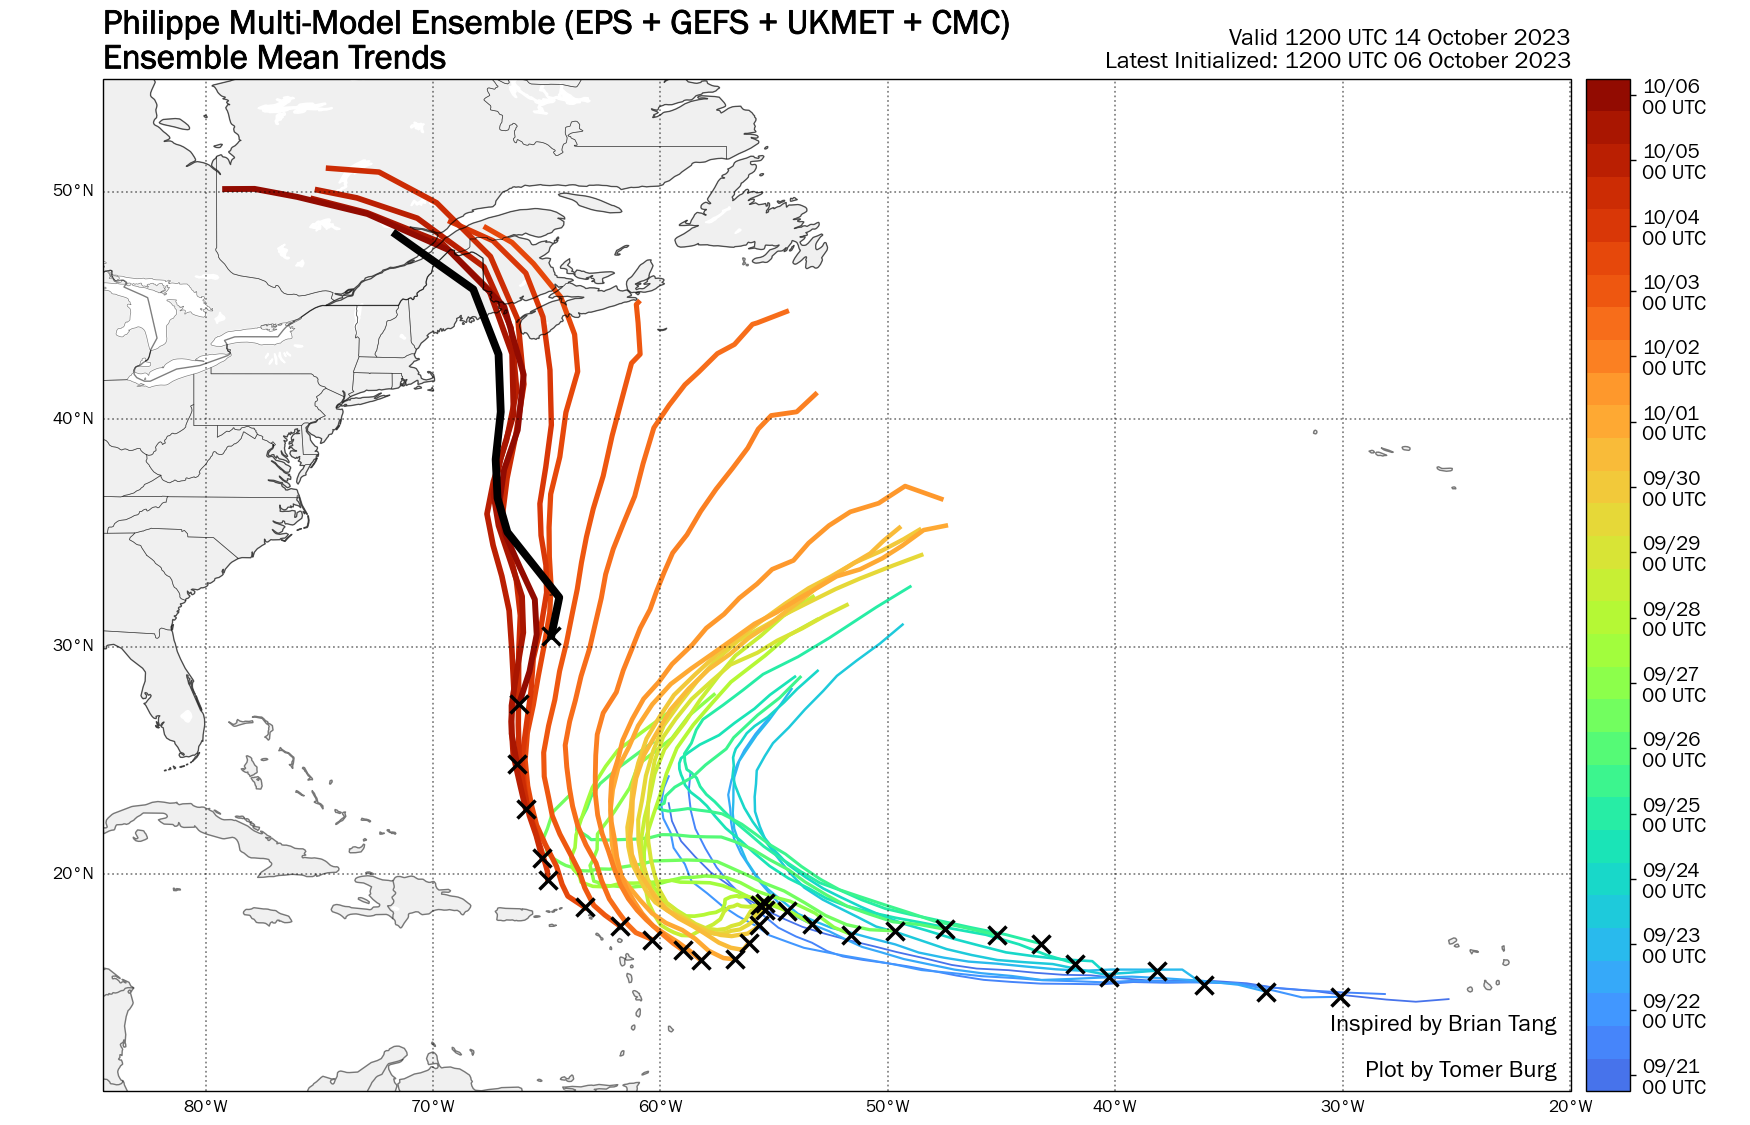
Ensemble Viewer (Click image for loop)
| Time (UTC) | Lat | Lon | Wind (mph) | Pressure | Storm Type | Category |
|---|---|---|---|---|---|---|
| 0600 UTC 28 Sep | 15.6 | -44.5 | 40 | 1005 | Tropical Storm | - |
| 1200 UTC 28 Sep | 16.9 | -45.1 | 40 | 1004 | Tropical Storm | - |
| 1800 UTC 28 Sep | 17.7 | -45.8 | 40 | 1004 | Tropical Storm | - |
| 0000 UTC 29 Sep | 18.2 | -46.2 | 45 | 1002 | Tropical Storm | - |
| 0600 UTC 29 Sep | 18.6 | -46.4 | 50 | 999 | Tropical Storm | - |
| 1200 UTC 29 Sep | 19.1 | -46.7 | 50 | 999 | Tropical Storm | - |
| 1800 UTC 29 Sep | 19.8 | -47.5 | 50 | 1000 | Tropical Storm | - |
| 0000 UTC 30 Sep | 20.2 | -48.4 | 50 | 1000 | Tropical Storm | - |
| 0600 UTC 30 Sep | 20.5 | -49.1 | 50 | 1000 | Tropical Storm | - |
| 1200 UTC 30 Sep | 21.0 | -50.0 | 45 | 1002 | Tropical Storm | - |
| 1800 UTC 30 Sep | 22.1 | -51.0 | 45 | 1004 | Tropical Storm | - |
| 0000 UTC 01 Oct | 23.0 | -52.2 | 40 | 1005 | Tropical Storm | - |
| 0600 UTC 01 Oct | 23.8 | -53.3 | 40 | 1005 | Tropical Storm | - |
| 1200 UTC 01 Oct | 24.8 | -54.4 | 40 | 1006 | Tropical Storm | - |
| 1800 UTC 01 Oct | 25.8 | -55.3 | 35 | 1007 | Remnant Low | - |
| 0000 UTC 02 Oct | 26.7 | -55.6 | 35 | 1008 | Remnant Low | - |
Ensemble Viewer (Click image for loop)
| Time (UTC) | Lat | Lon | Wind (mph) | Pressure | Storm Type | Category |
|---|---|---|---|---|---|---|
| 1800 UTC 10 Oct | 9.6 | -30.2 | 35 | 1007 | Tropical Depression | - |
| 0000 UTC 11 Oct | 9.8 | -31.4 | 40 | 1006 | Tropical Storm | - |
| 0600 UTC 11 Oct | 10.1 | -32.6 | 40 | 1006 | Tropical Storm | - |
| 1200 UTC 11 Oct | 10.7 | -33.7 | 40 | 1006 | Tropical Storm | - |
| 1800 UTC 11 Oct | 11.3 | -34.7 | 35 | 1007 | Tropical Depression | - |
| 0000 UTC 12 Oct | 11.8 | -35.6 | 35 | 1007 | Tropical Depression | - |
| 0600 UTC 12 Oct | 12.3 | -36.4 | 35 | 1007 | Tropical Depression | - |
| 1200 UTC 12 Oct | 12.8 | -37.1 | 40 | 1006 | Tropical Storm | - |
| 1800 UTC 12 Oct | 13.3 | -37.8 | 45 | 1005 | Tropical Storm | - |
| 0000 UTC 13 Oct | 13.7 | -39.0 | 45 | 1005 | Tropical Storm | - |
| 0600 UTC 13 Oct | 14.0 | -40.1 | 45 | 1005 | Tropical Storm | - |
| 1200 UTC 13 Oct | 14.3 | -41.2 | 40 | 1006 | Tropical Storm | - |
| 1800 UTC 13 Oct | 14.6 | -42.2 | 40 | 1006 | Tropical Storm | - |
| 0000 UTC 14 Oct | 14.9 | -42.7 | 40 | 1006 | Tropical Storm | - |
| 0600 UTC 14 Oct | 15.3 | -43.3 | 35 | 1007 | Tropical Depression | - |
| 1200 UTC 14 Oct | 15.8 | -43.9 | 35 | 1007 | Tropical Depression | - |
| 1800 UTC 14 Oct | 16.3 | -44.5 | 35 | 1007 | Tropical Depression | - |
| 0000 UTC 15 Oct | 16.8 | -45.1 | 35 | 1008 | Tropical Depression | - |
| 0600 UTC 15 Oct | 17.3 | -45.8 | 35 | 1009 | Tropical Depression | - |
| 1200 UTC 15 Oct | 17.6 | -46.6 | 30 | 1010 | Remnant Low | - |
| 1800 UTC 15 Oct | 17.9 | -47.6 | 30 | 1010 | Remnant Low | - |
| 0000 UTC 16 Oct | 18.1 | -48.6 | 30 | 1011 | Remnant Low | - |
| 0600 UTC 16 Oct | 18.2 | -49.8 | 30 | 1011 | Remnant Low | - |
| 1200 UTC 16 Oct | 18.3 | -51.0 | 25 | 1011 | Remnant Low | - |
| 1800 UTC 16 Oct | 18.4 | -52.2 | 25 | 1011 | Remnant Low | - |
Ensemble Viewer (Click image for loop)
Summary Plot

Recon-Derived Hovmoller
Recon-Derived Wind Swath
Recon-Derived MSLP Swath
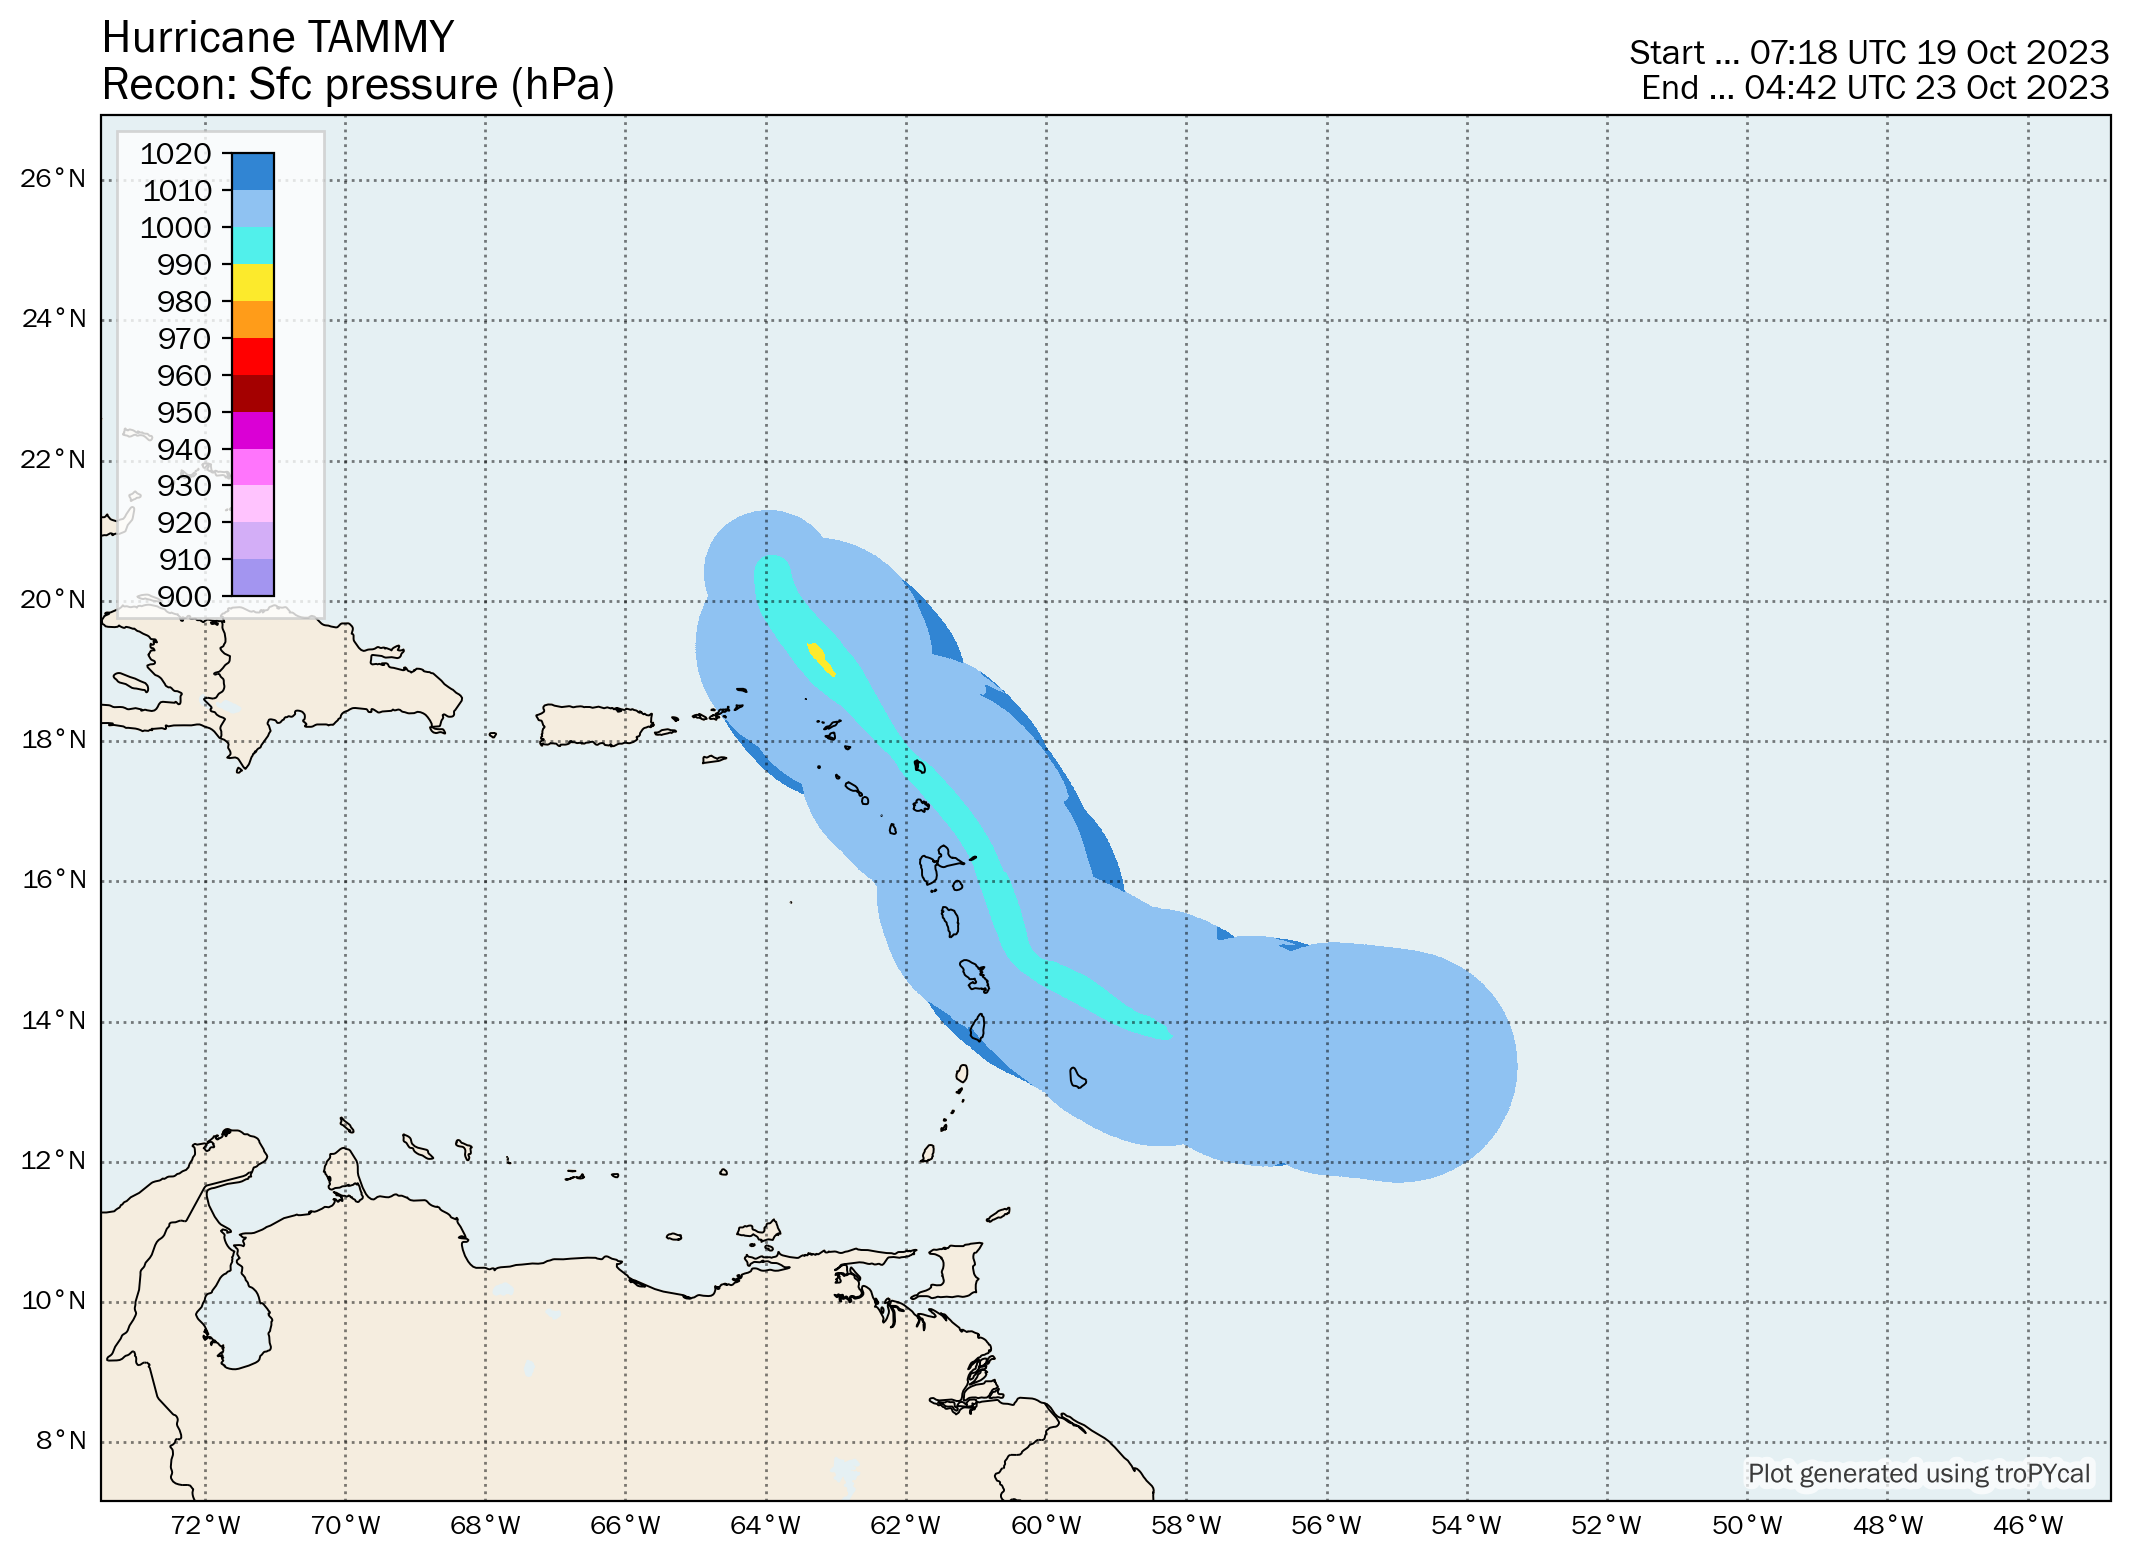
| Time (UTC) | Lat | Lon | Wind (mph) | Pressure | Storm Type | Category |
|---|---|---|---|---|---|---|
| 1800 UTC 18 Oct | 12.9 | -51.0 | 40 | 1007 | Tropical Storm | - |
| 0000 UTC 19 Oct | 13.0 | -52.5 | 40 | 1006 | Tropical Storm | - |
| 0600 UTC 19 Oct | 13.2 | -54.0 | 50 | 1004 | Tropical Storm | - |
| 1200 UTC 19 Oct | 13.4 | -55.3 | 60 | 1004 | Tropical Storm | - |
| 1800 UTC 19 Oct | 13.5 | -56.4 | 60 | 1002 | Tropical Storm | - |
| 0000 UTC 20 Oct | 13.6 | -57.2 | 60 | 1001 | Tropical Storm | - |
| 0600 UTC 20 Oct | 13.7 | -57.9 | 60 | 1000 | Tropical Storm | - |
| 1200 UTC 20 Oct | 13.9 | -58.4 | 70 | 997 | Tropical Storm | - |
| 1800 UTC 20 Oct | 14.1 | -58.9 | 75 | 991 | Hurricane | 1 |
| 0000 UTC 21 Oct | 14.5 | -59.6 | 80 | 991 | Hurricane | 1 |
| 0600 UTC 21 Oct | 14.9 | -60.3 | 80 | 991 | Hurricane | 1 |
| 1200 UTC 21 Oct | 15.6 | -60.6 | 85 | 987 | Hurricane | 1 |
| 1800 UTC 21 Oct | 16.6 | -61.0 | 85 | 987 | Hurricane | 1 |
| 0000 UTC 22 Oct | 17.5 | -61.7 | 90 | 987 | Hurricane | 1 |
| 0115 UTC 22 Oct | 17.6 | -61.8 | 90 | 987 | Hurricane | 1 |
| 0600 UTC 22 Oct | 18.0 | -62.2 | 85 | 989 | Hurricane | 1 |
| 1200 UTC 22 Oct | 18.7 | -62.8 | 85 | 990 | Hurricane | 1 |
| 1800 UTC 22 Oct | 19.4 | -63.4 | 85 | 990 | Hurricane | 1 |
| 0000 UTC 23 Oct | 20.2 | -63.9 | 85 | 992 | Hurricane | 1 |
| 0600 UTC 23 Oct | 21.0 | -64.0 | 80 | 993 | Hurricane | 1 |
| 1200 UTC 23 Oct | 21.6 | -64.0 | 80 | 993 | Hurricane | 1 |
| 1800 UTC 23 Oct | 22.1 | -63.8 | 75 | 988 | Hurricane | 1 |
| 0000 UTC 24 Oct | 22.6 | -63.5 | 75 | 987 | Hurricane | 1 |
| 0600 UTC 24 Oct | 23.1 | -63.1 | 75 | 987 | Hurricane | 1 |
| 1200 UTC 24 Oct | 23.6 | -62.6 | 75 | 987 | Hurricane | 1 |
| 1800 UTC 24 Oct | 24.0 | -62.0 | 75 | 987 | Hurricane | 1 |
| 0000 UTC 25 Oct | 24.5 | -61.2 | 85 | 976 | Hurricane | 1 |
| 0600 UTC 25 Oct | 25.1 | -60.4 | 100 | 969 | Hurricane | 2 |
| 1200 UTC 25 Oct | 26.1 | -59.4 | 110 | 965 | Hurricane | 2 |
| 1800 UTC 25 Oct | 27.5 | -58.3 | 100 | 968 | Hurricane | 2 |
| 0000 UTC 26 Oct | 29.1 | -57.8 | 90 | 970 | Hurricane | 1 |
| 0600 UTC 26 Oct | 30.0 | -58.3 | 85 | 972 | Hurricane | 1 |
| 1200 UTC 26 Oct | 30.5 | -58.8 | 80 | 975 | Hurricane | 1 |
| 1800 UTC 26 Oct | 31.0 | -59.5 | 75 | 977 | Hurricane | 1 |
| 0000 UTC 27 Oct | 31.5 | -60.1 | 70 | 980 | Tropical Storm | - |
| 0600 UTC 27 Oct | 31.8 | -60.6 | 65 | 985 | Tropical Storm | - |
| 1200 UTC 27 Oct | 32.0 | -61.0 | 65 | 988 | Tropical Storm | - |
| 1800 UTC 27 Oct | 32.3 | -61.4 | 65 | 988 | Tropical Storm | - |
| 0000 UTC 28 Oct | 32.6 | -61.5 | 60 | 991 | Tropical Storm | - |
| 0600 UTC 28 Oct | 32.9 | -61.0 | 50 | 994 | Tropical Storm | - |
| 1200 UTC 28 Oct | 33.1 | -59.5 | 50 | 995 | Tropical Storm | - |
| 1800 UTC 28 Oct | 33.3 | -58.0 | 45 | 997 | Tropical Storm | - |
| 0000 UTC 29 Oct | 32.8 | -56.1 | 40 | 1000 | Remnant Low | - |
| 0600 UTC 29 Oct | 32.6 | -54.3 | 40 | 1002 | Remnant Low | - |
| 1200 UTC 29 Oct | 31.8 | -52.5 | 40 | 1002 | Remnant Low | - |
| 1800 UTC 29 Oct | 30.9 | -50.9 | 40 | 1002 | Remnant Low | - |
| 0000 UTC 30 Oct | 29.6 | -49.6 | 35 | 1004 | Remnant Low | - |
| 0600 UTC 30 Oct | 28.5 | -49.0 | 35 | 1005 | Remnant Low | - |
| 1200 UTC 30 Oct | 27.5 | -48.5 | 35 | 1005 | Remnant Low | - |
| 1800 UTC 30 Oct | 26.5 | -48.1 | 30 | 1006 | Remnant Low | - |
| 0000 UTC 31 Oct | 25.6 | -48.5 | 30 | 1006 | Remnant Low | - |
| 0600 UTC 31 Oct | 25.1 | -49.0 | 30 | 1007 | Remnant Low | - |
| 1200 UTC 31 Oct | 24.9 | -49.9 | 25 | 1008 | Remnant Low | - |
| 1800 UTC 31 Oct | 24.6 | -50.6 | 25 | 1008 | Remnant Low | - |
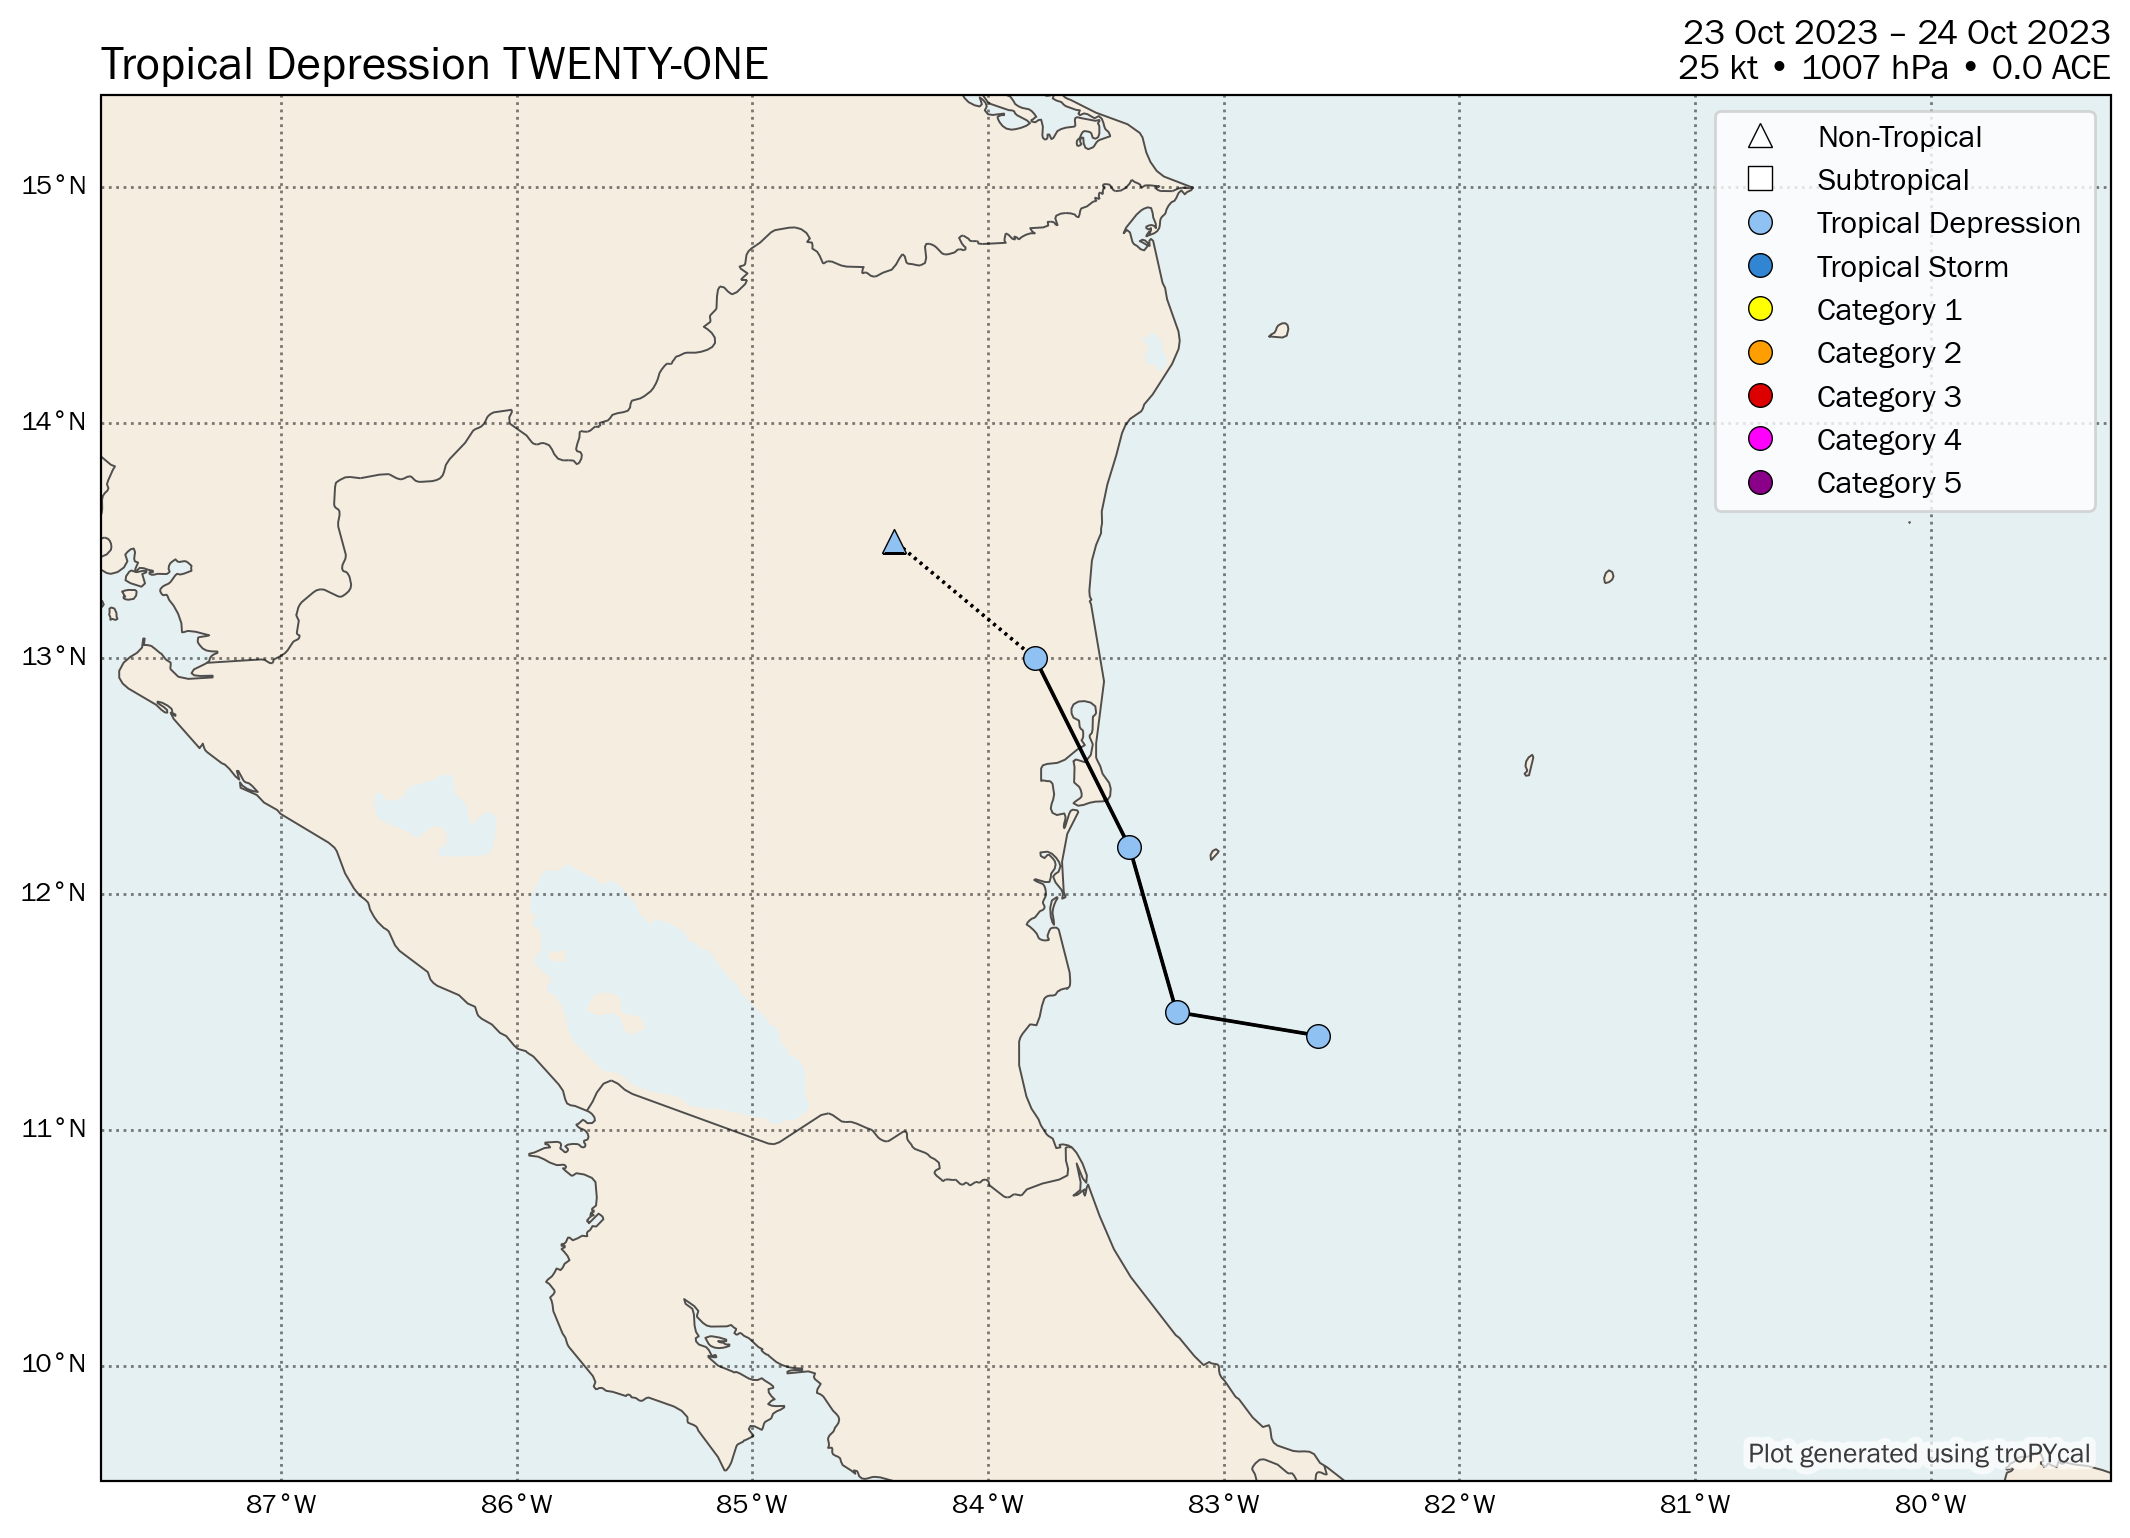
| Time (UTC) | Lat | Lon | Wind (mph) | Pressure | Storm Type | Category |
|---|---|---|---|---|---|---|
| 1200 UTC 23 Oct | 11.4 | -82.6 | 30 | 1007 | Tropical Depression | - |
| 1800 UTC 23 Oct | 11.5 | -83.2 | 30 | 1007 | Tropical Depression | - |
| 0000 UTC 24 Oct | 12.2 | -83.4 | 30 | 1007 | Tropical Depression | - |
| 0130 UTC 24 Oct | 12.4 | -83.5 | 30 | 1007 | Tropical Depression | - |
| 0600 UTC 24 Oct | 13.0 | -83.8 | 30 | 1007 | Tropical Depression | - |
| 1200 UTC 24 Oct | 13.5 | -84.4 | 25 | 1007 | Remnant Low | - |