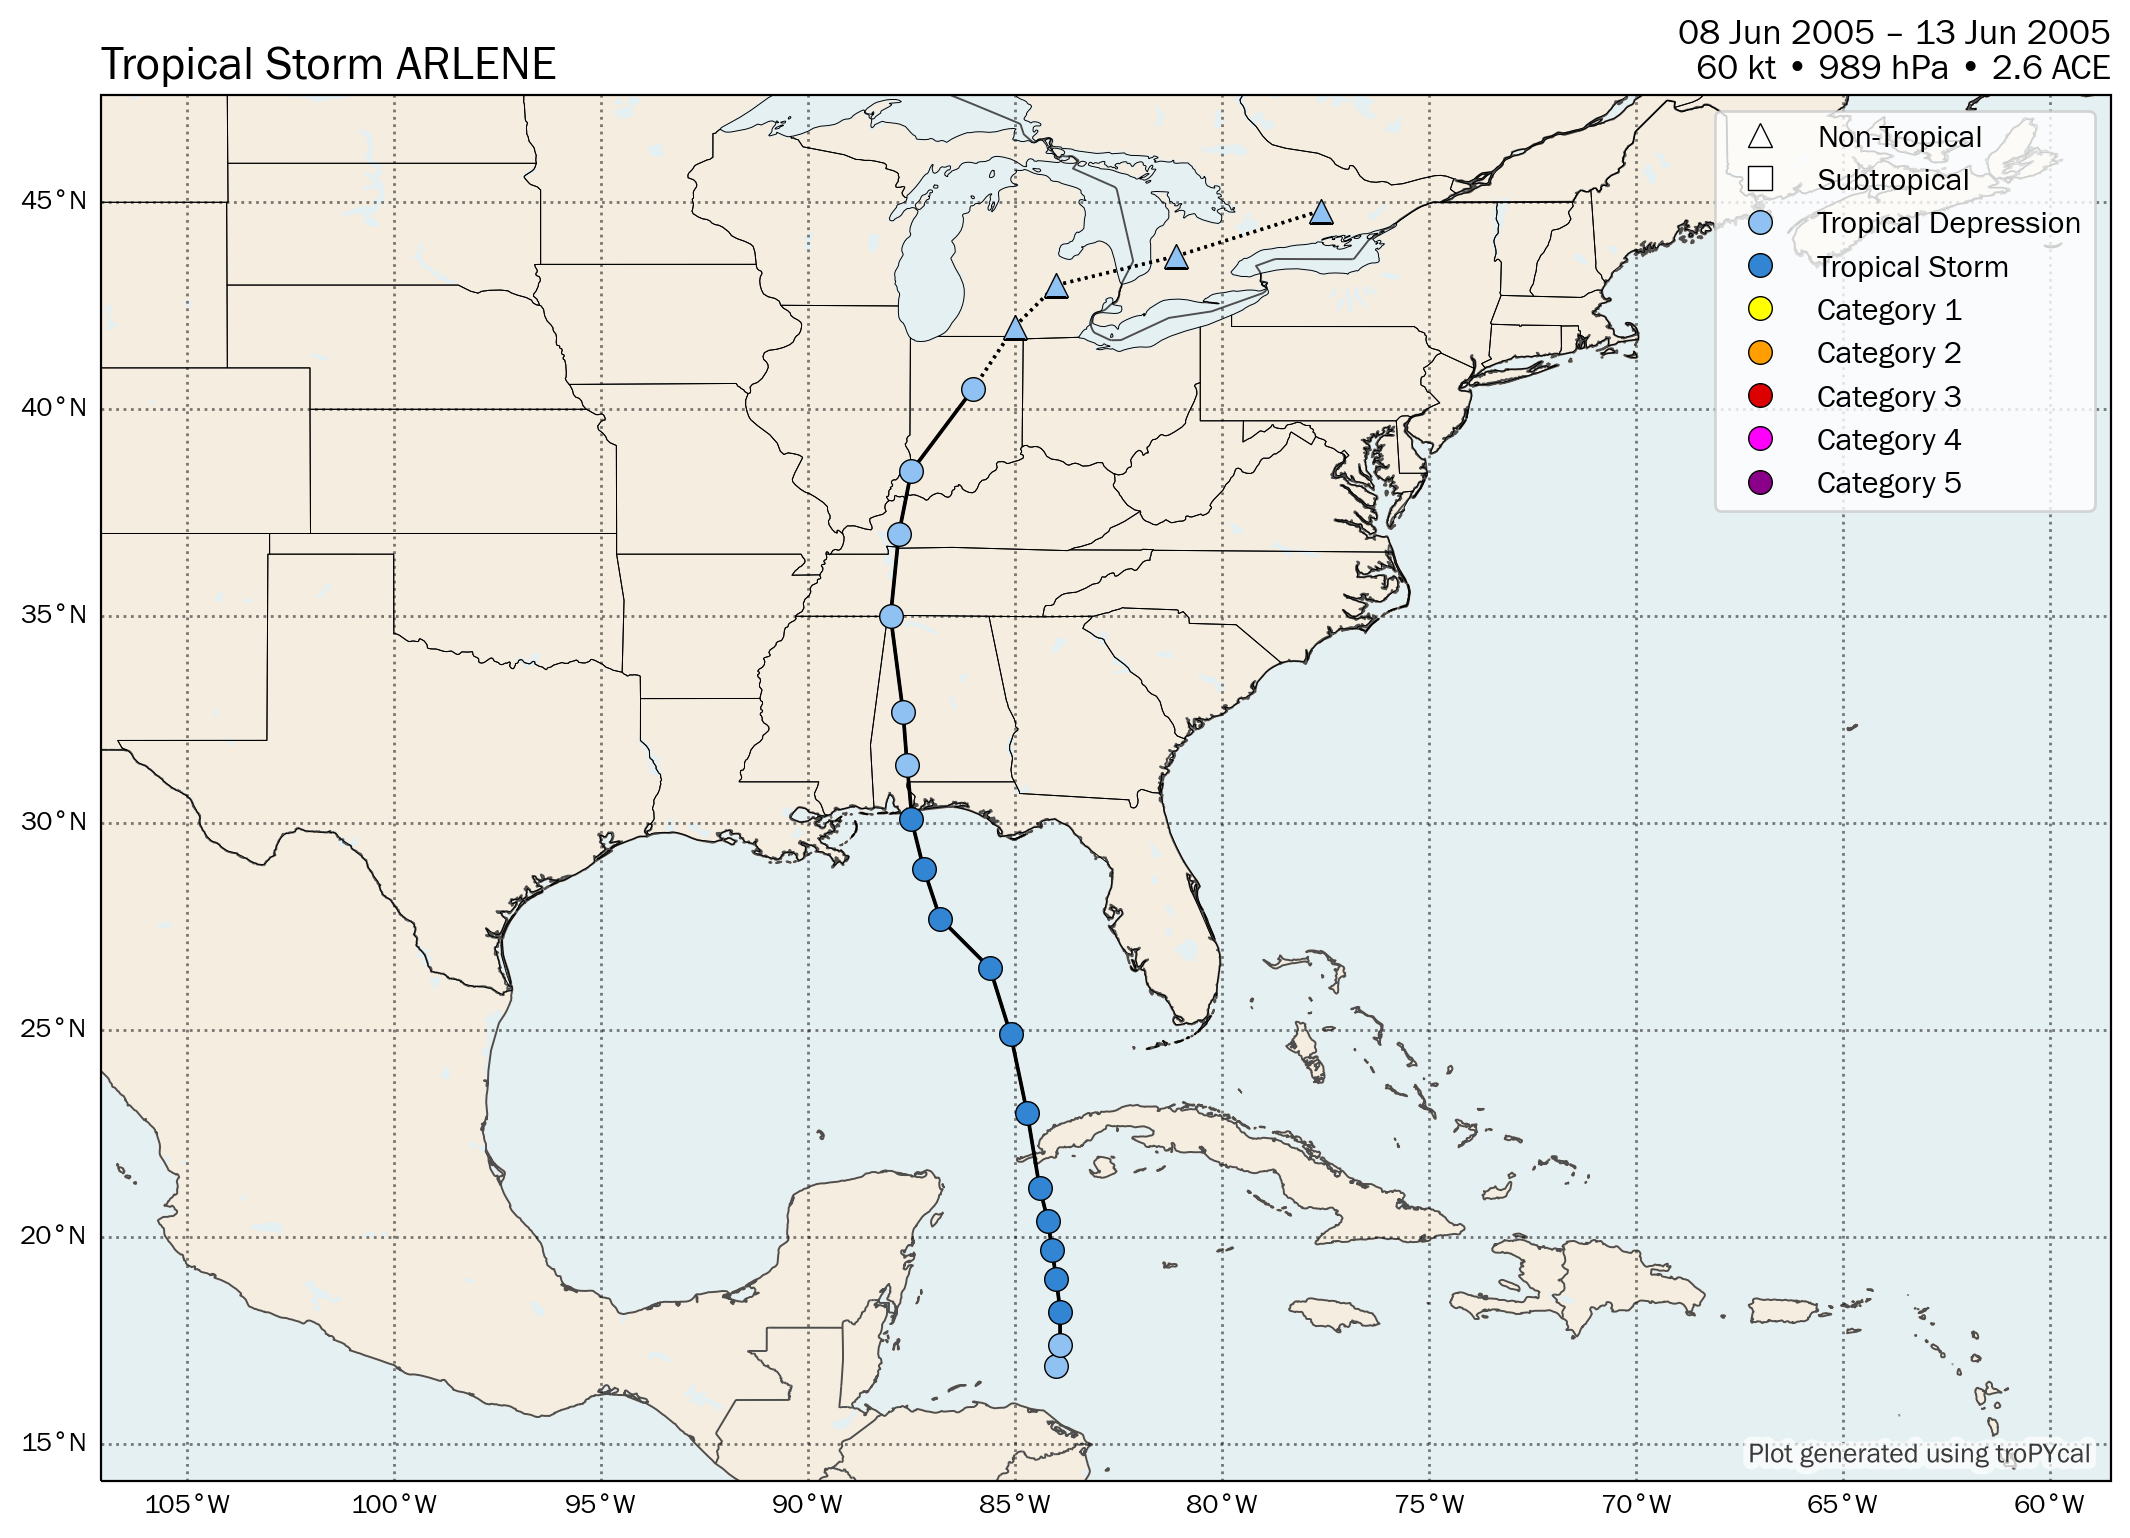
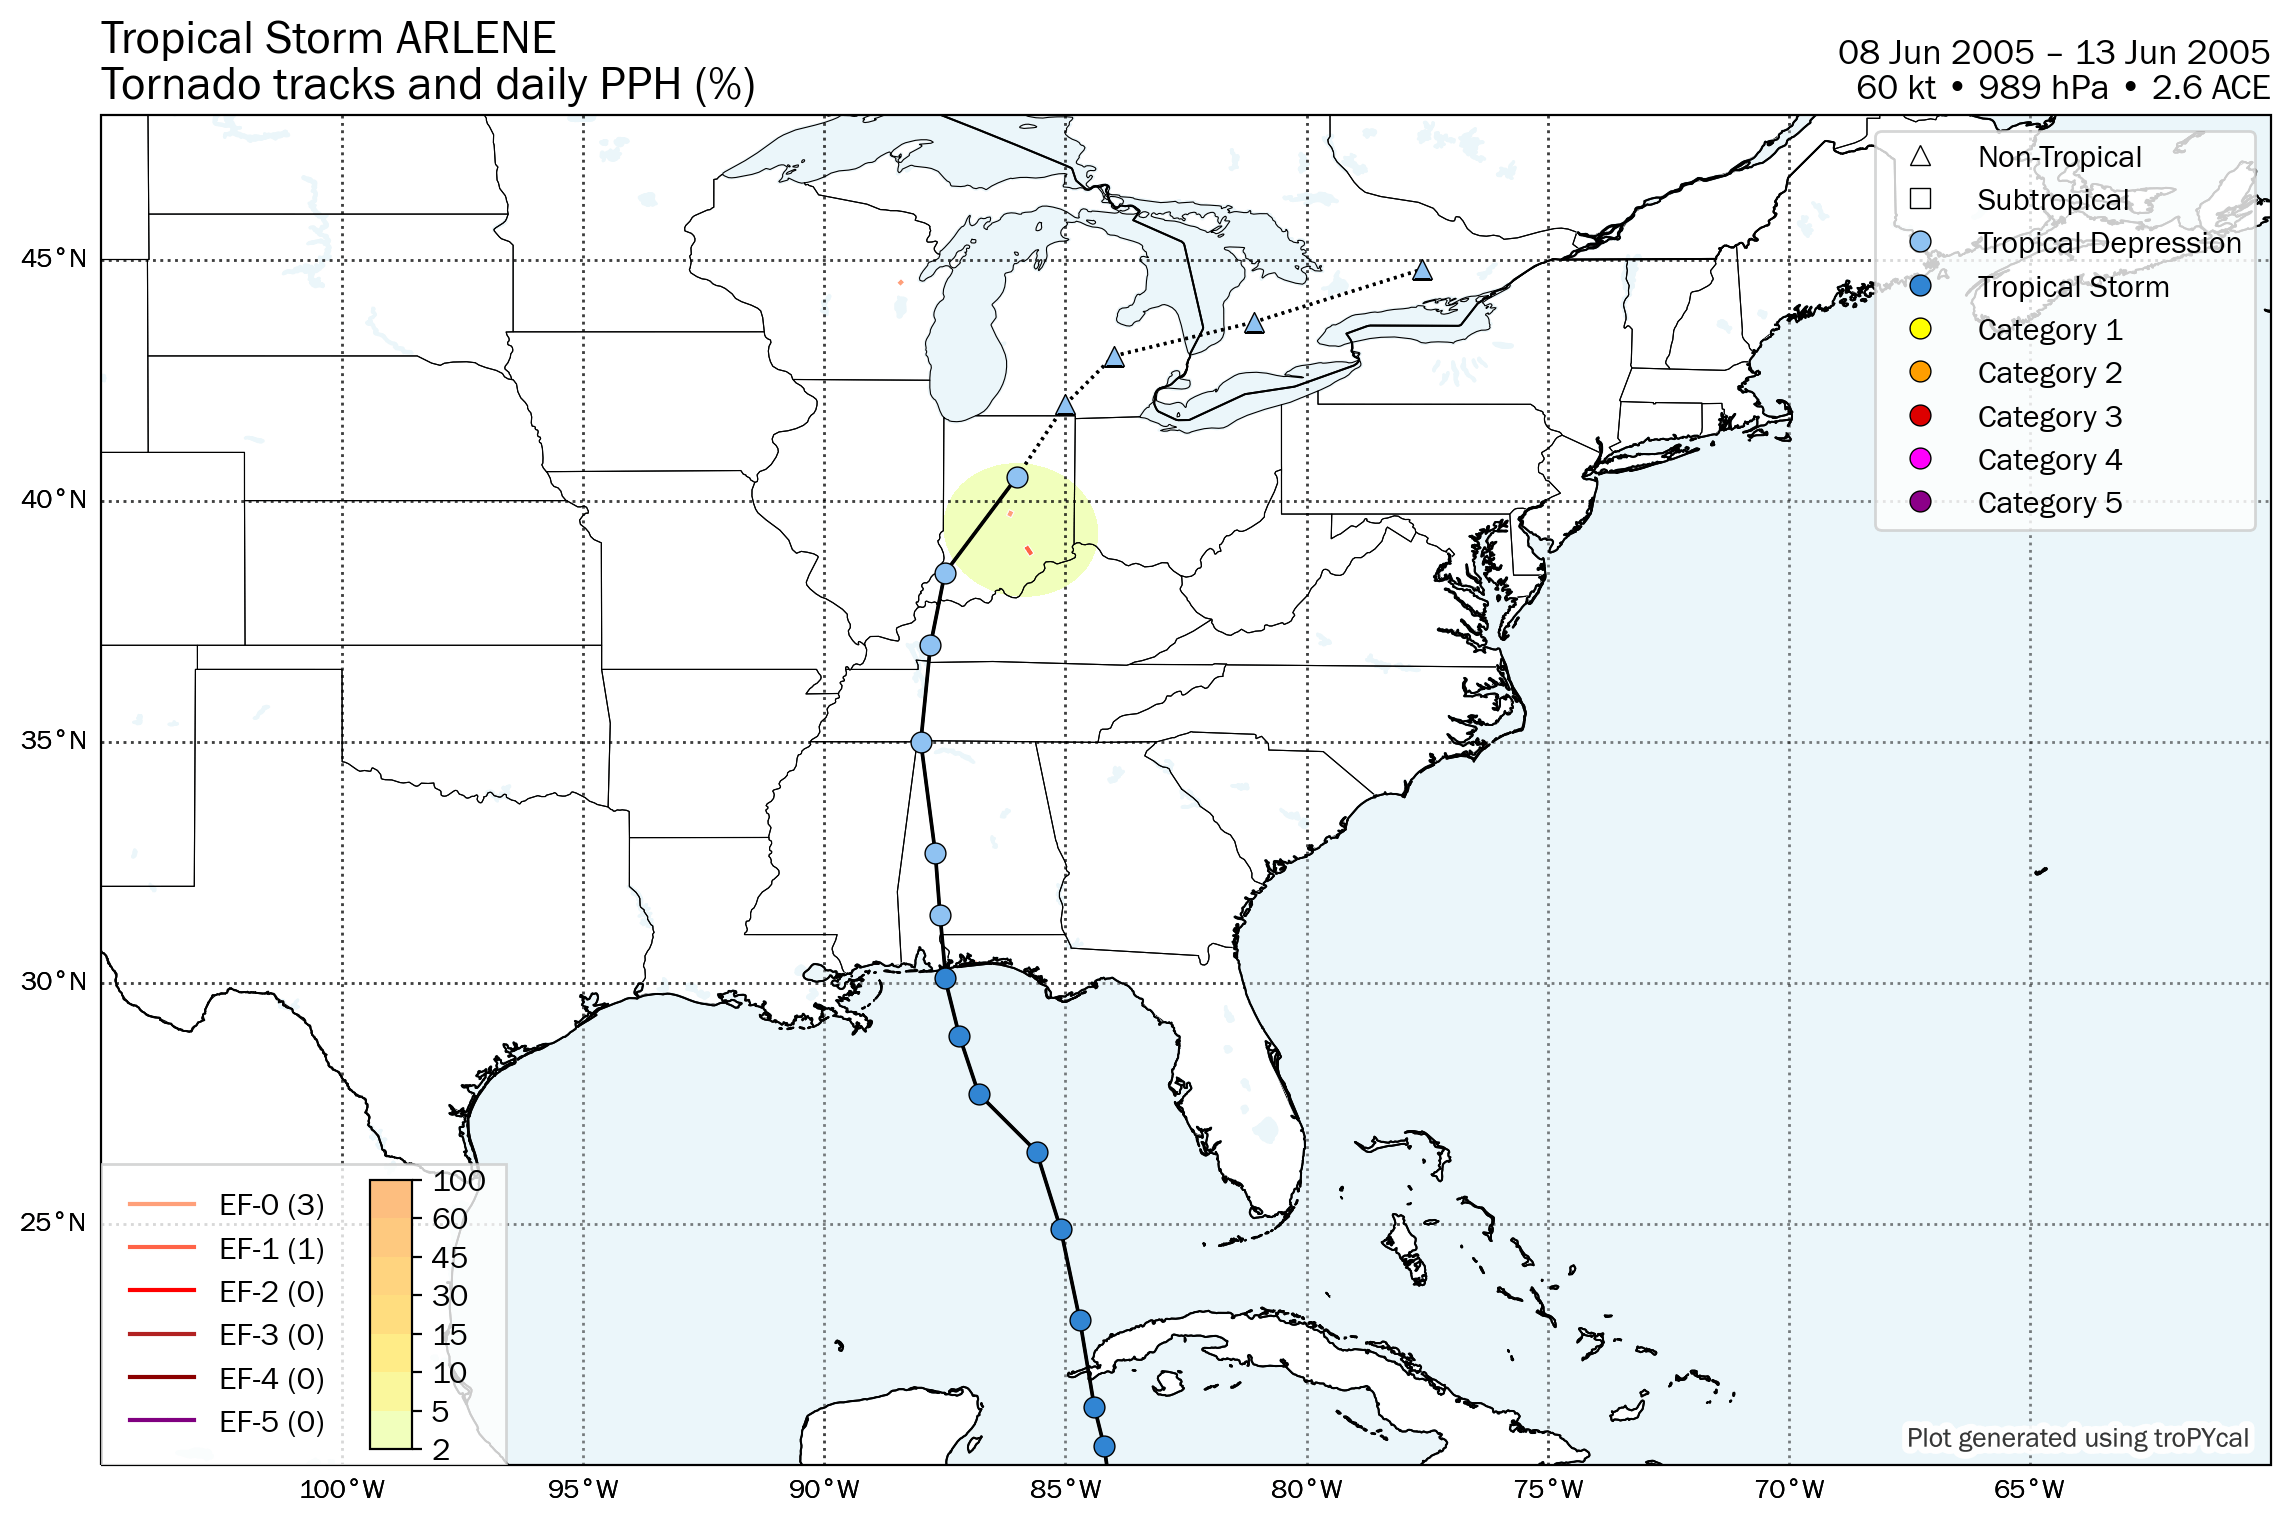
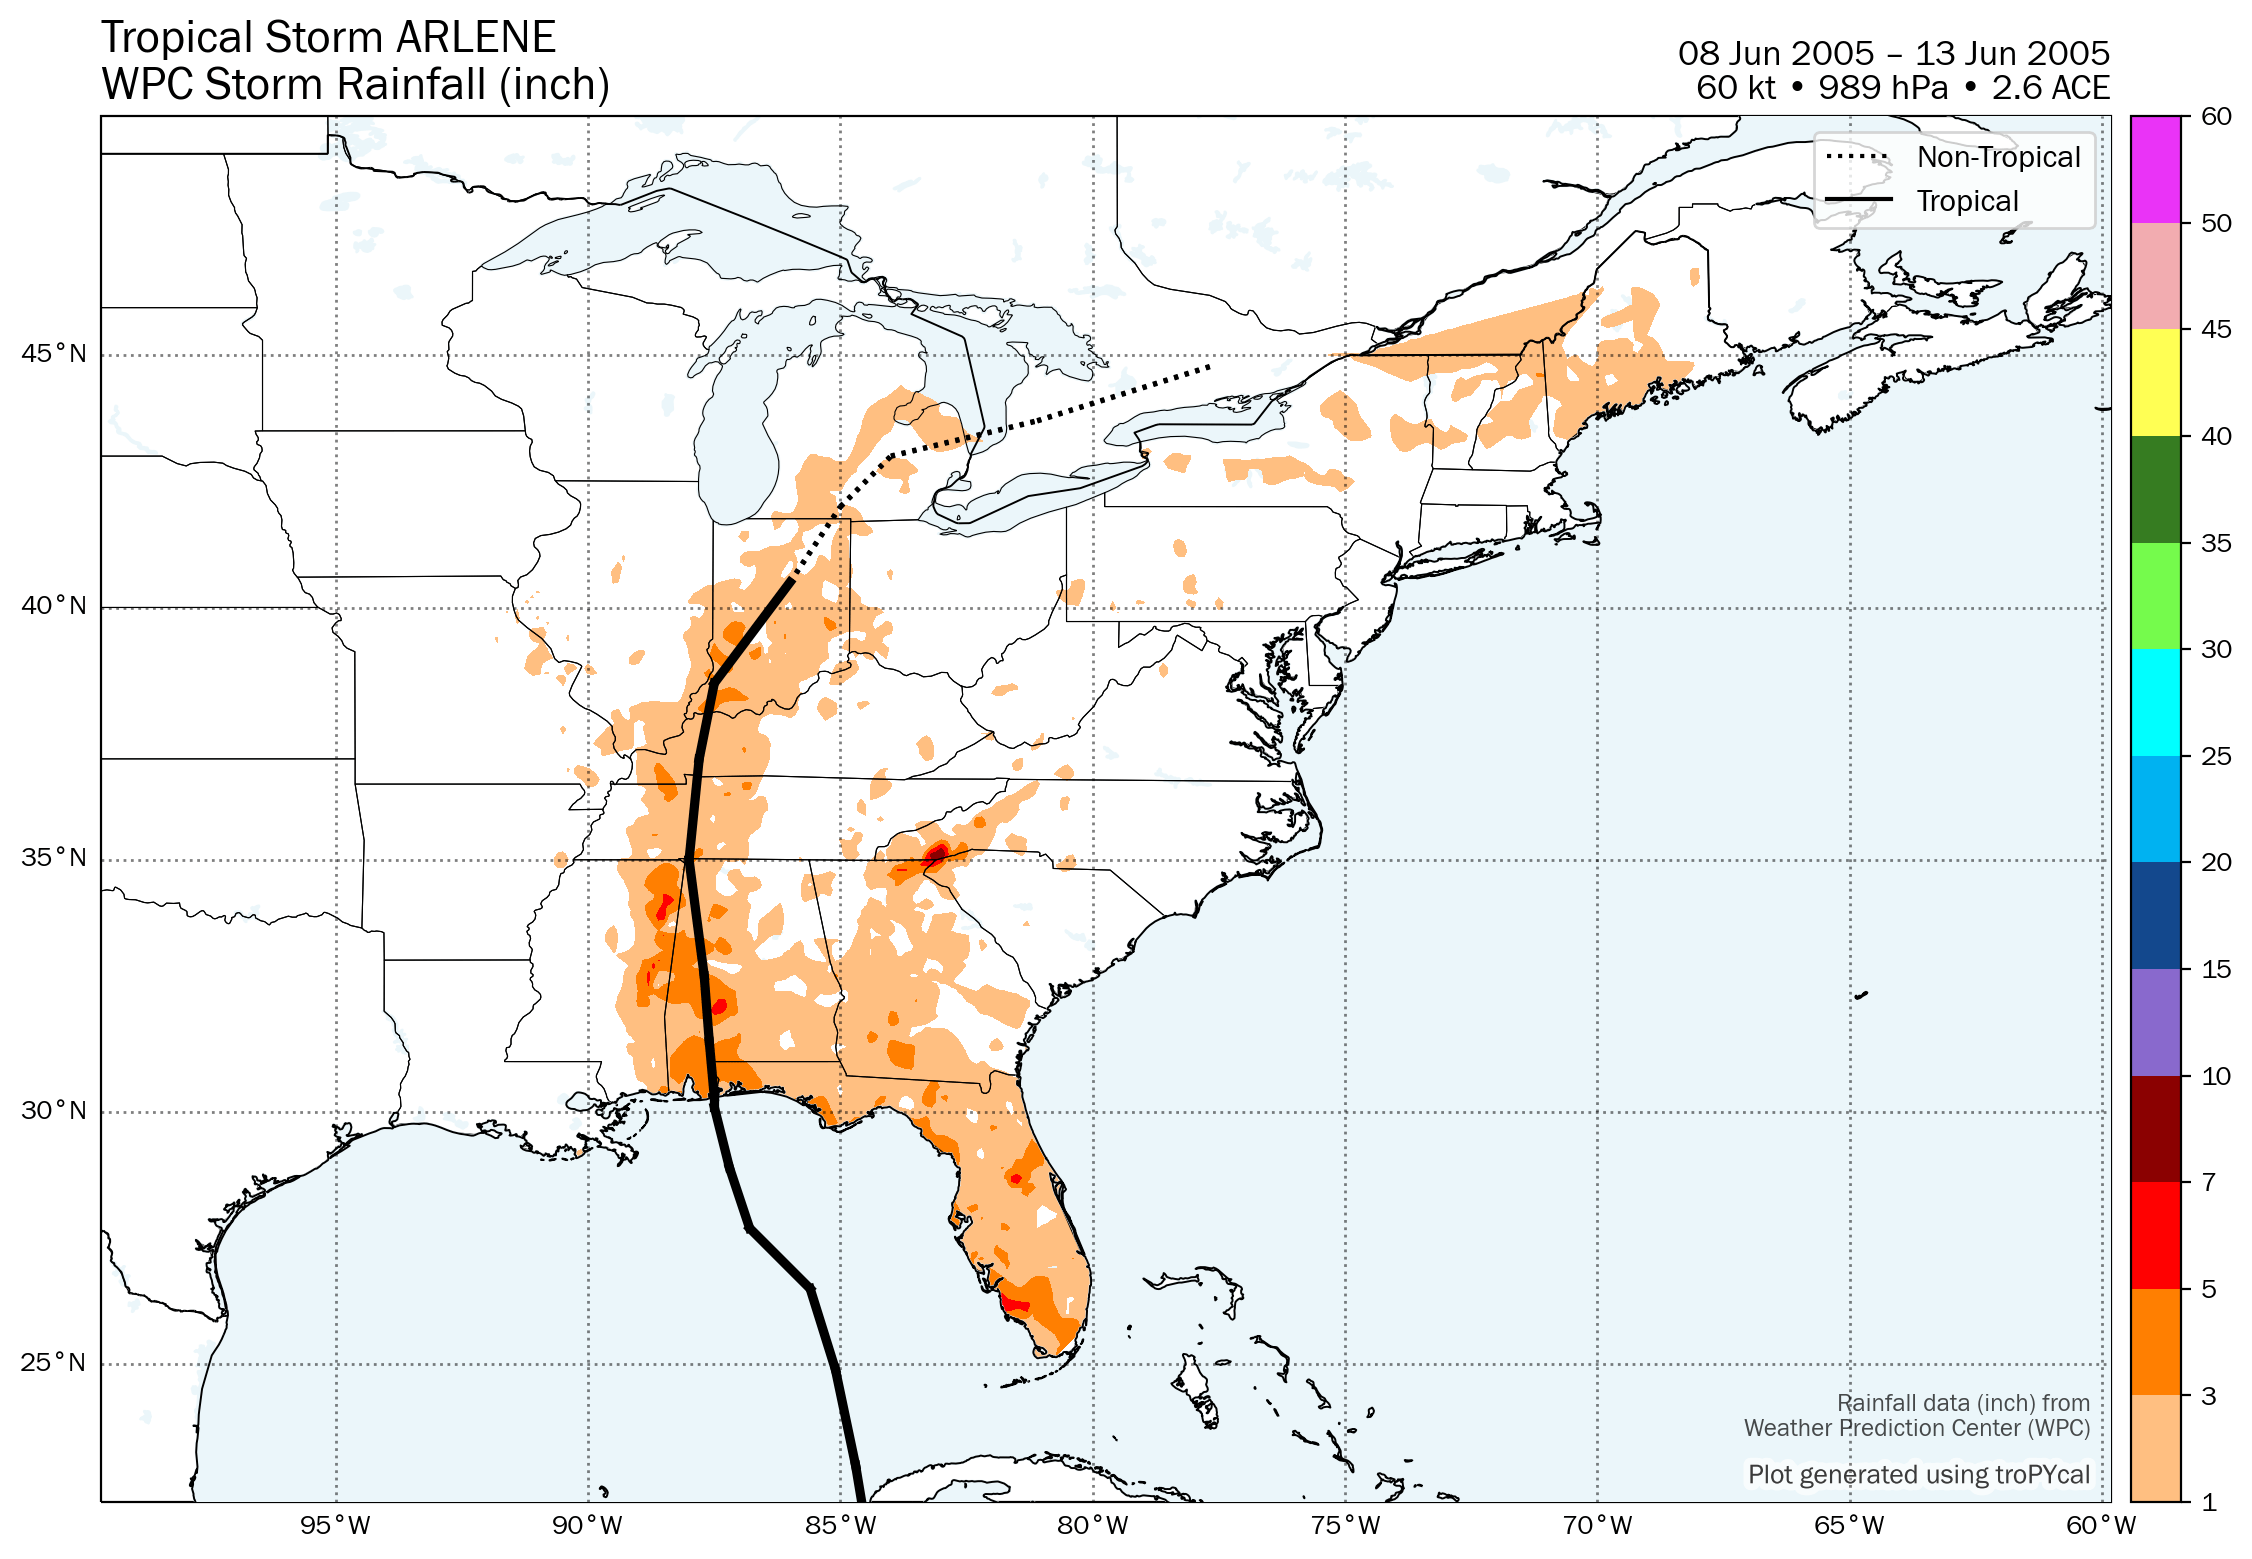
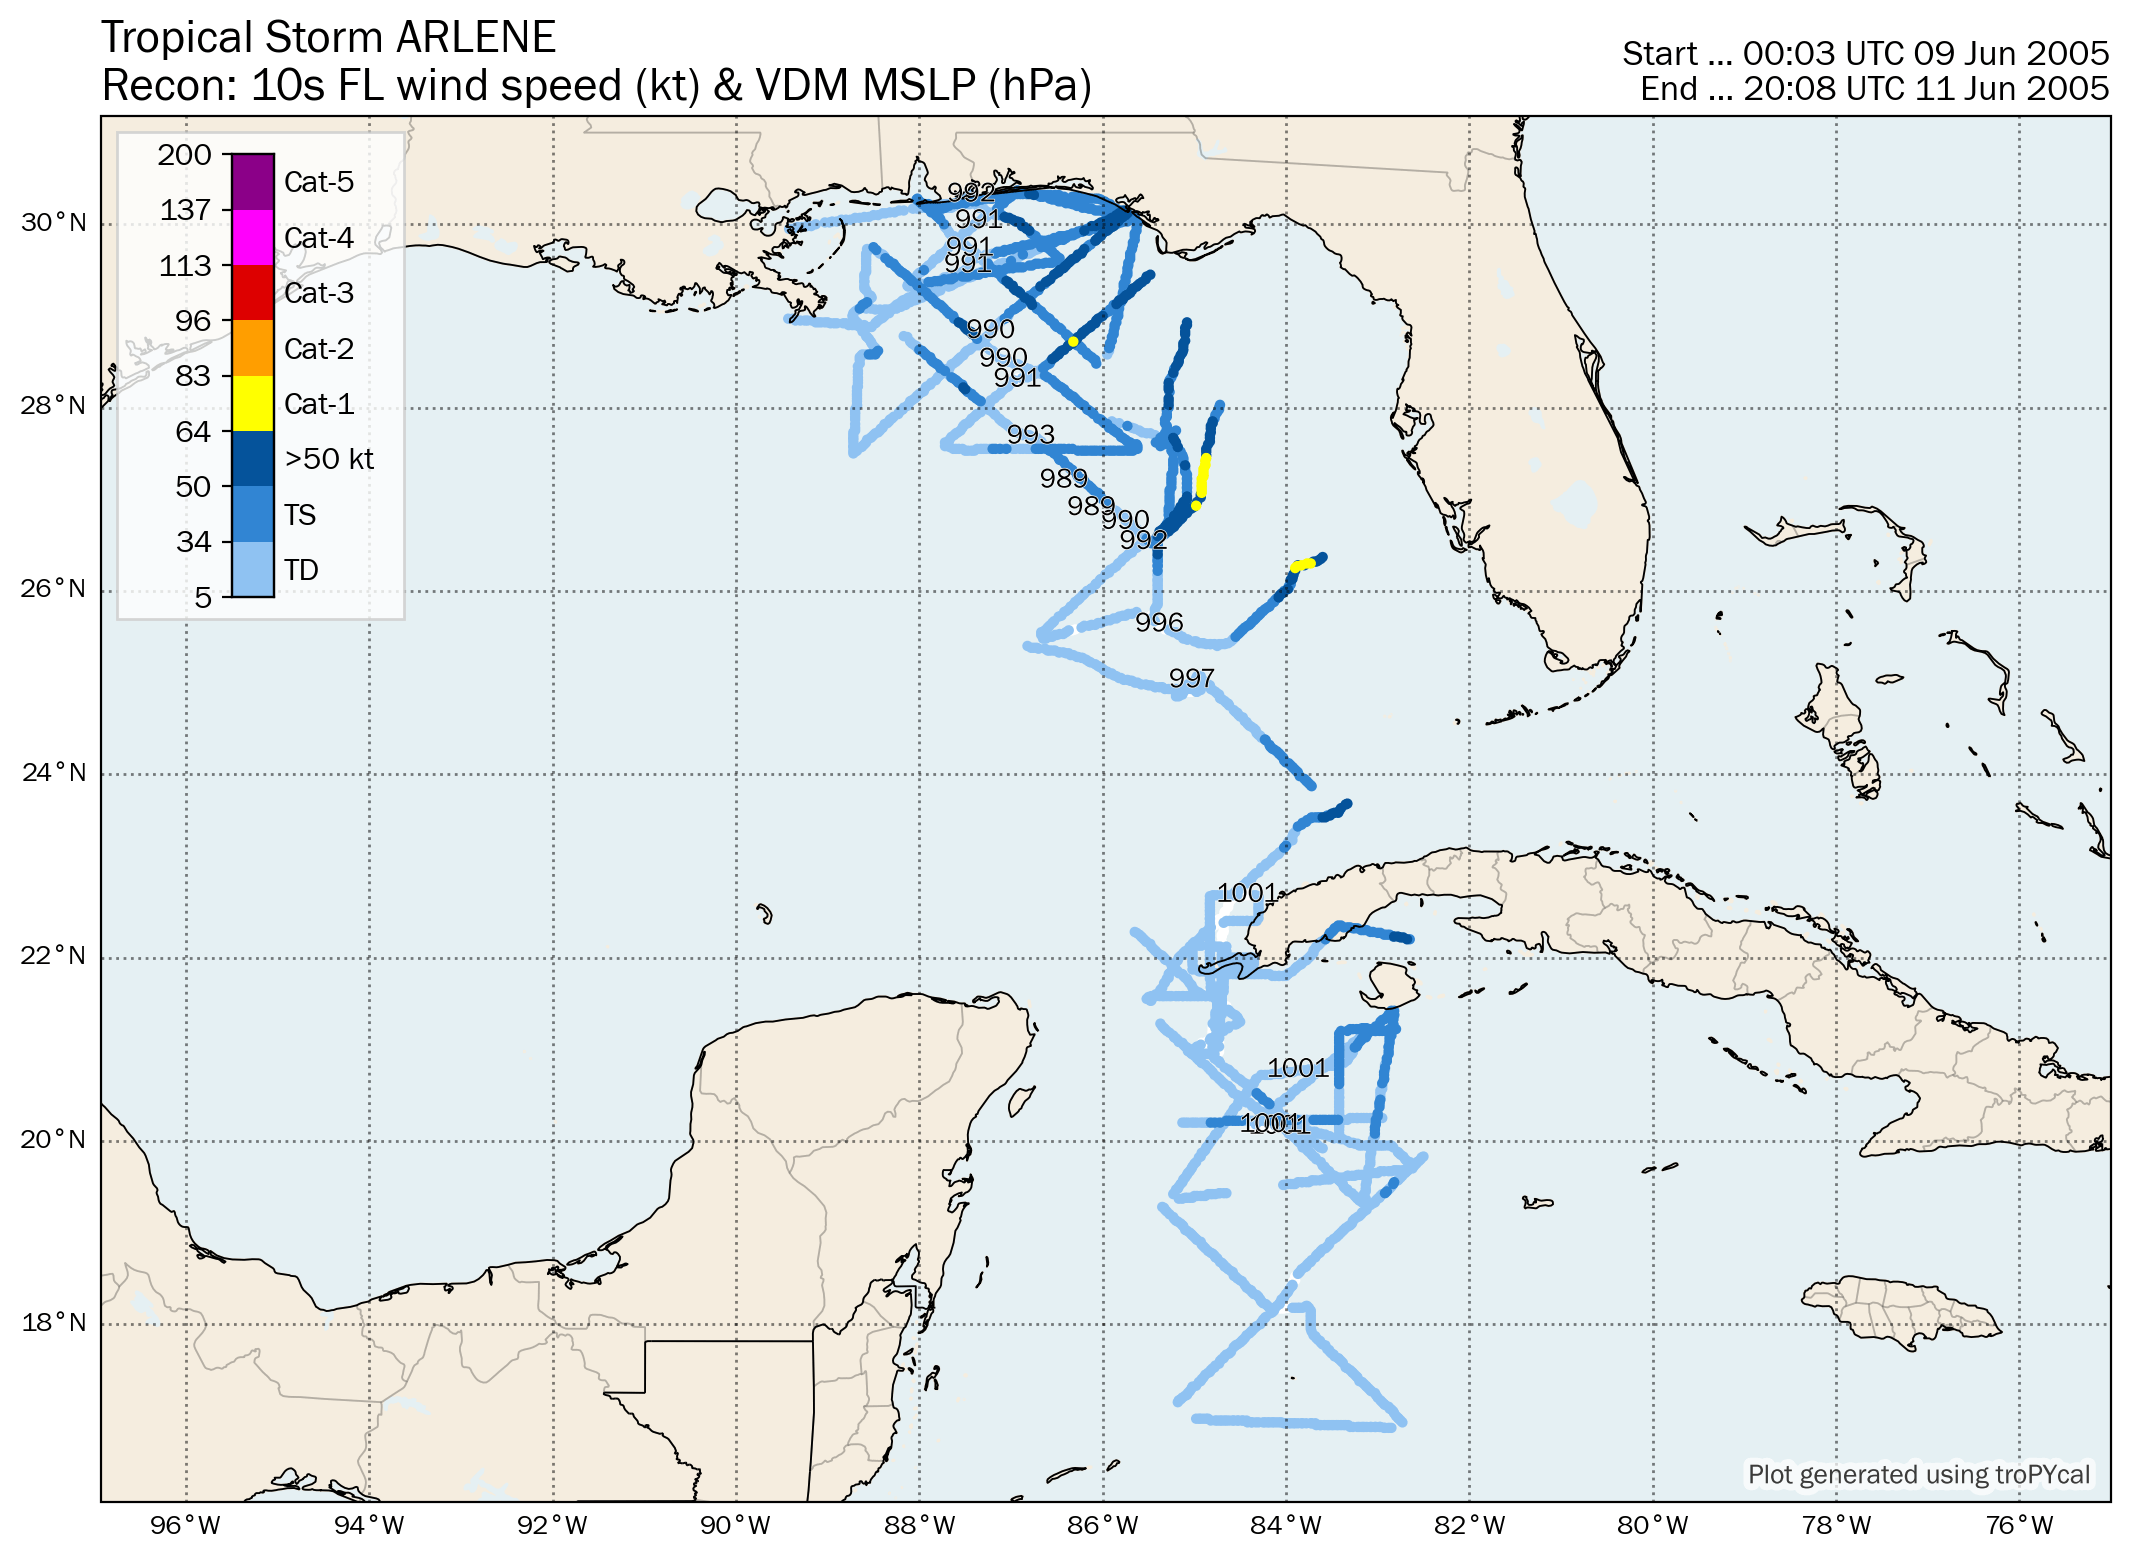
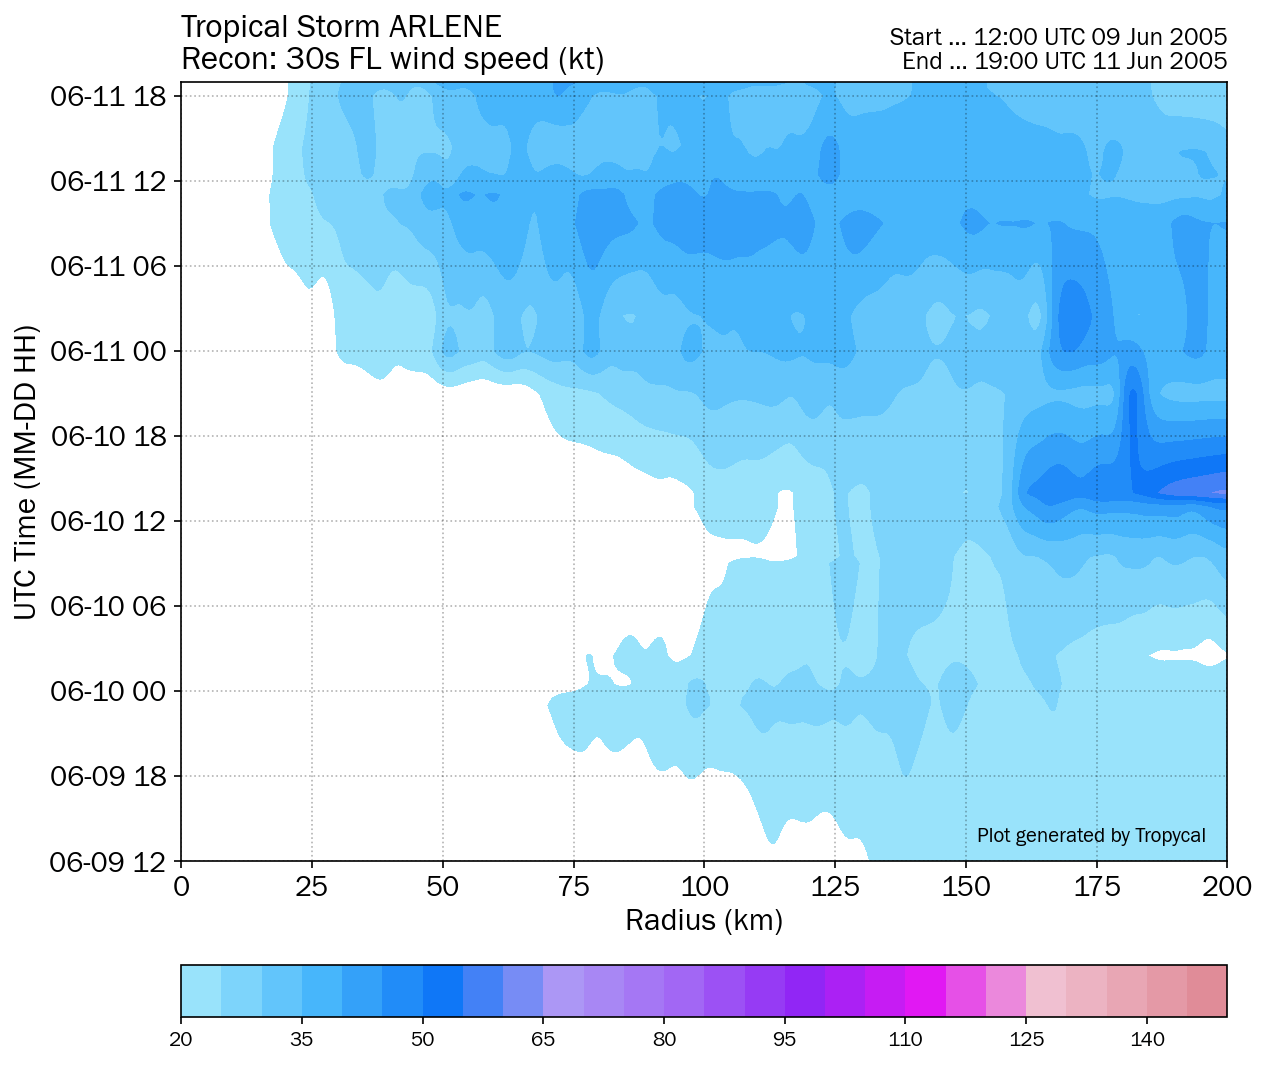
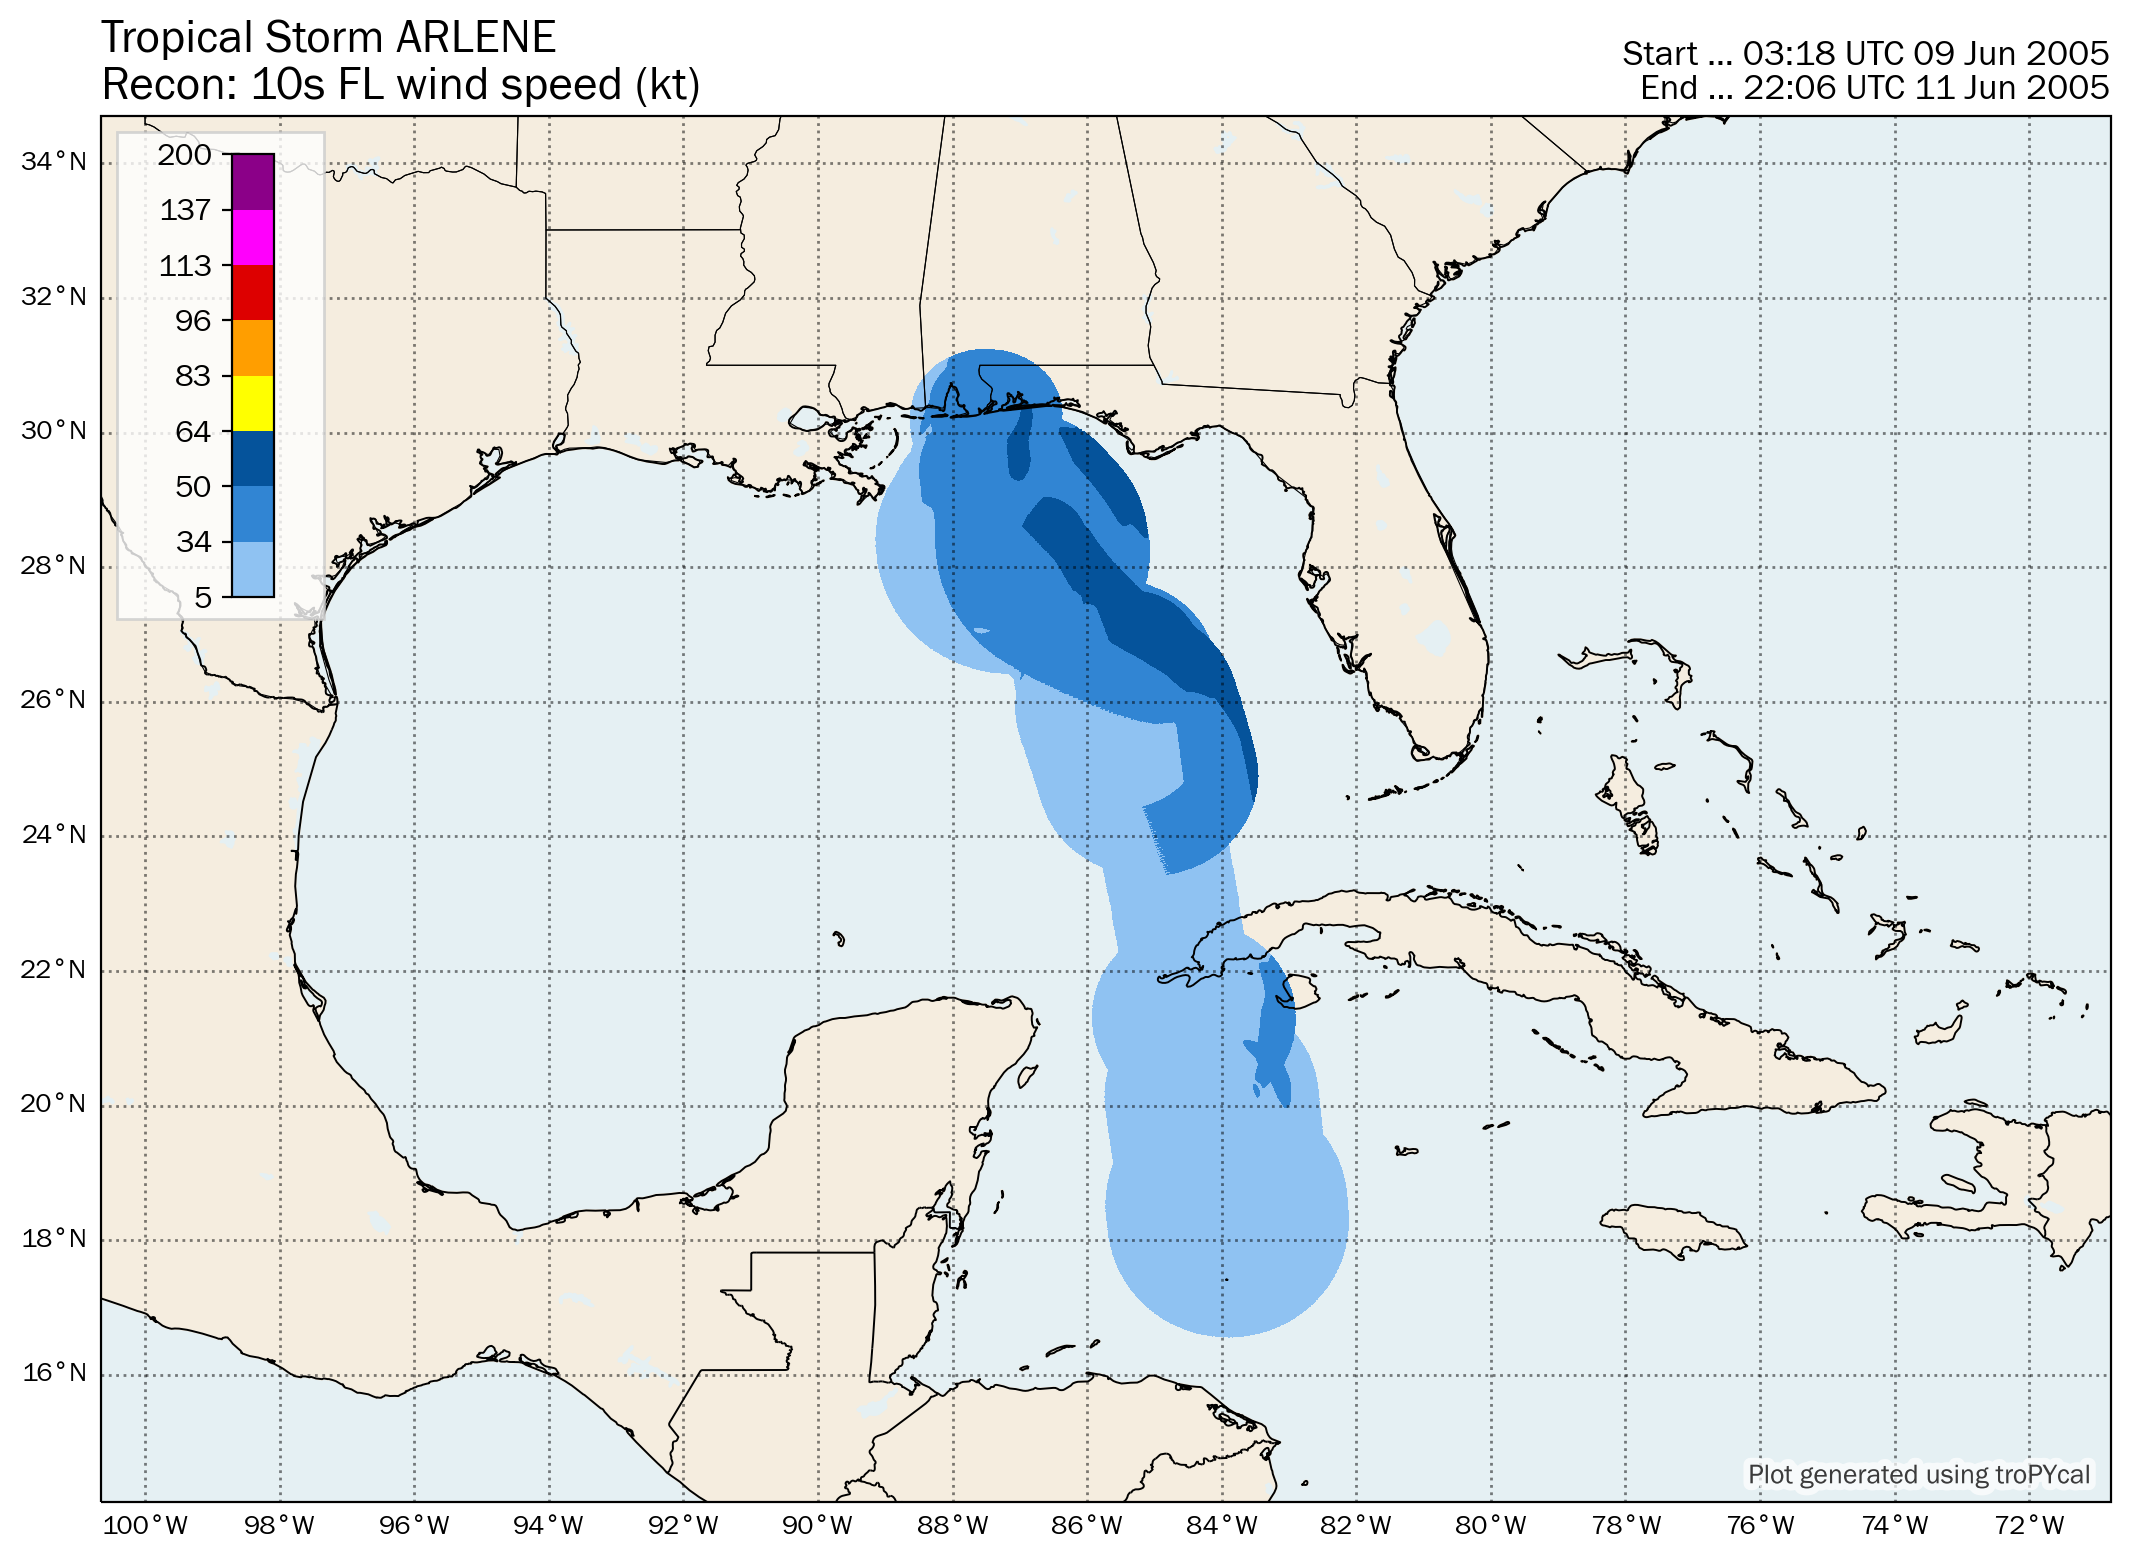
Tropical Storm Arlene
Storm Duration
•
June 8–13, 2005
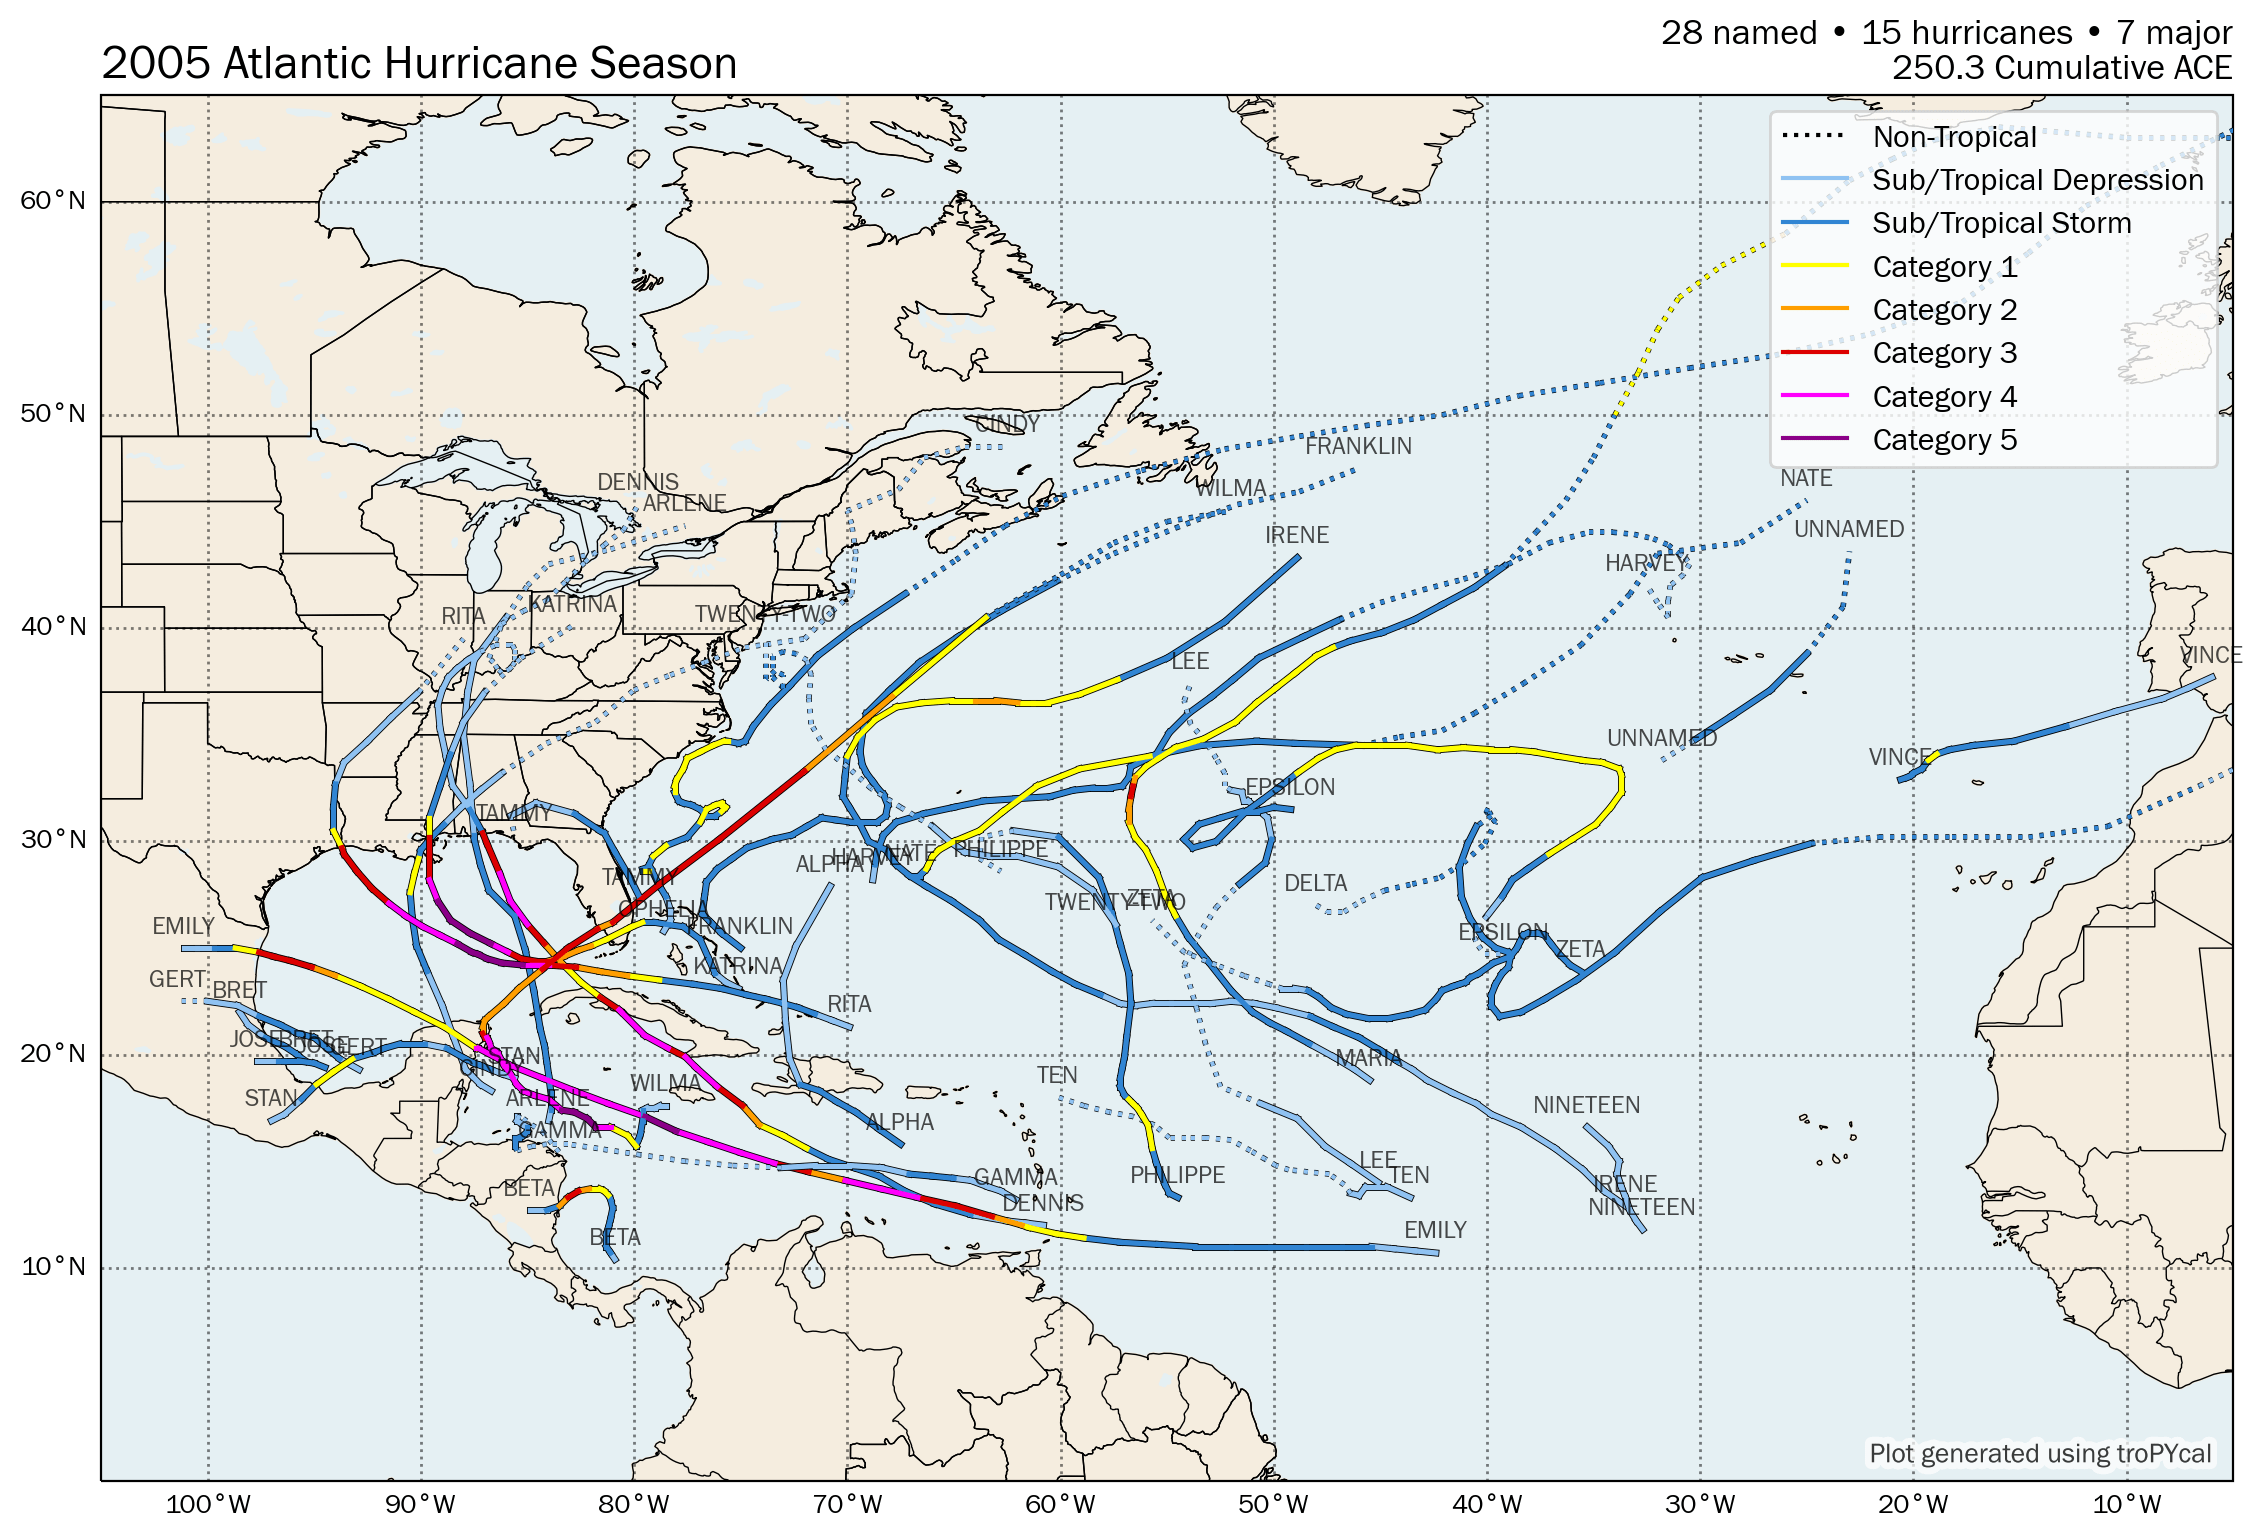
| S | Tropical Storm Arlene | 60 kt | 989 hPa | 18z 06/08 | 06z 06/13 | 2.6 |
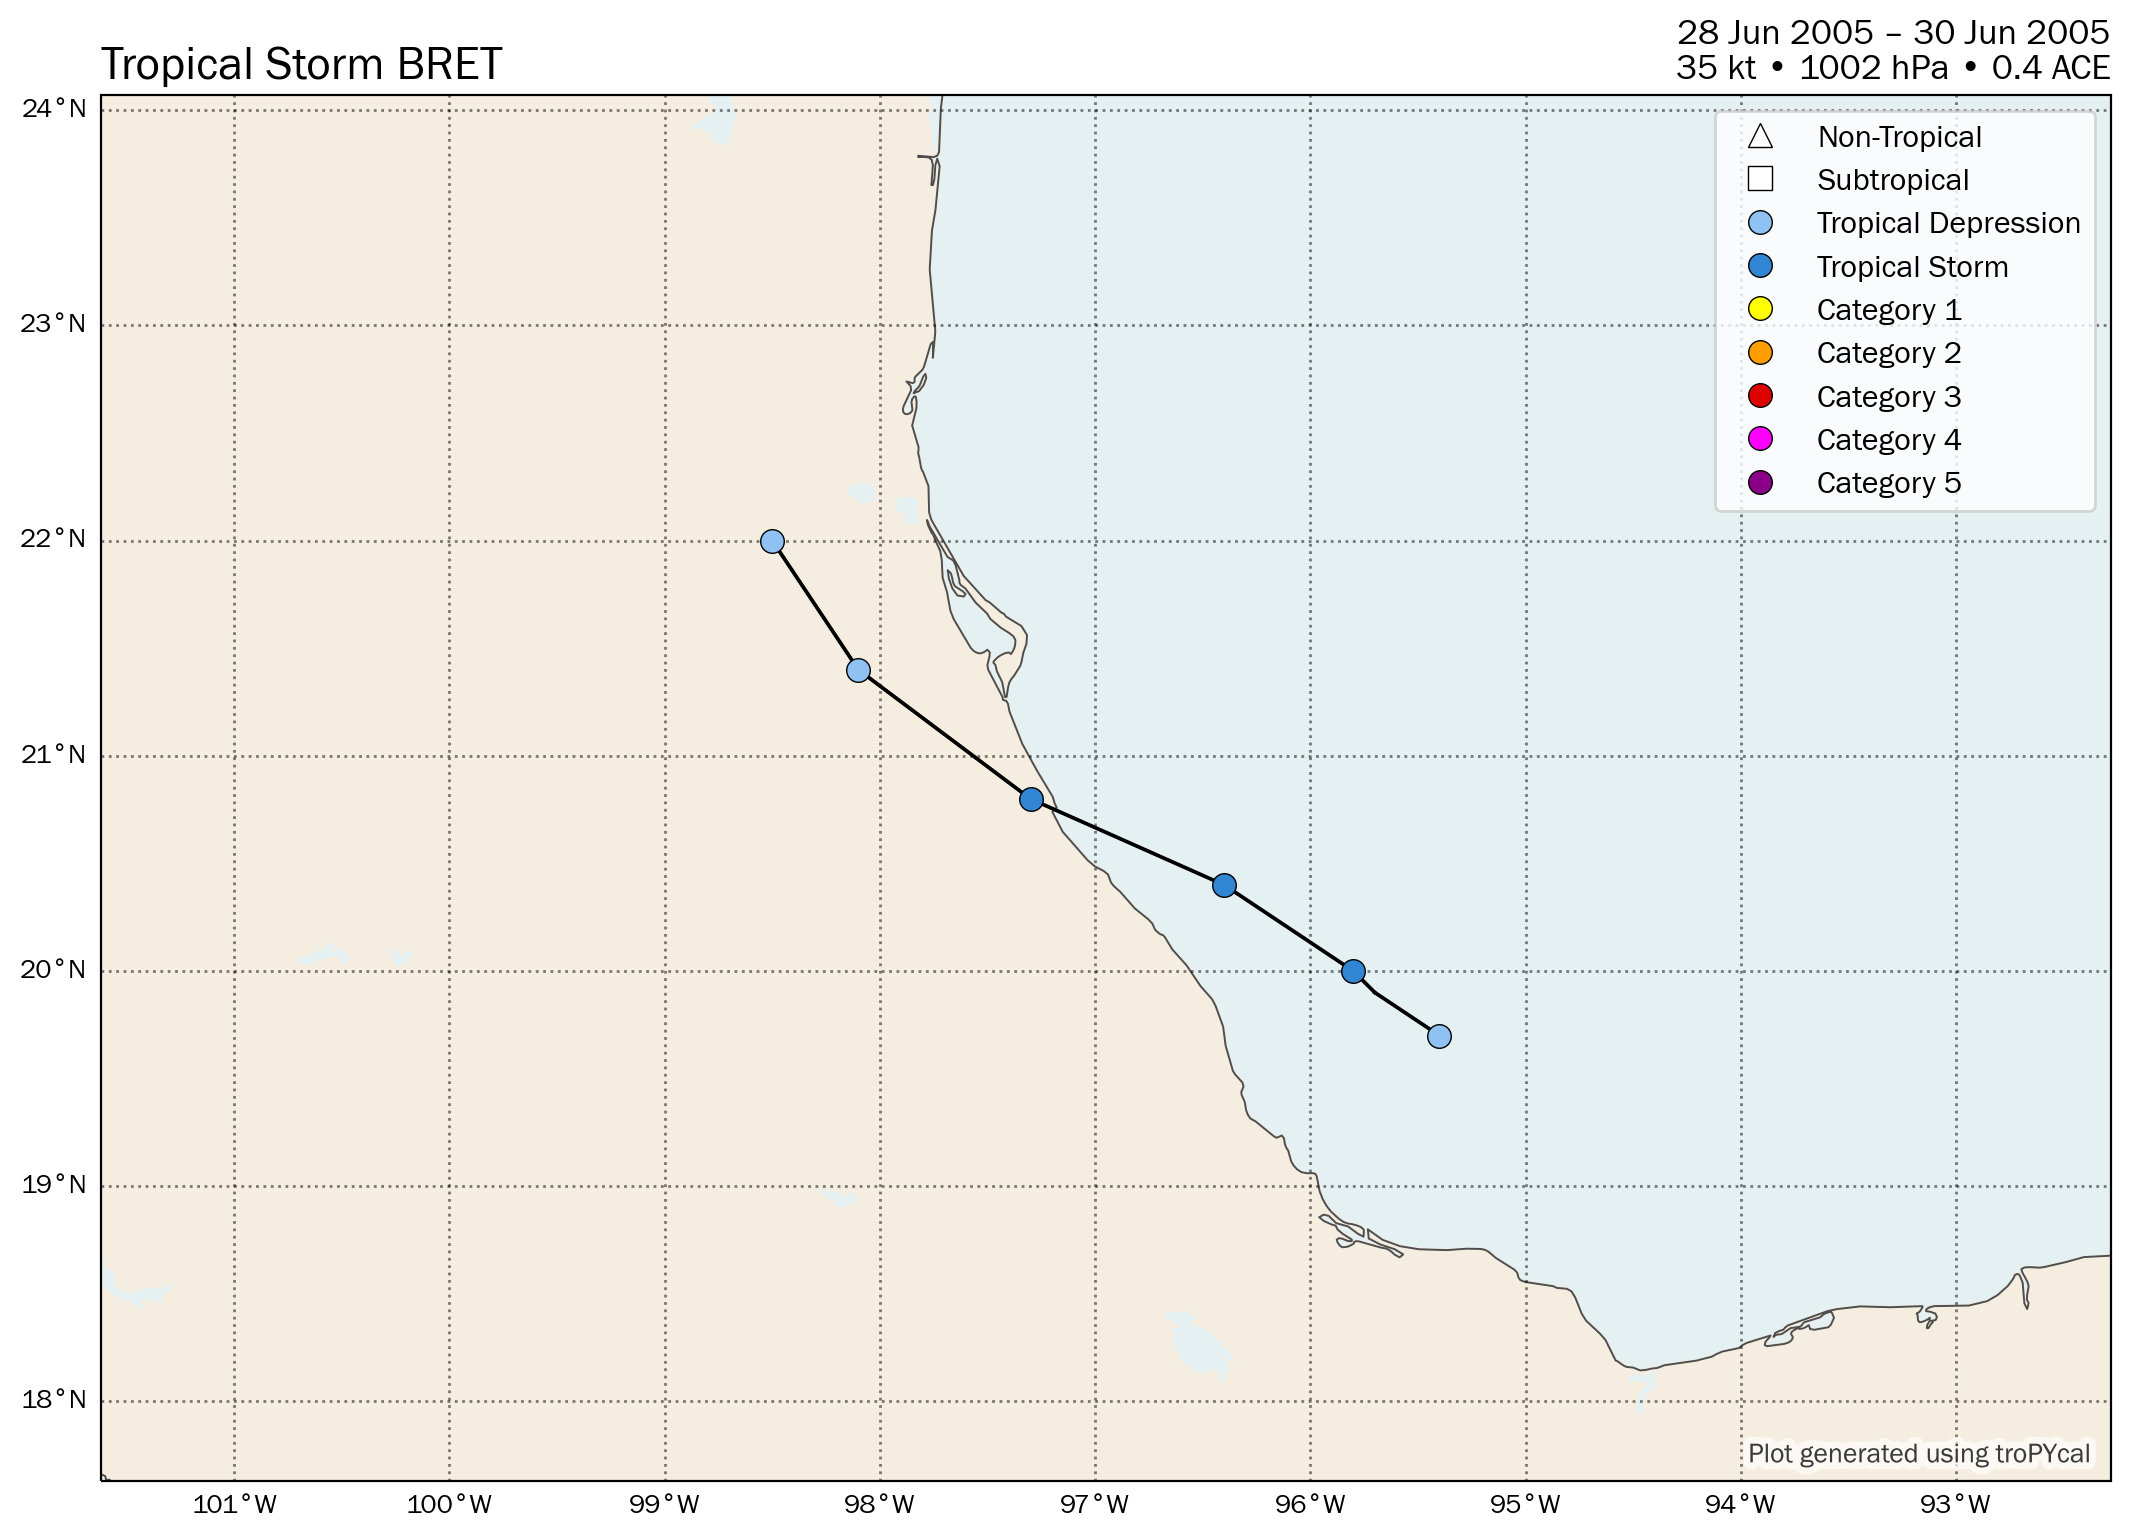
| S | Tropical Storm Bret | 35 kt | 1002 hPa | 18z 06/28 | 00z 06/30 | 0.4 |
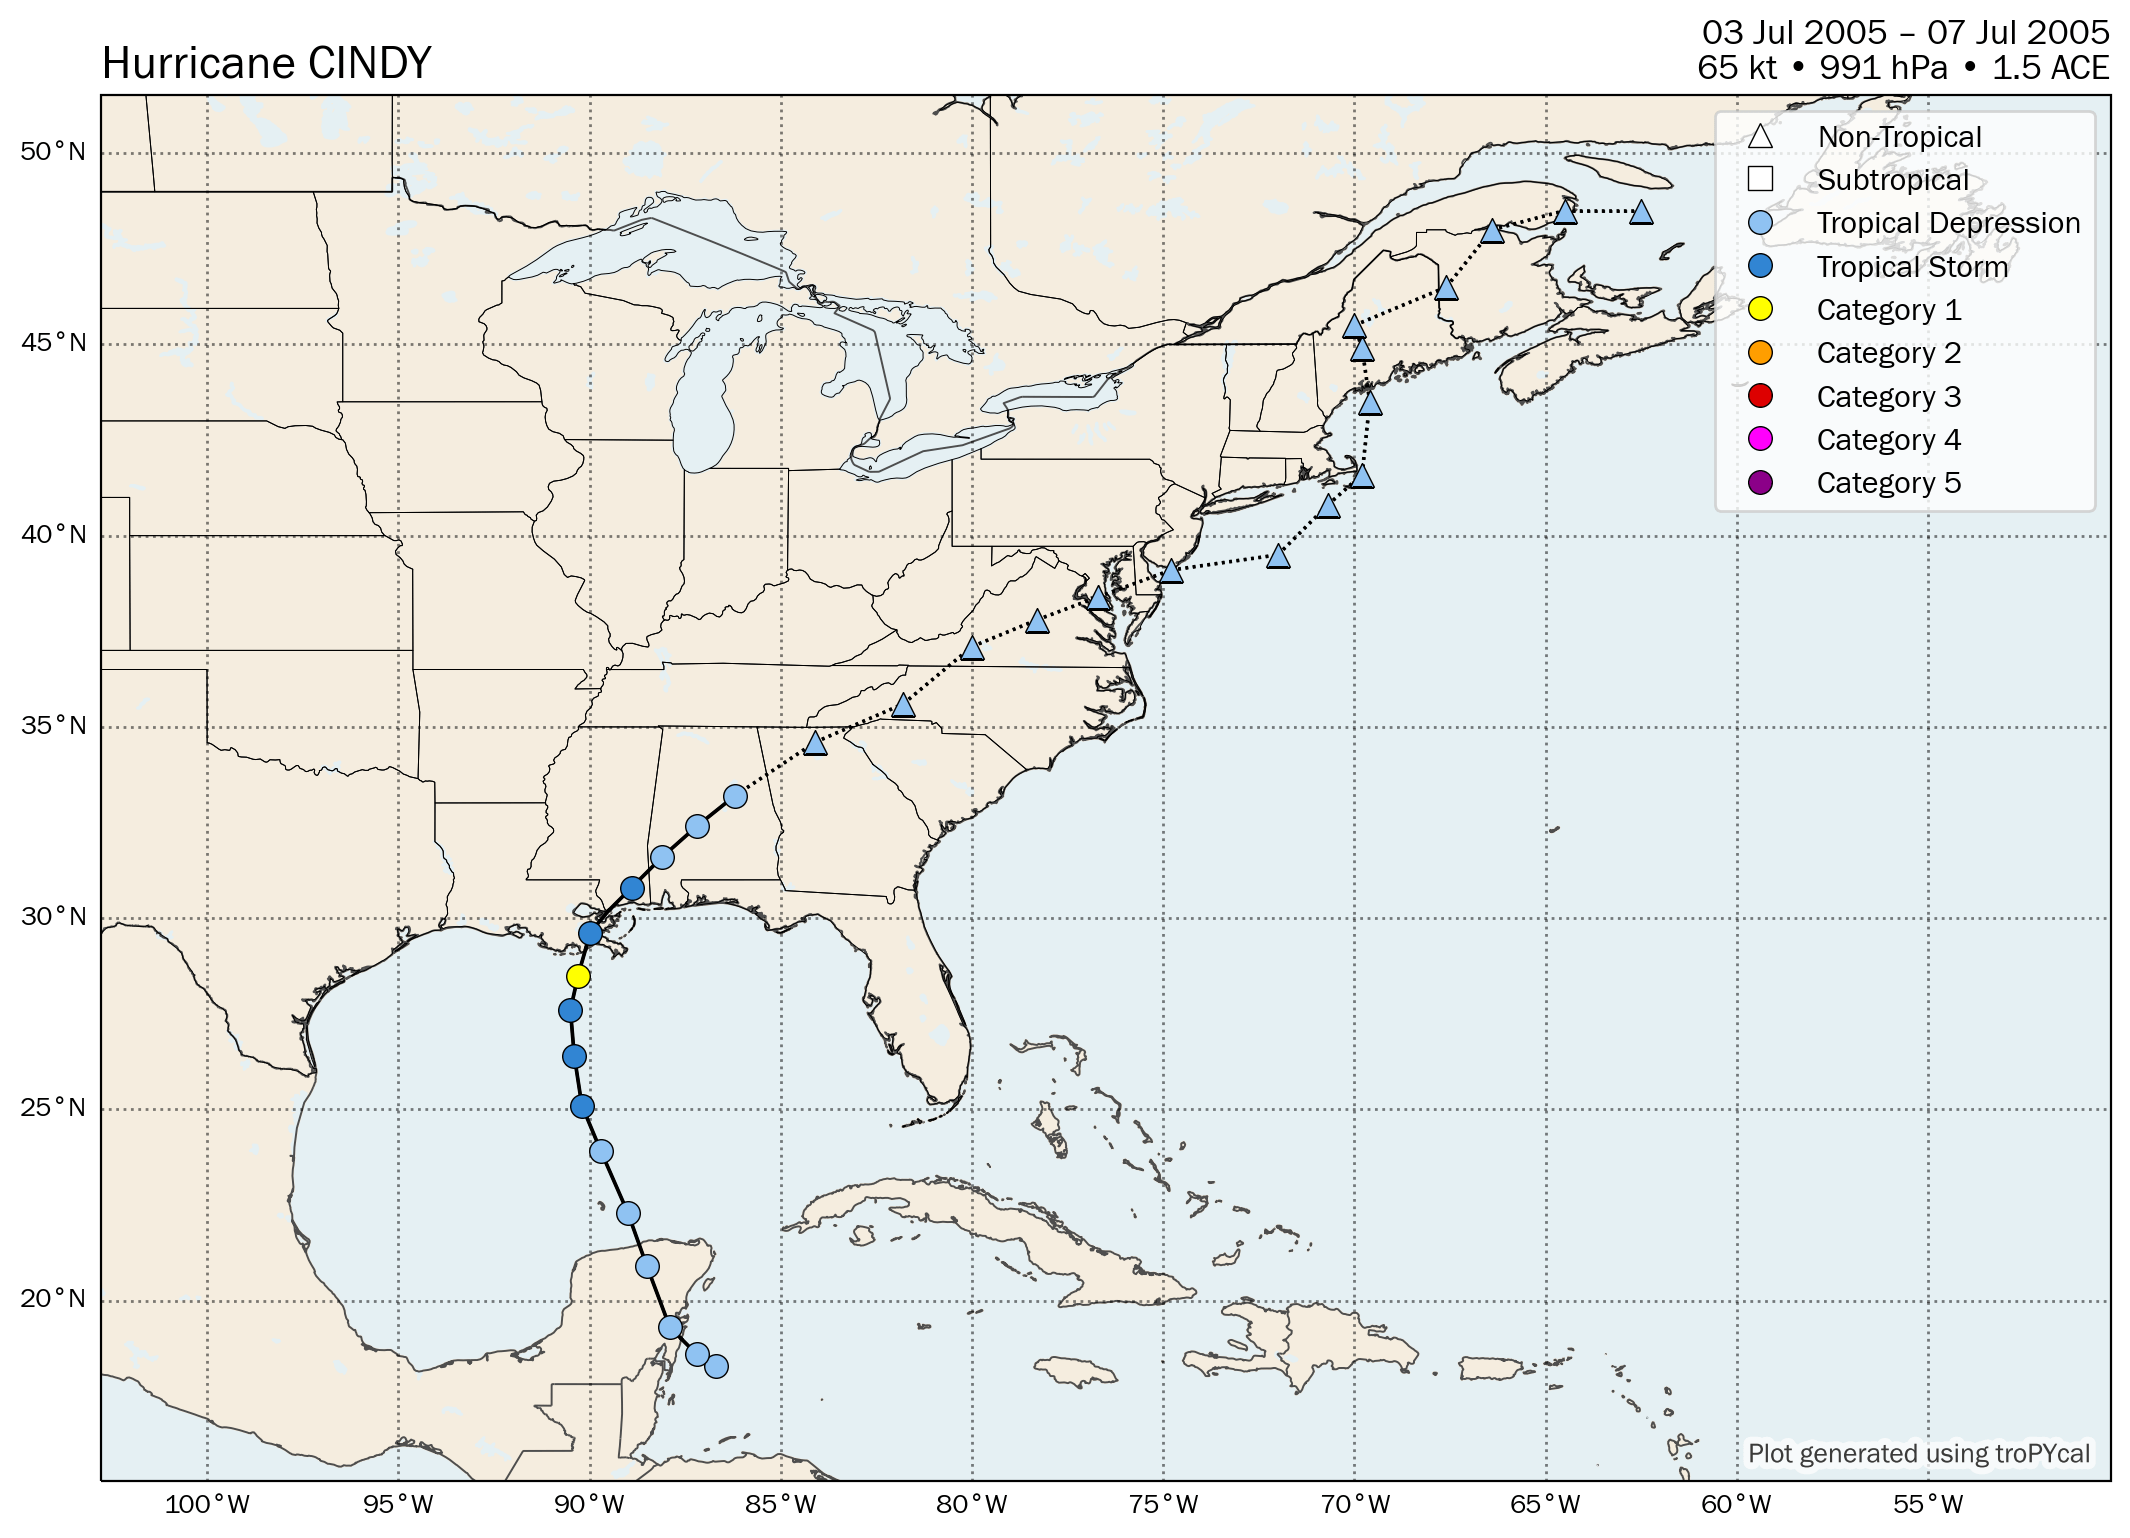
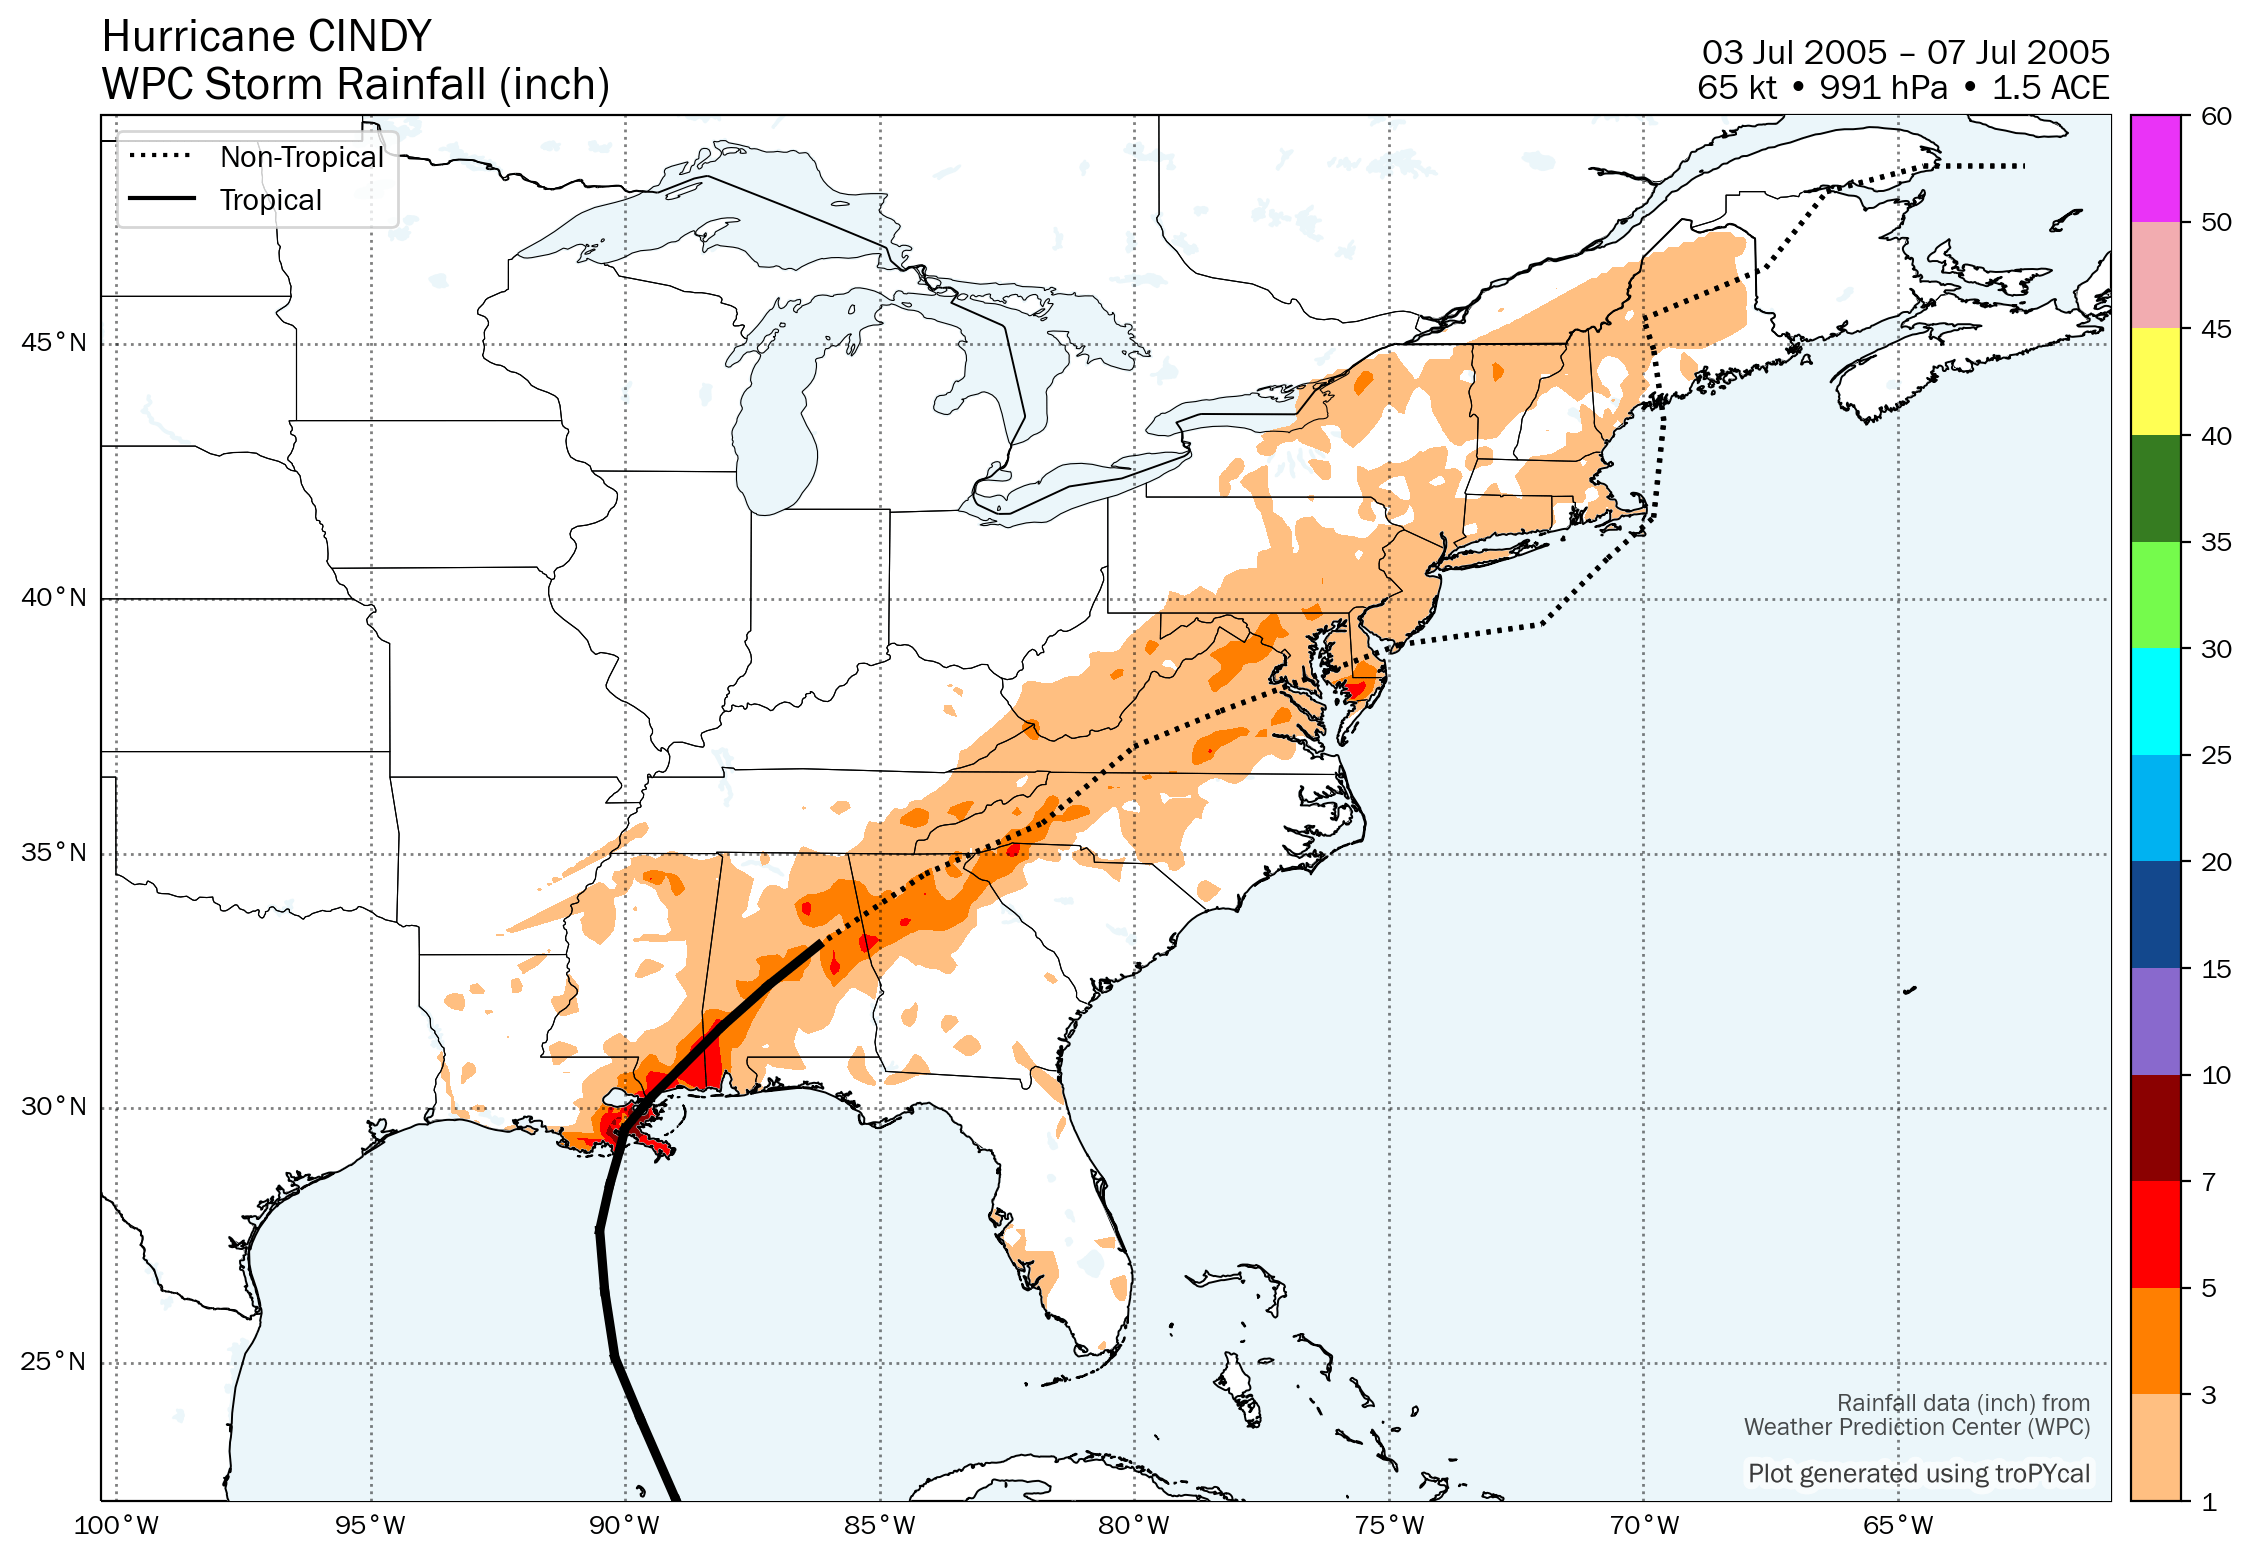
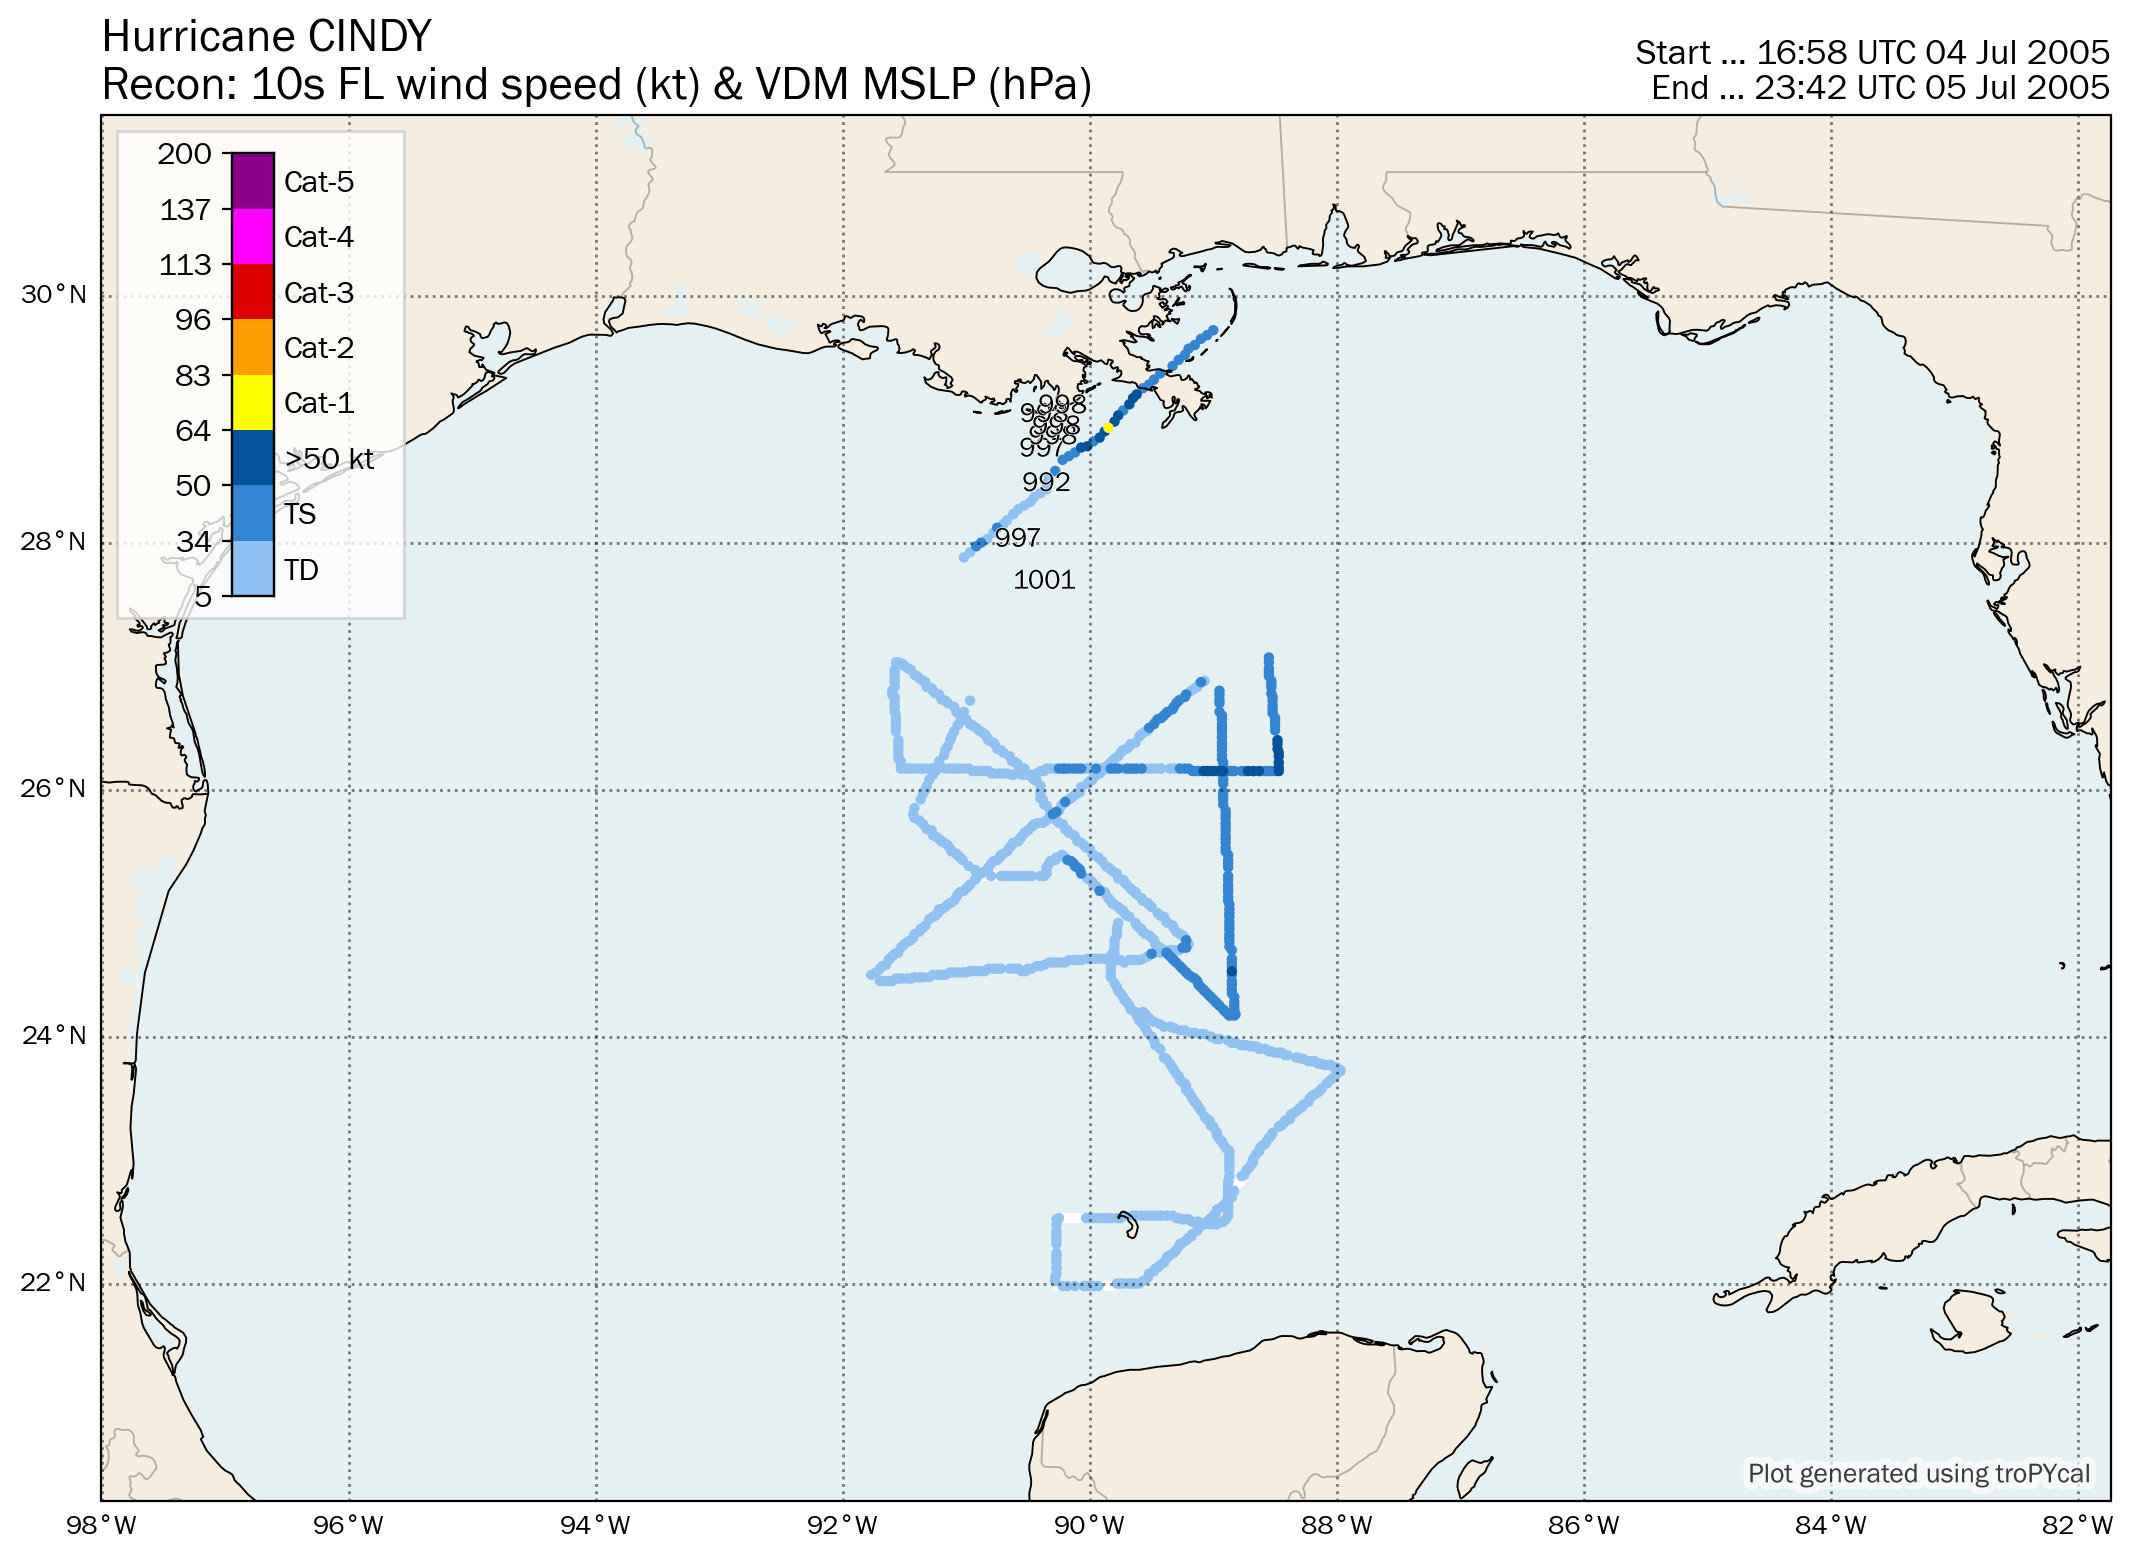
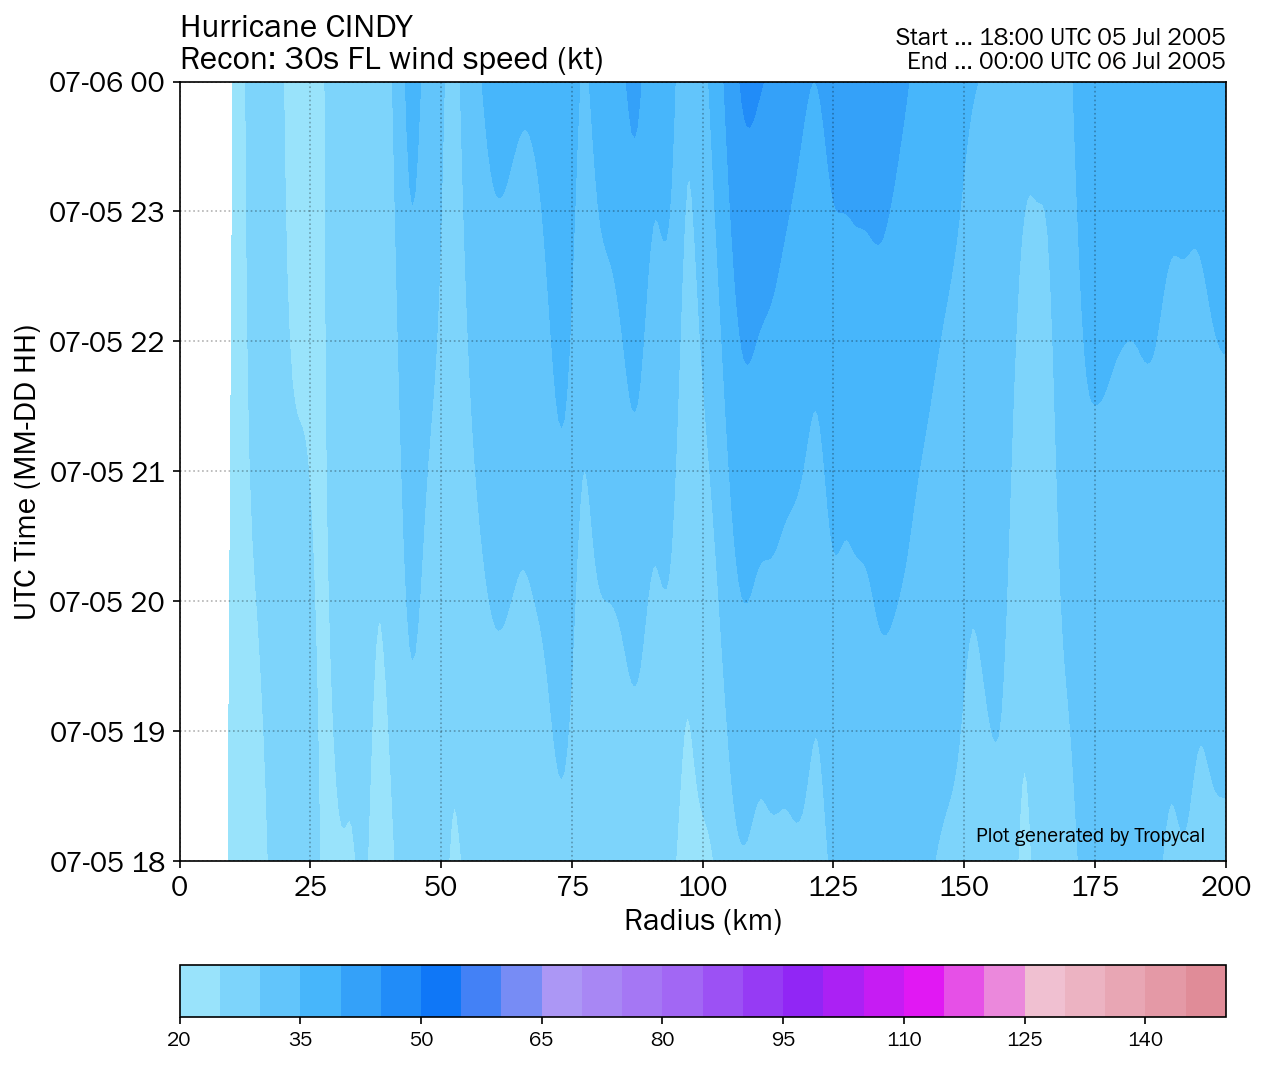
| 1 | Hurricane Cindy | 65 kt | 991 hPa | 18z 07/03 | 06z 07/07 | 1.5 |
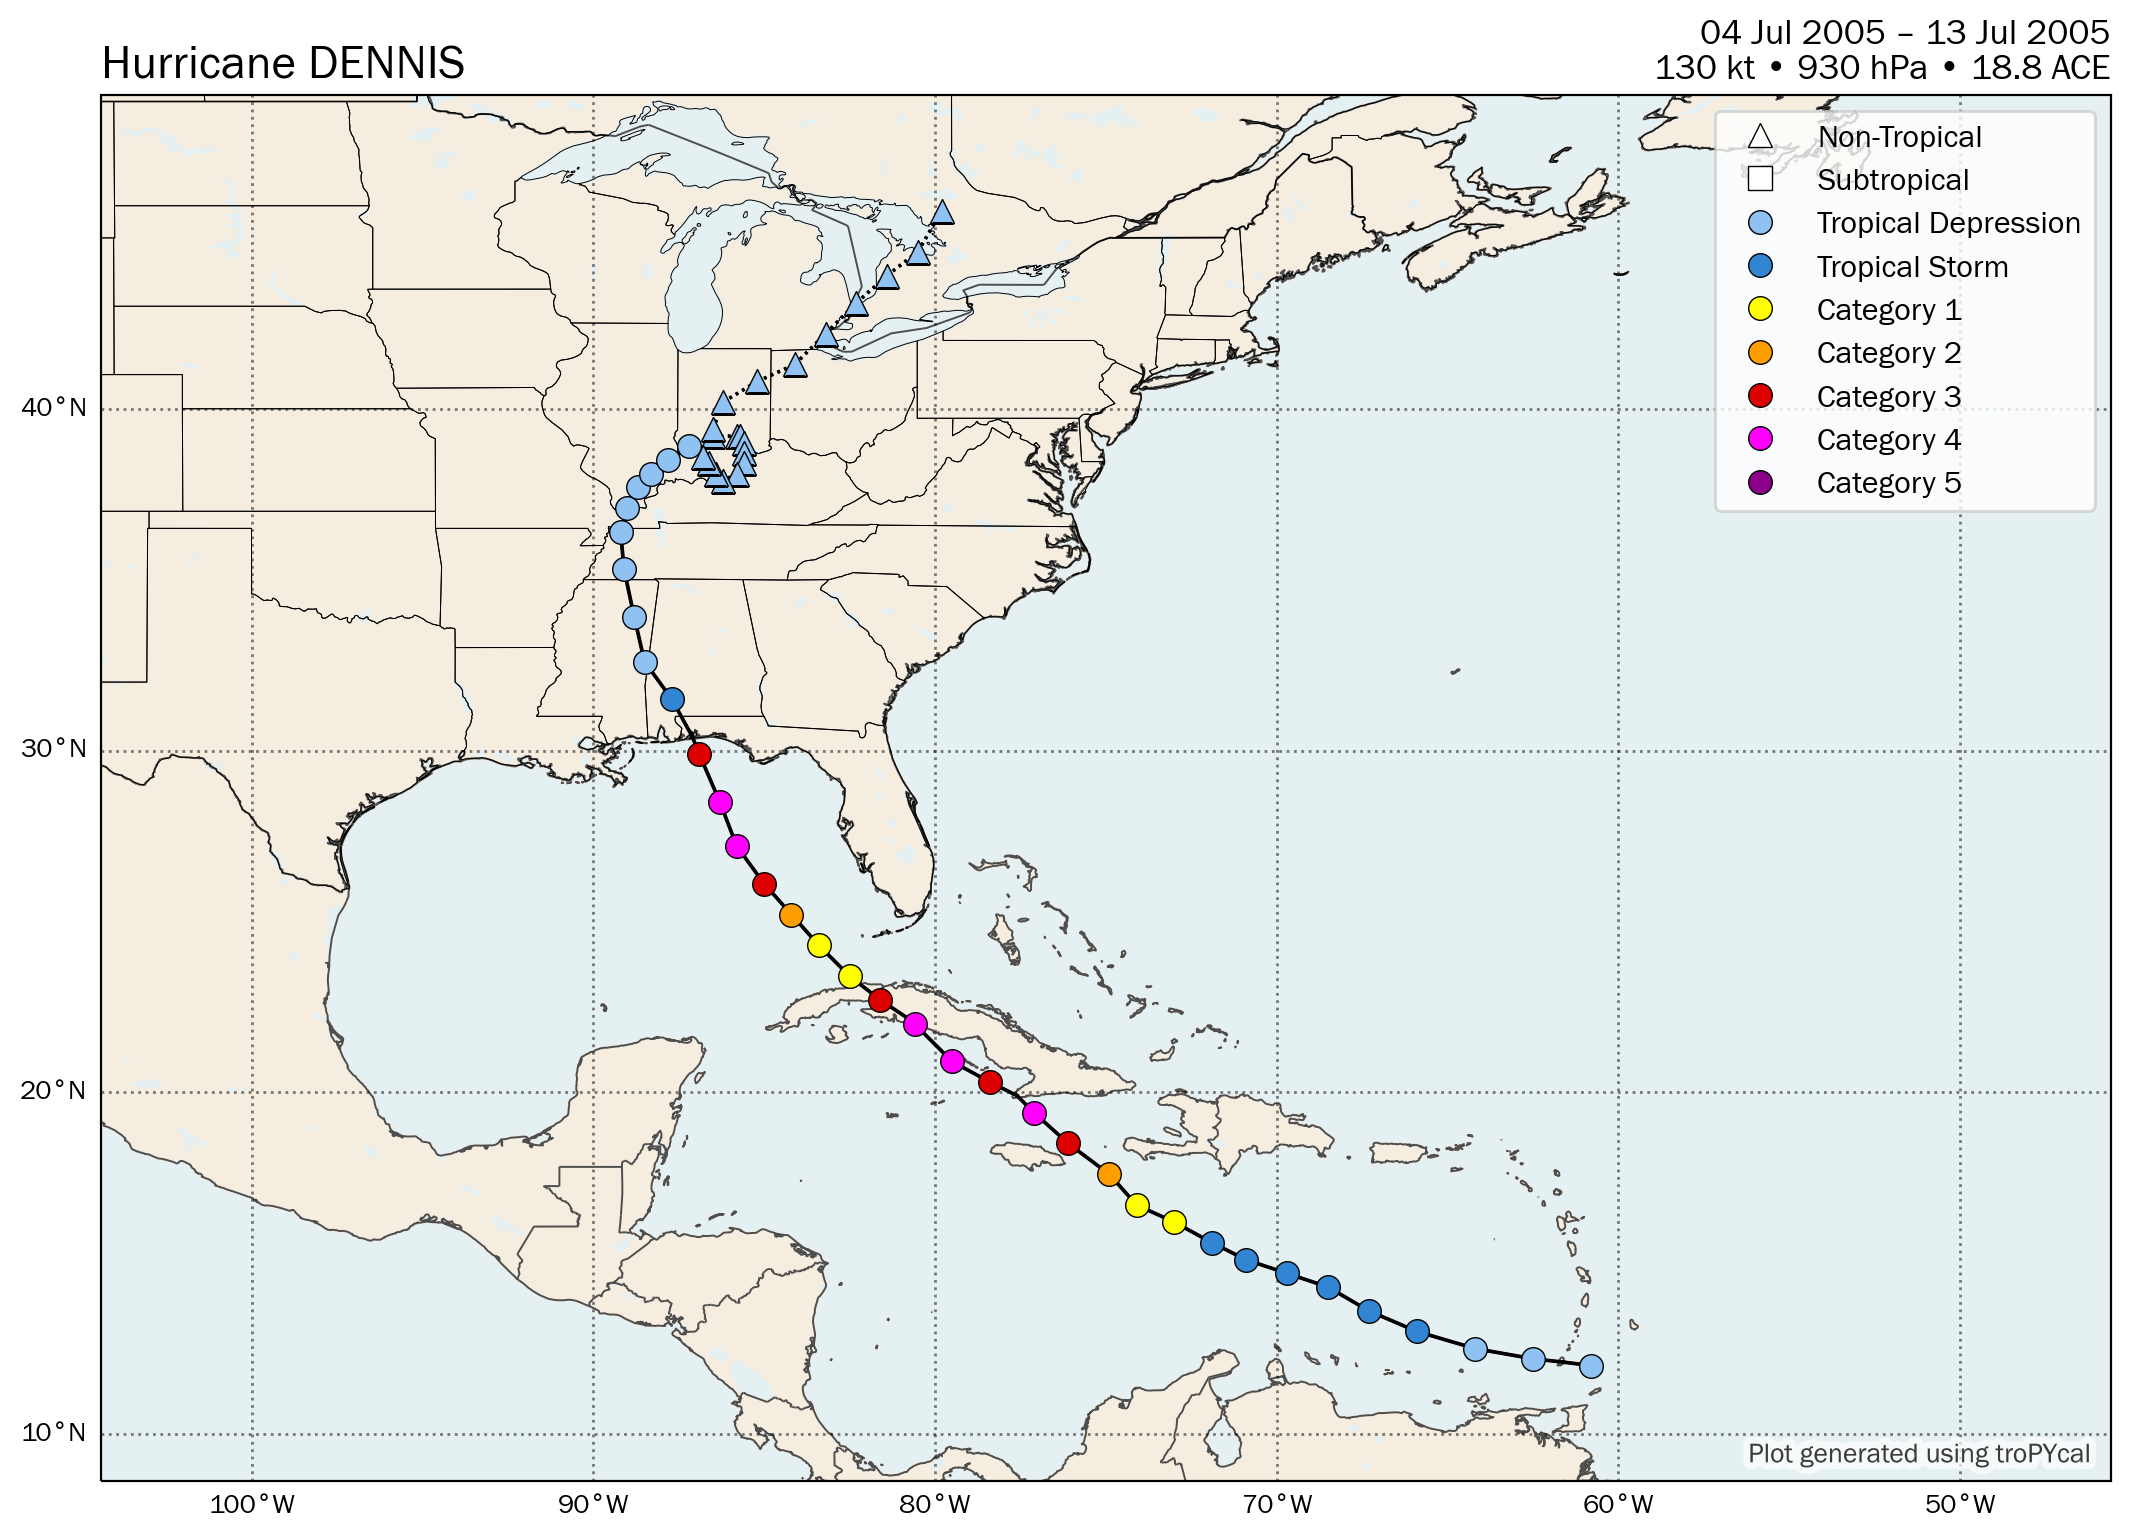
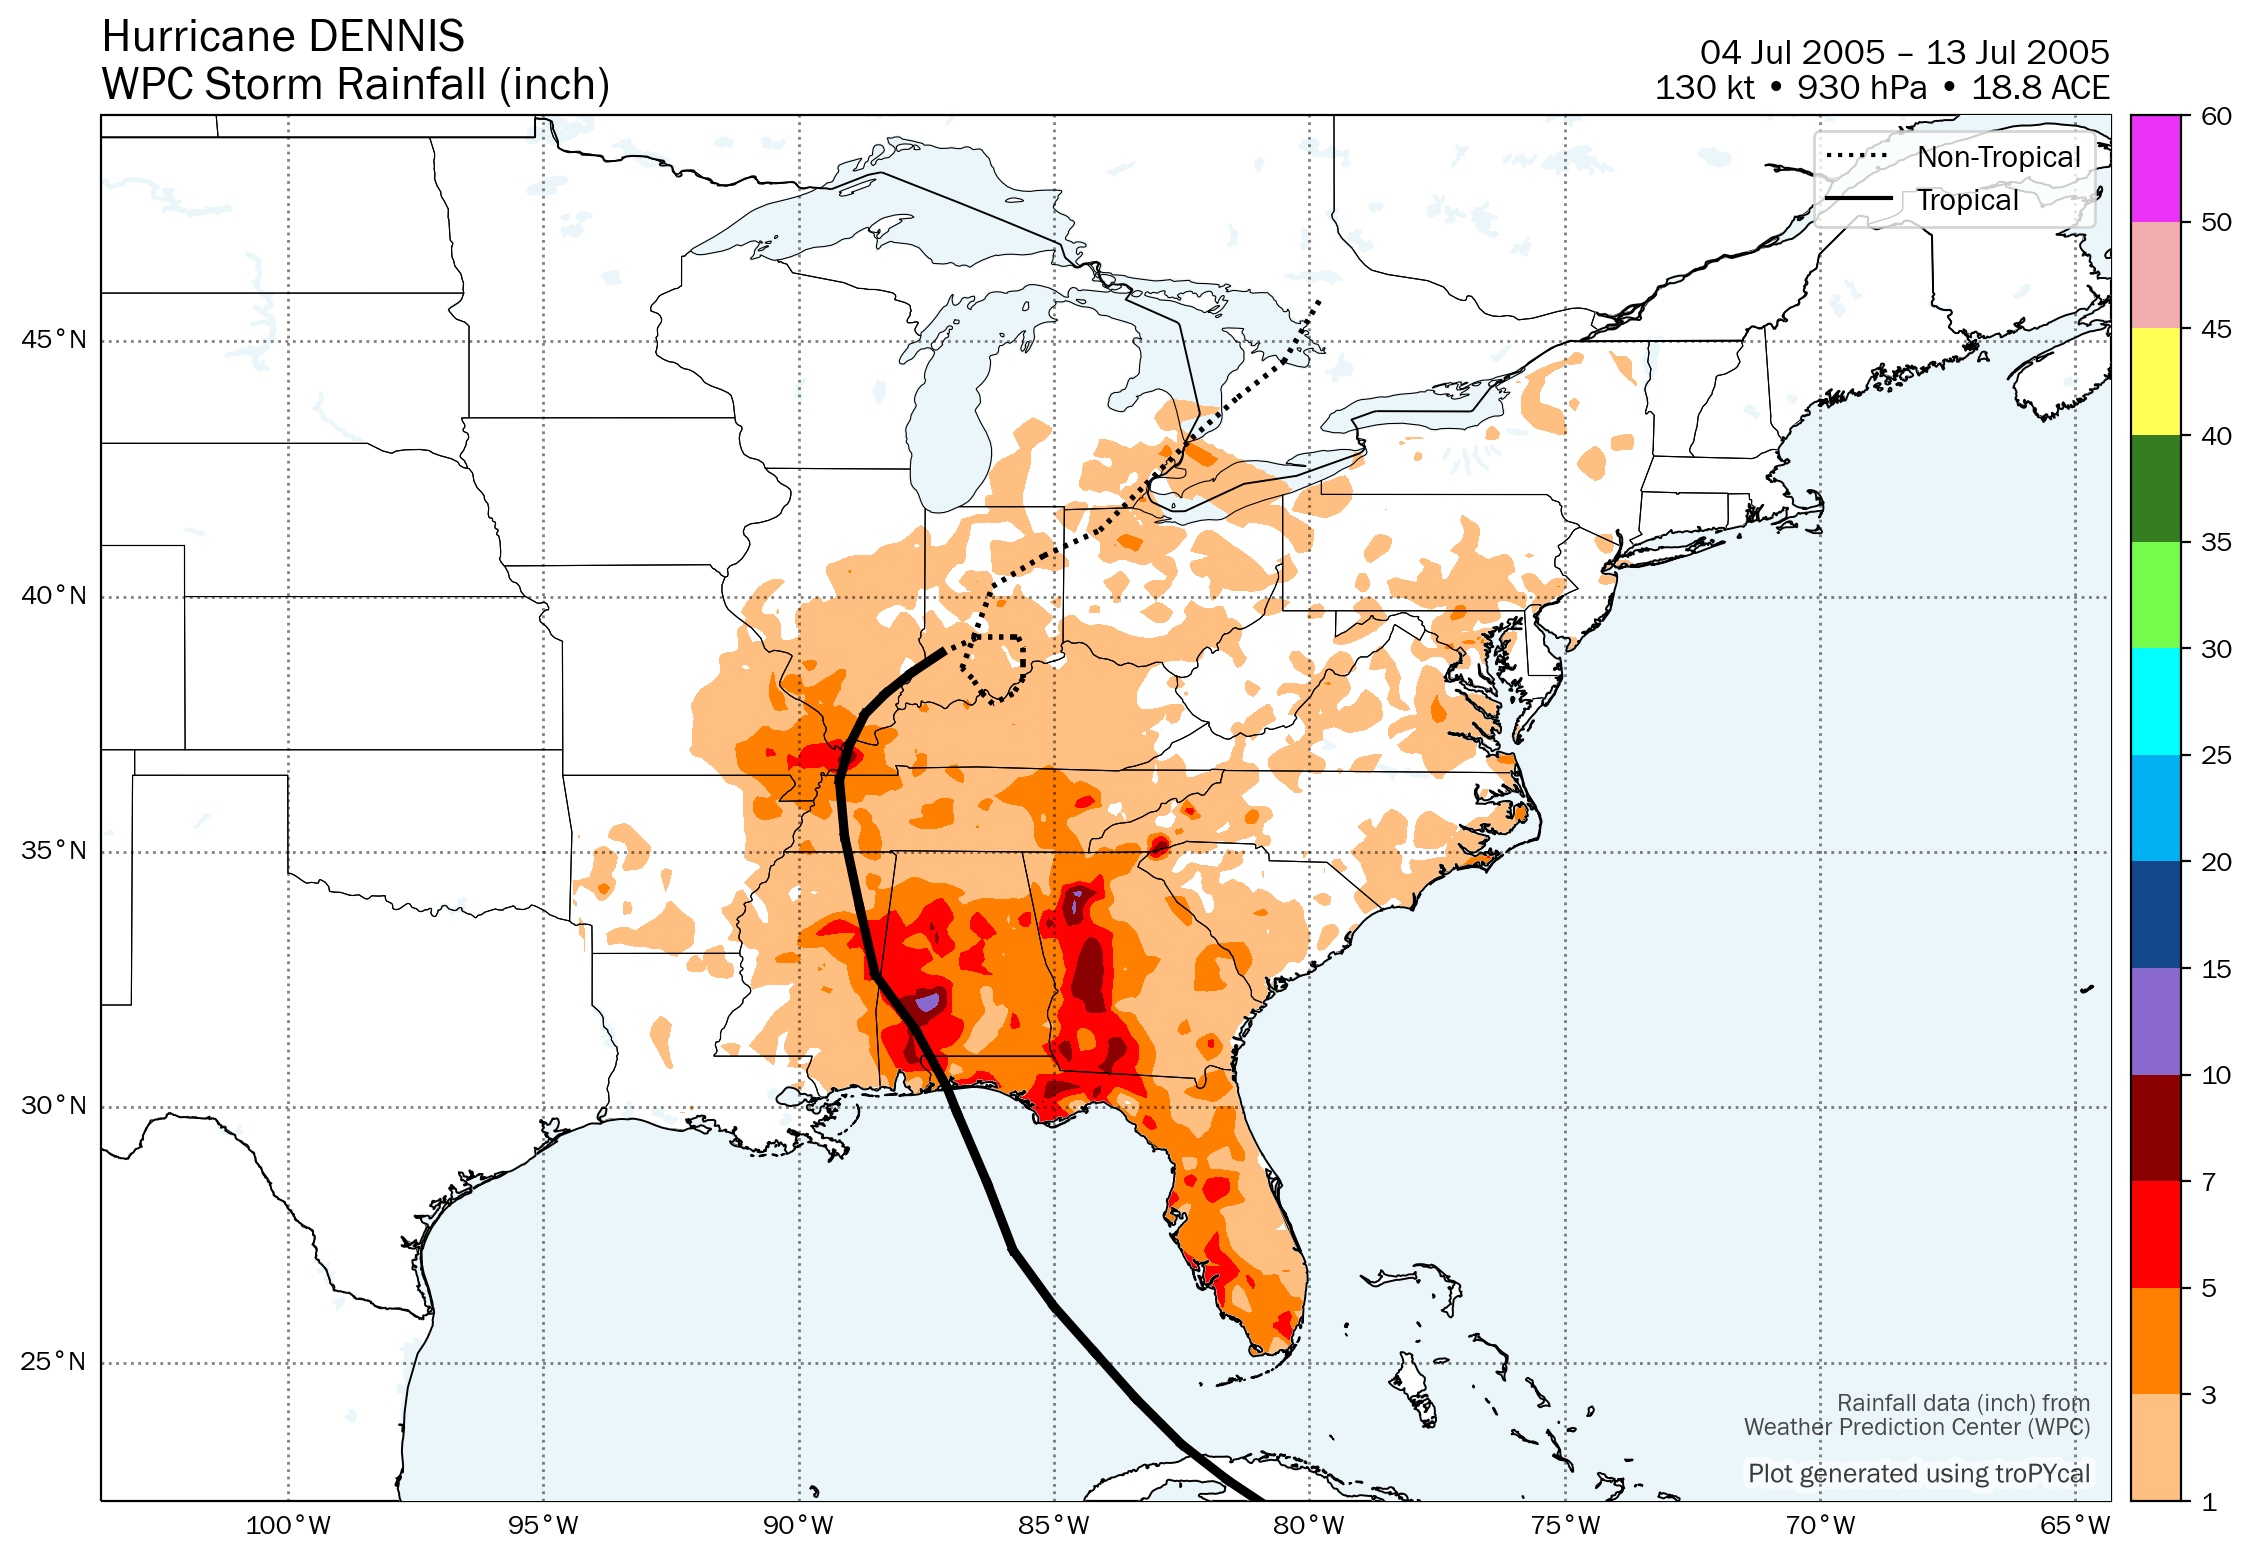
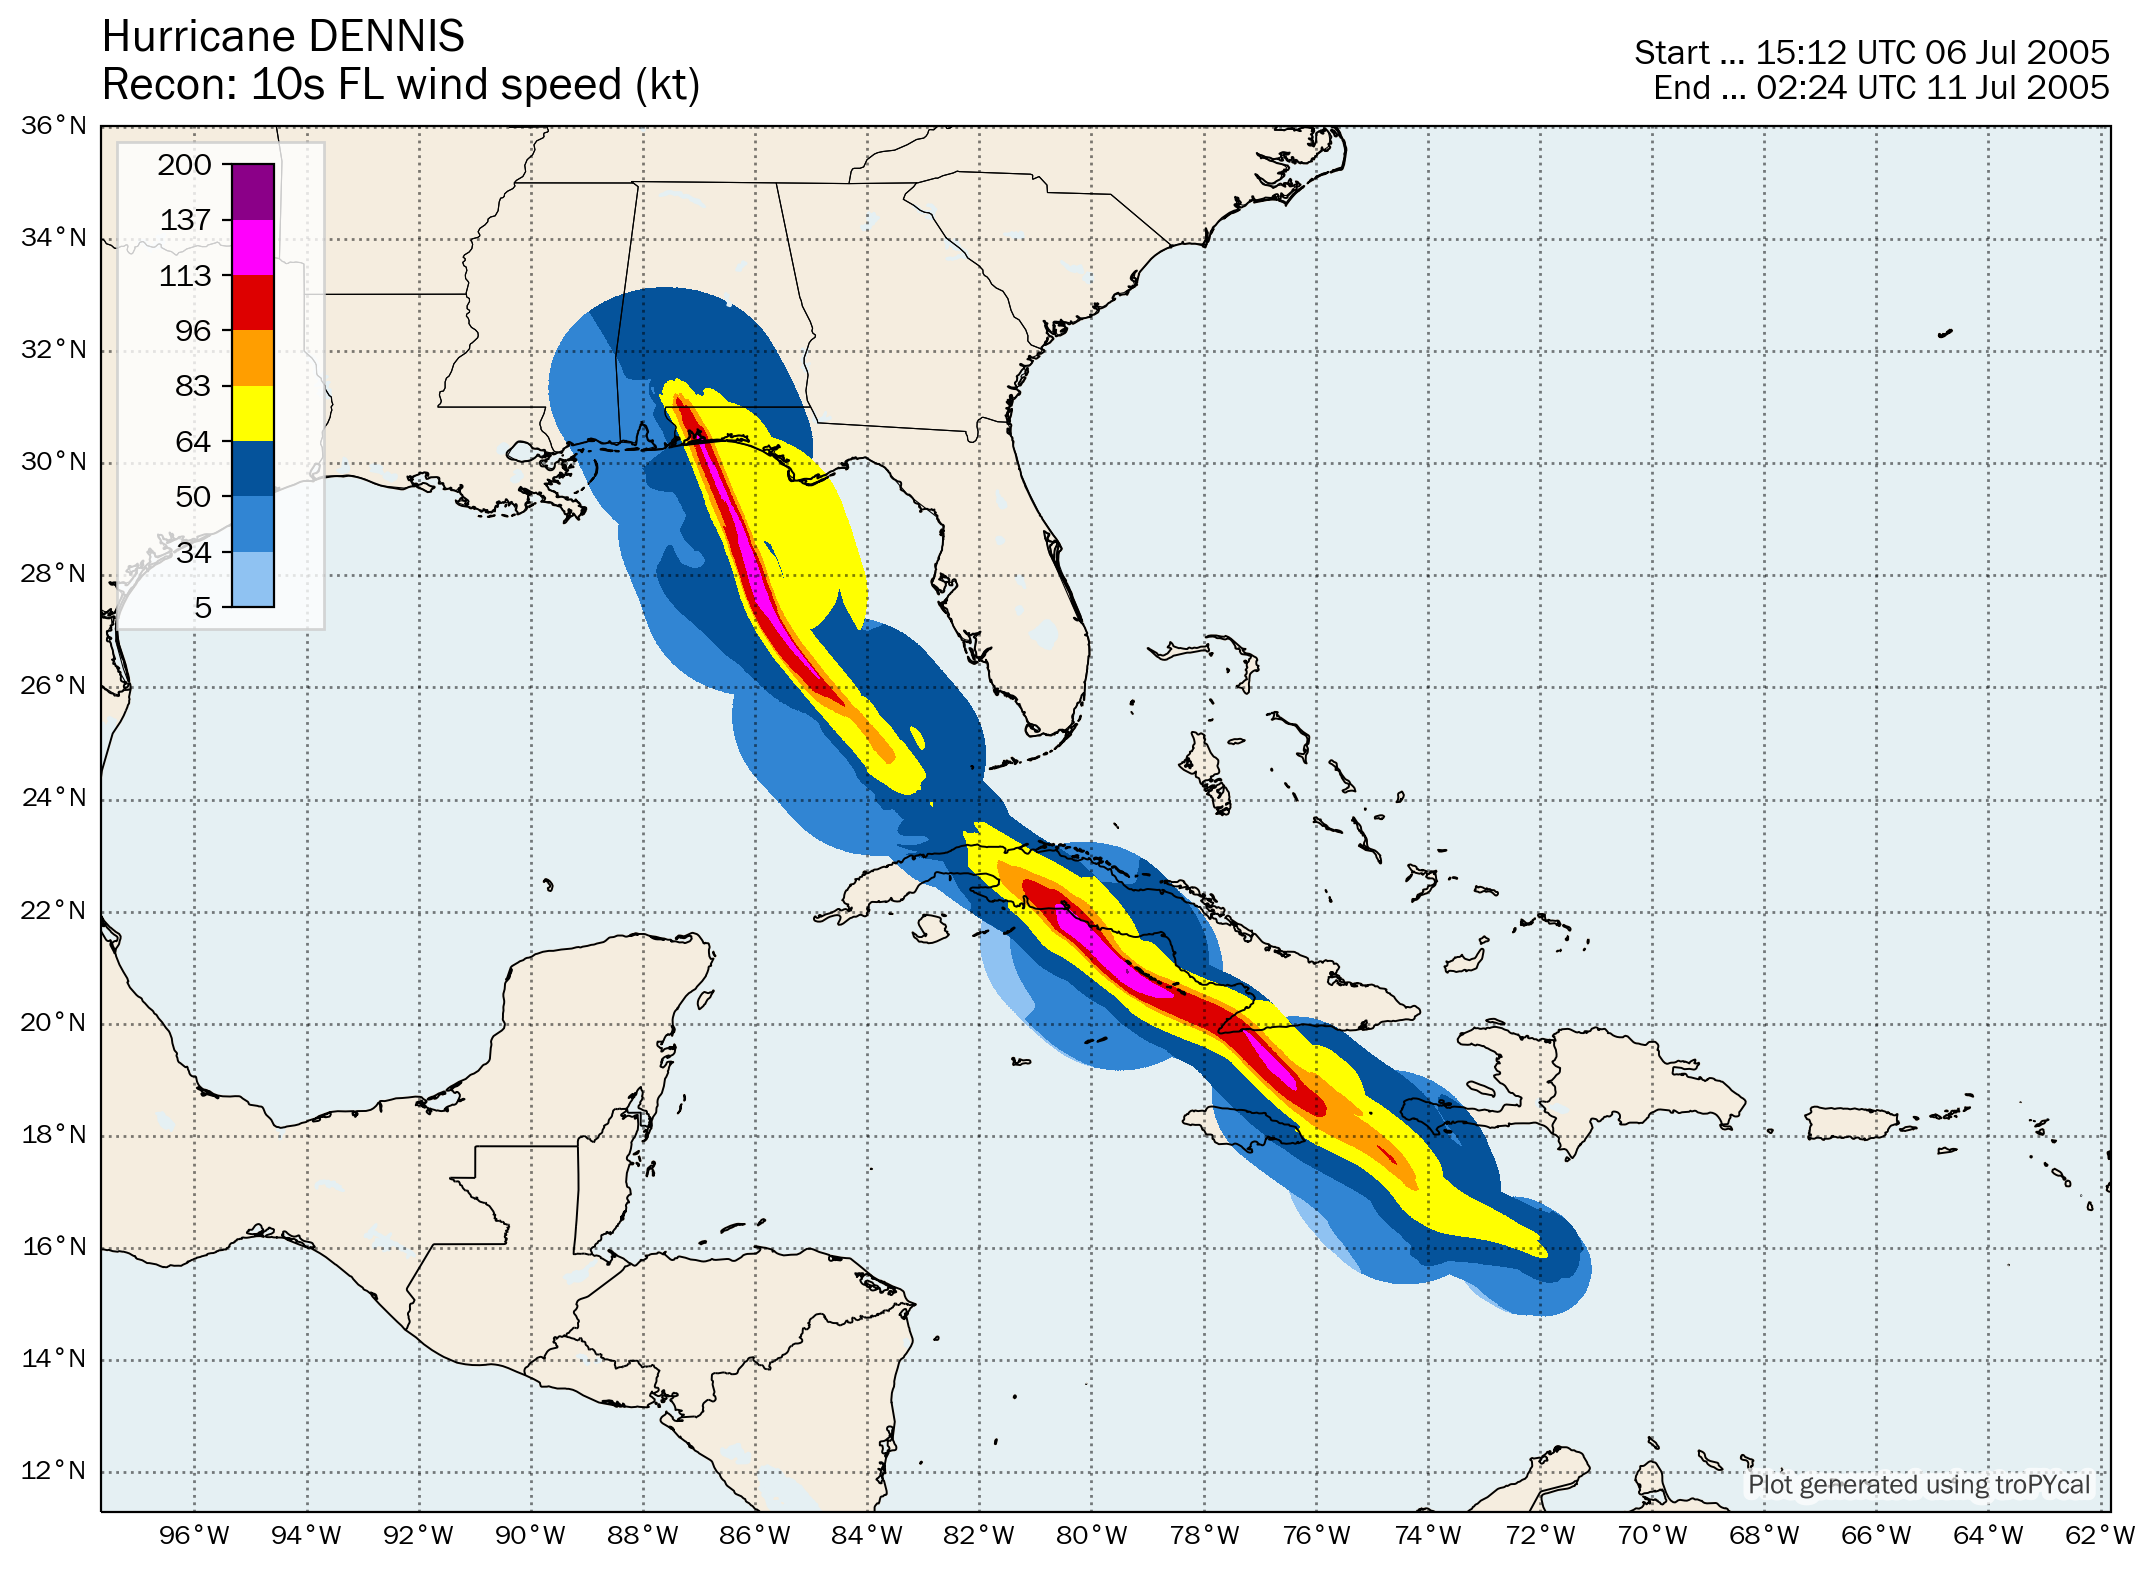
| 4 | Hurricane Dennis | 130 kt | 930 hPa | 18z 07/04 | 06z 07/13 | 18.8 |
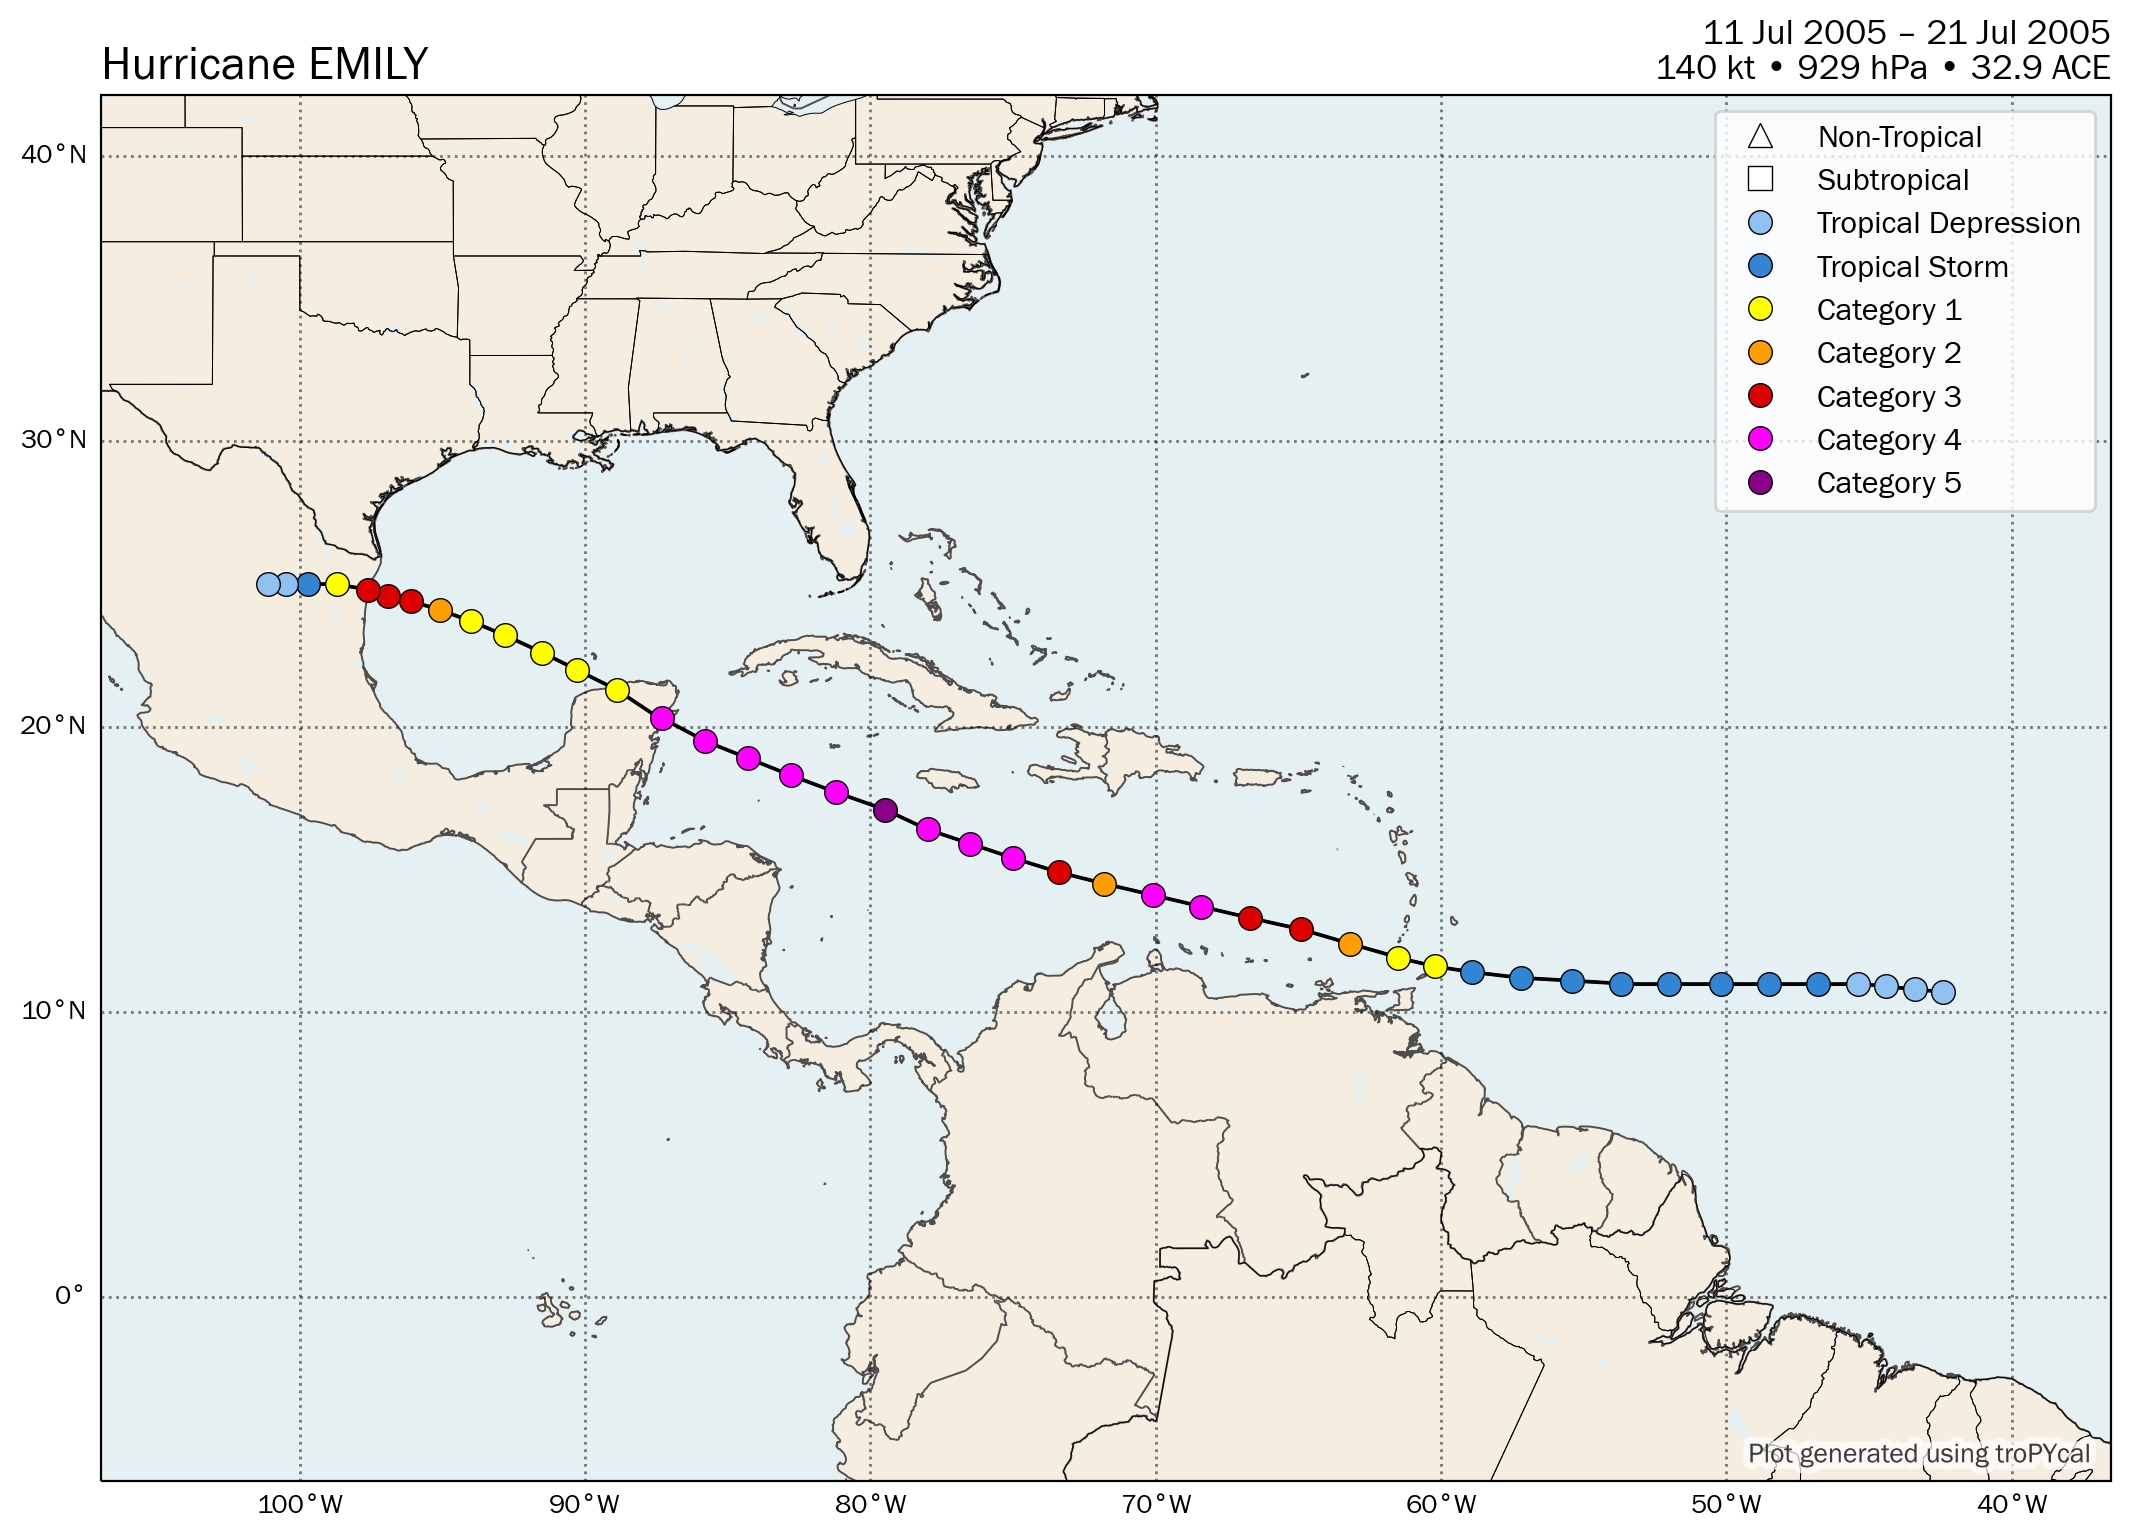
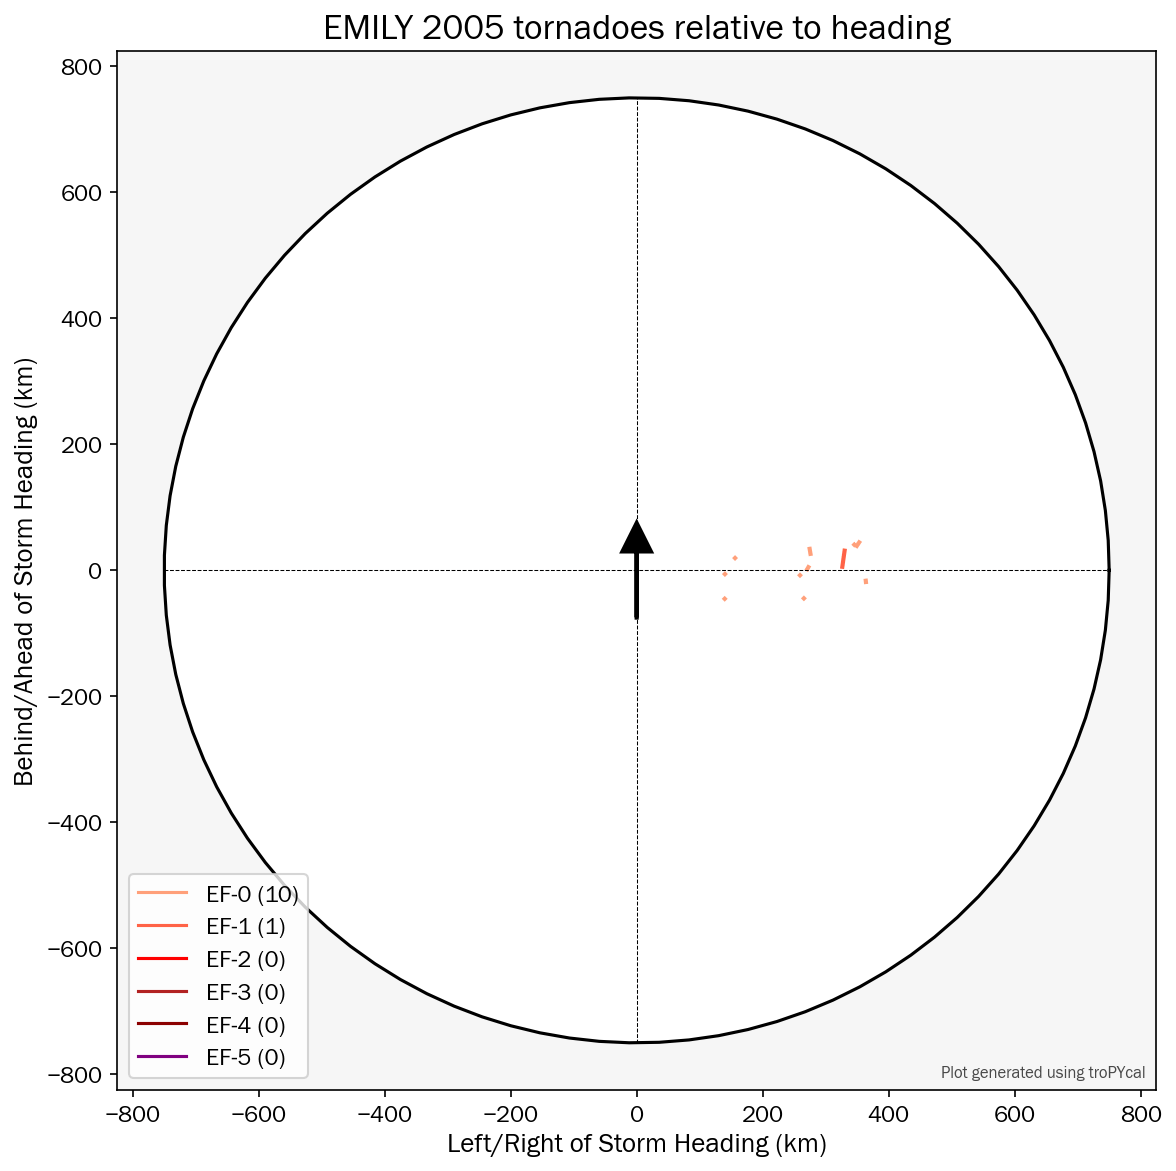
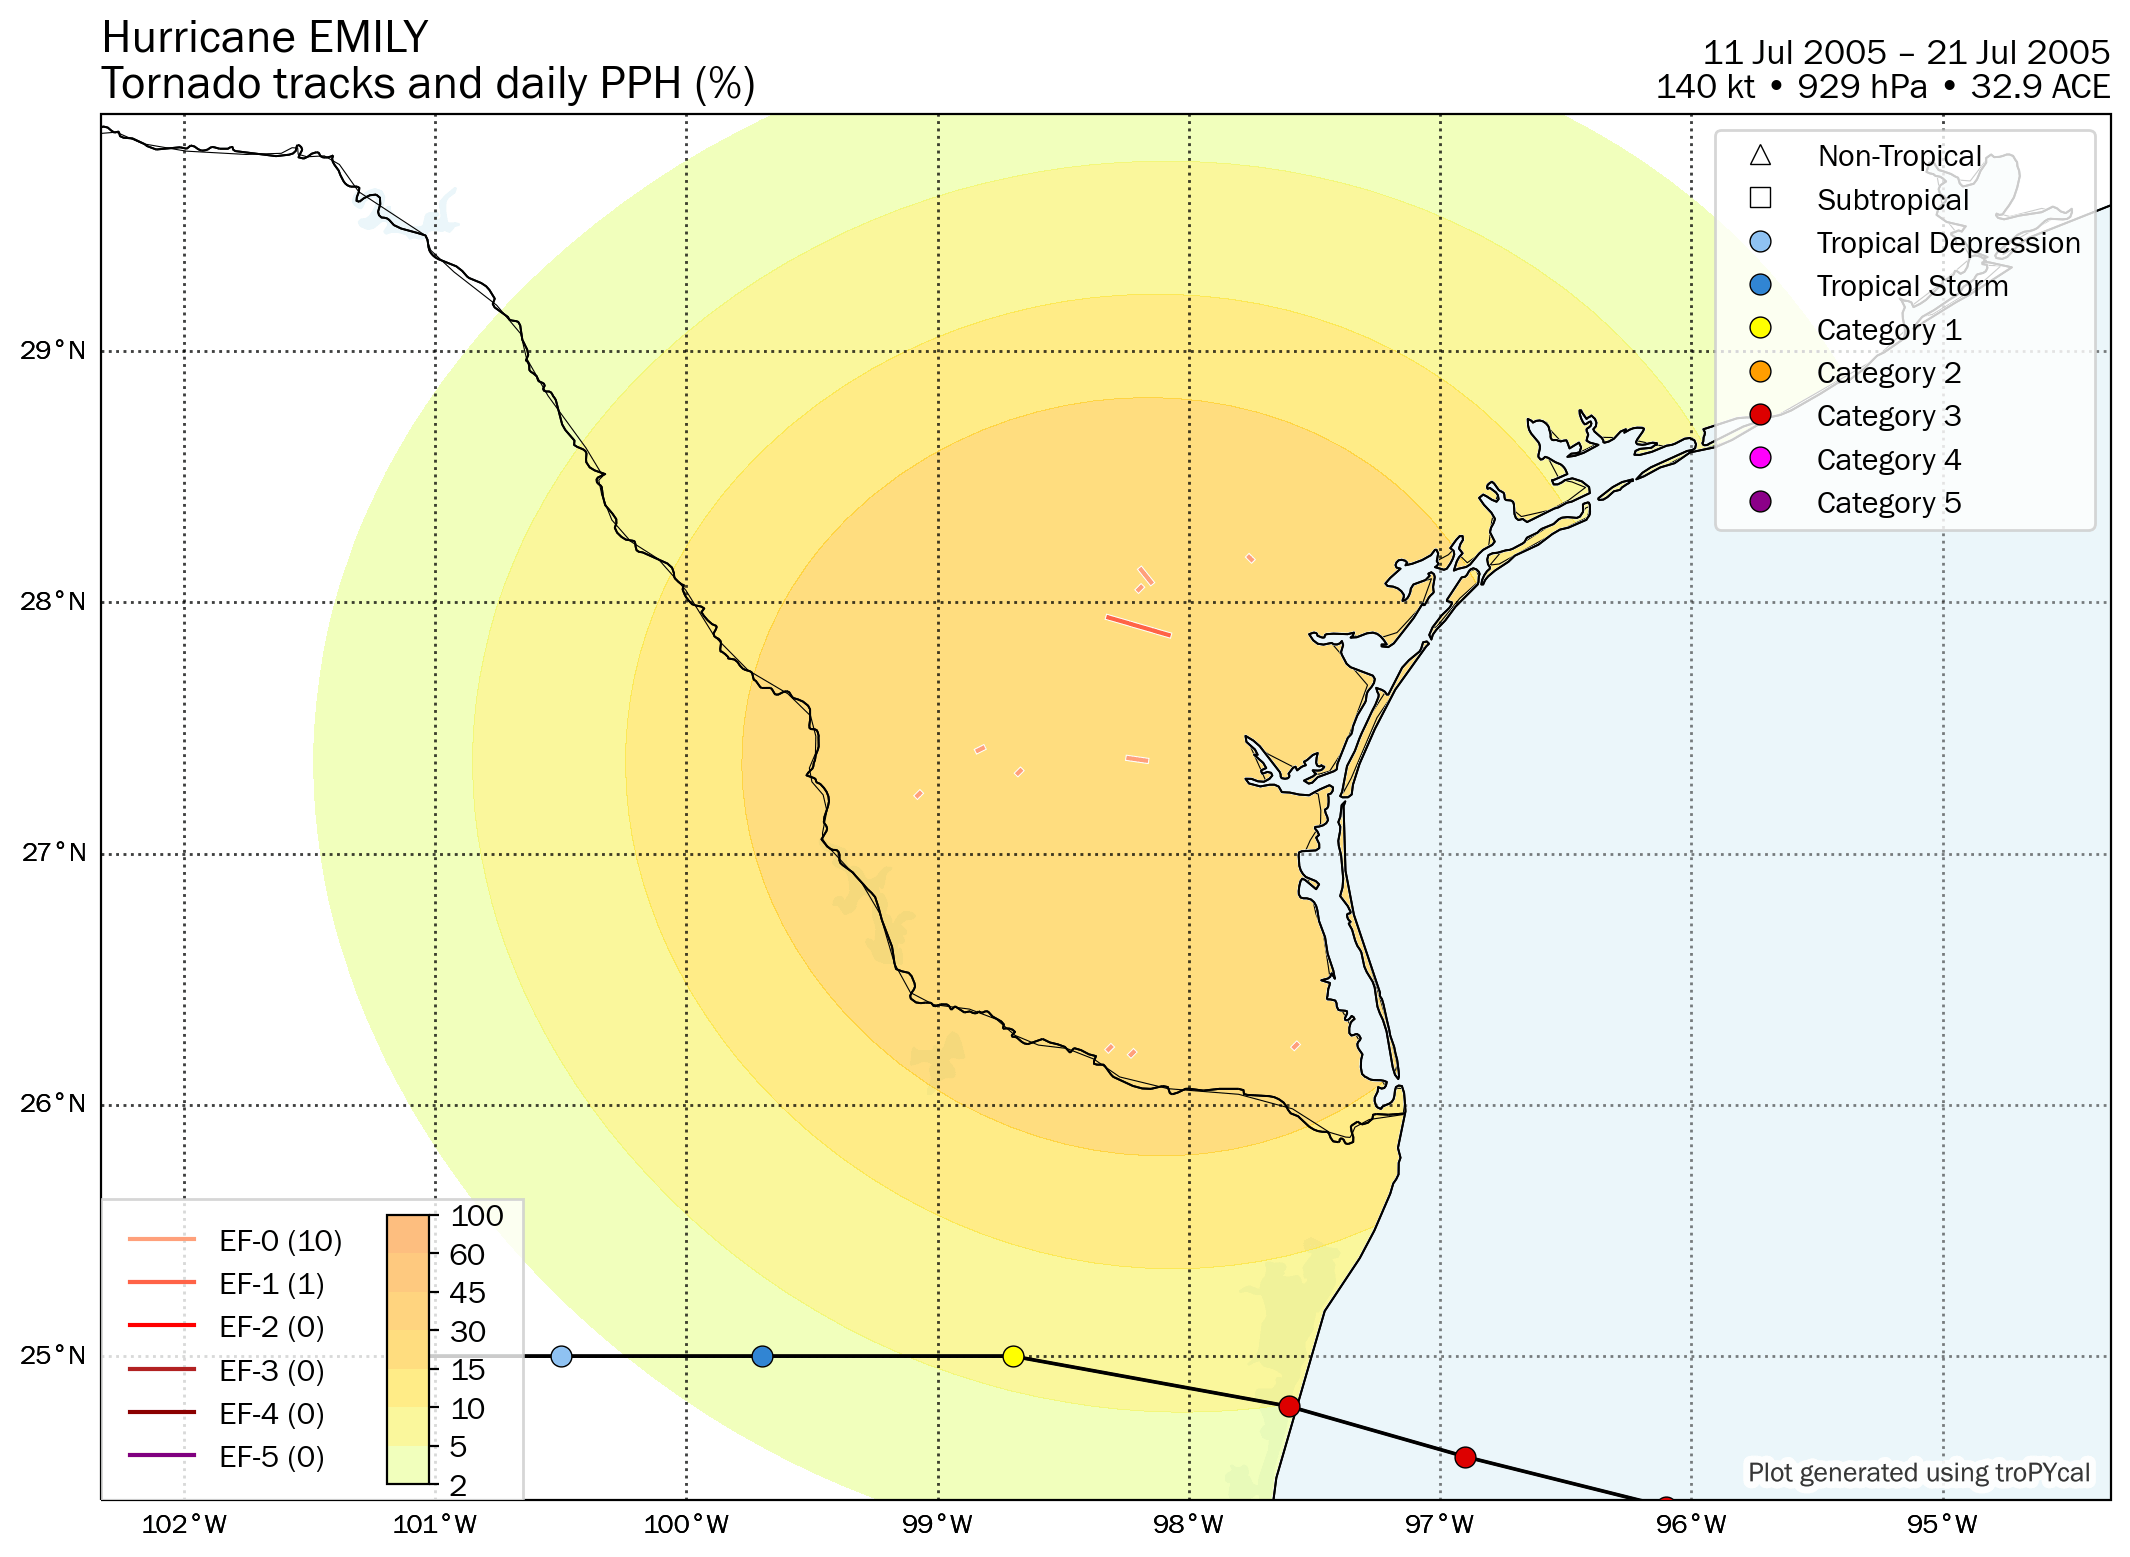
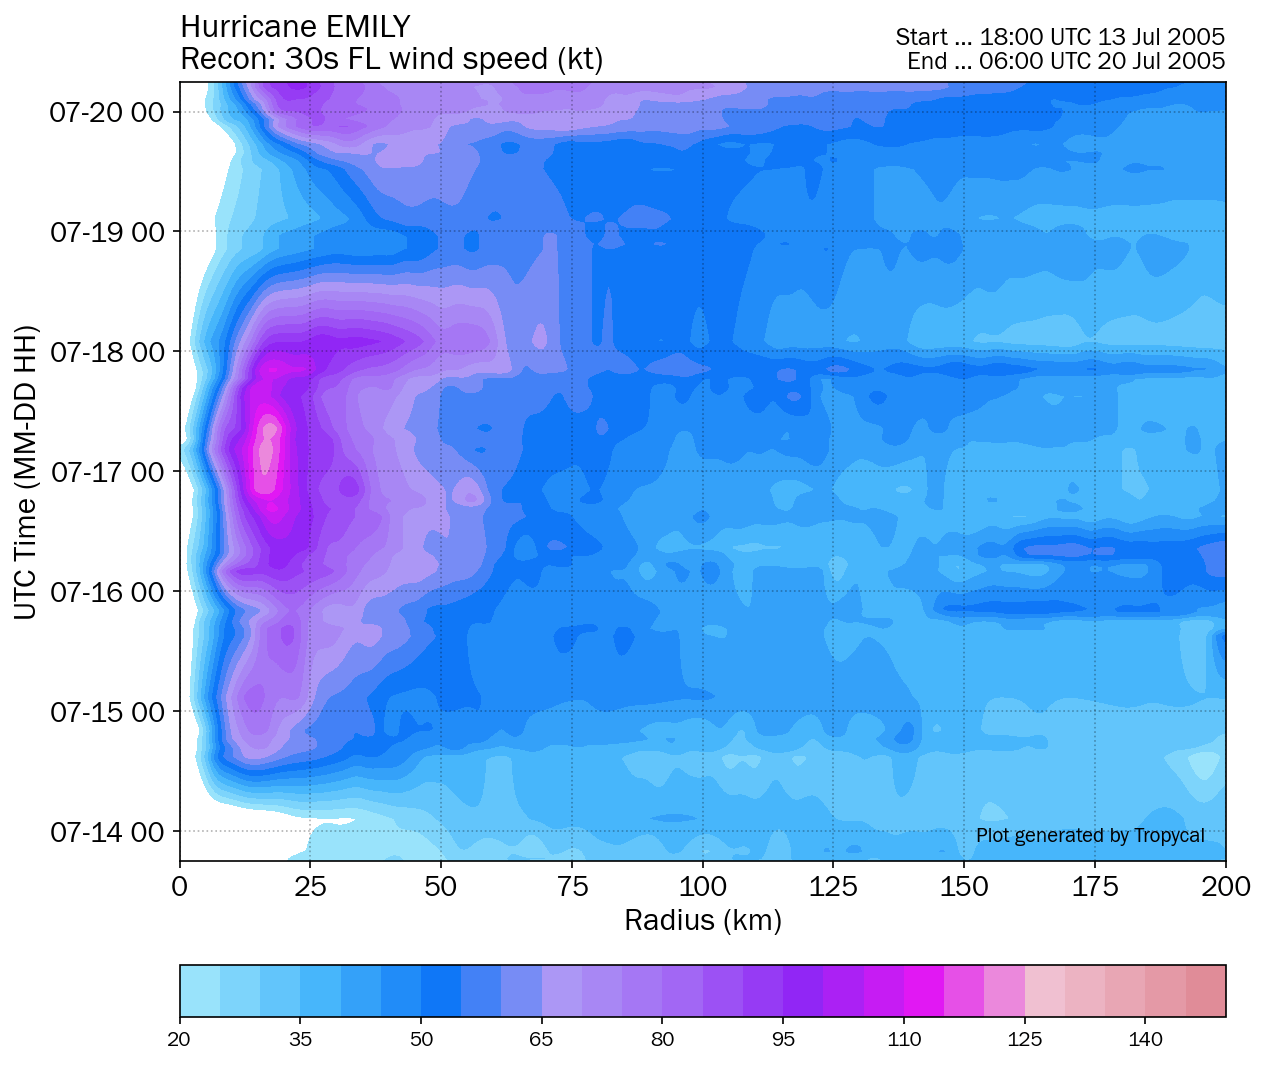
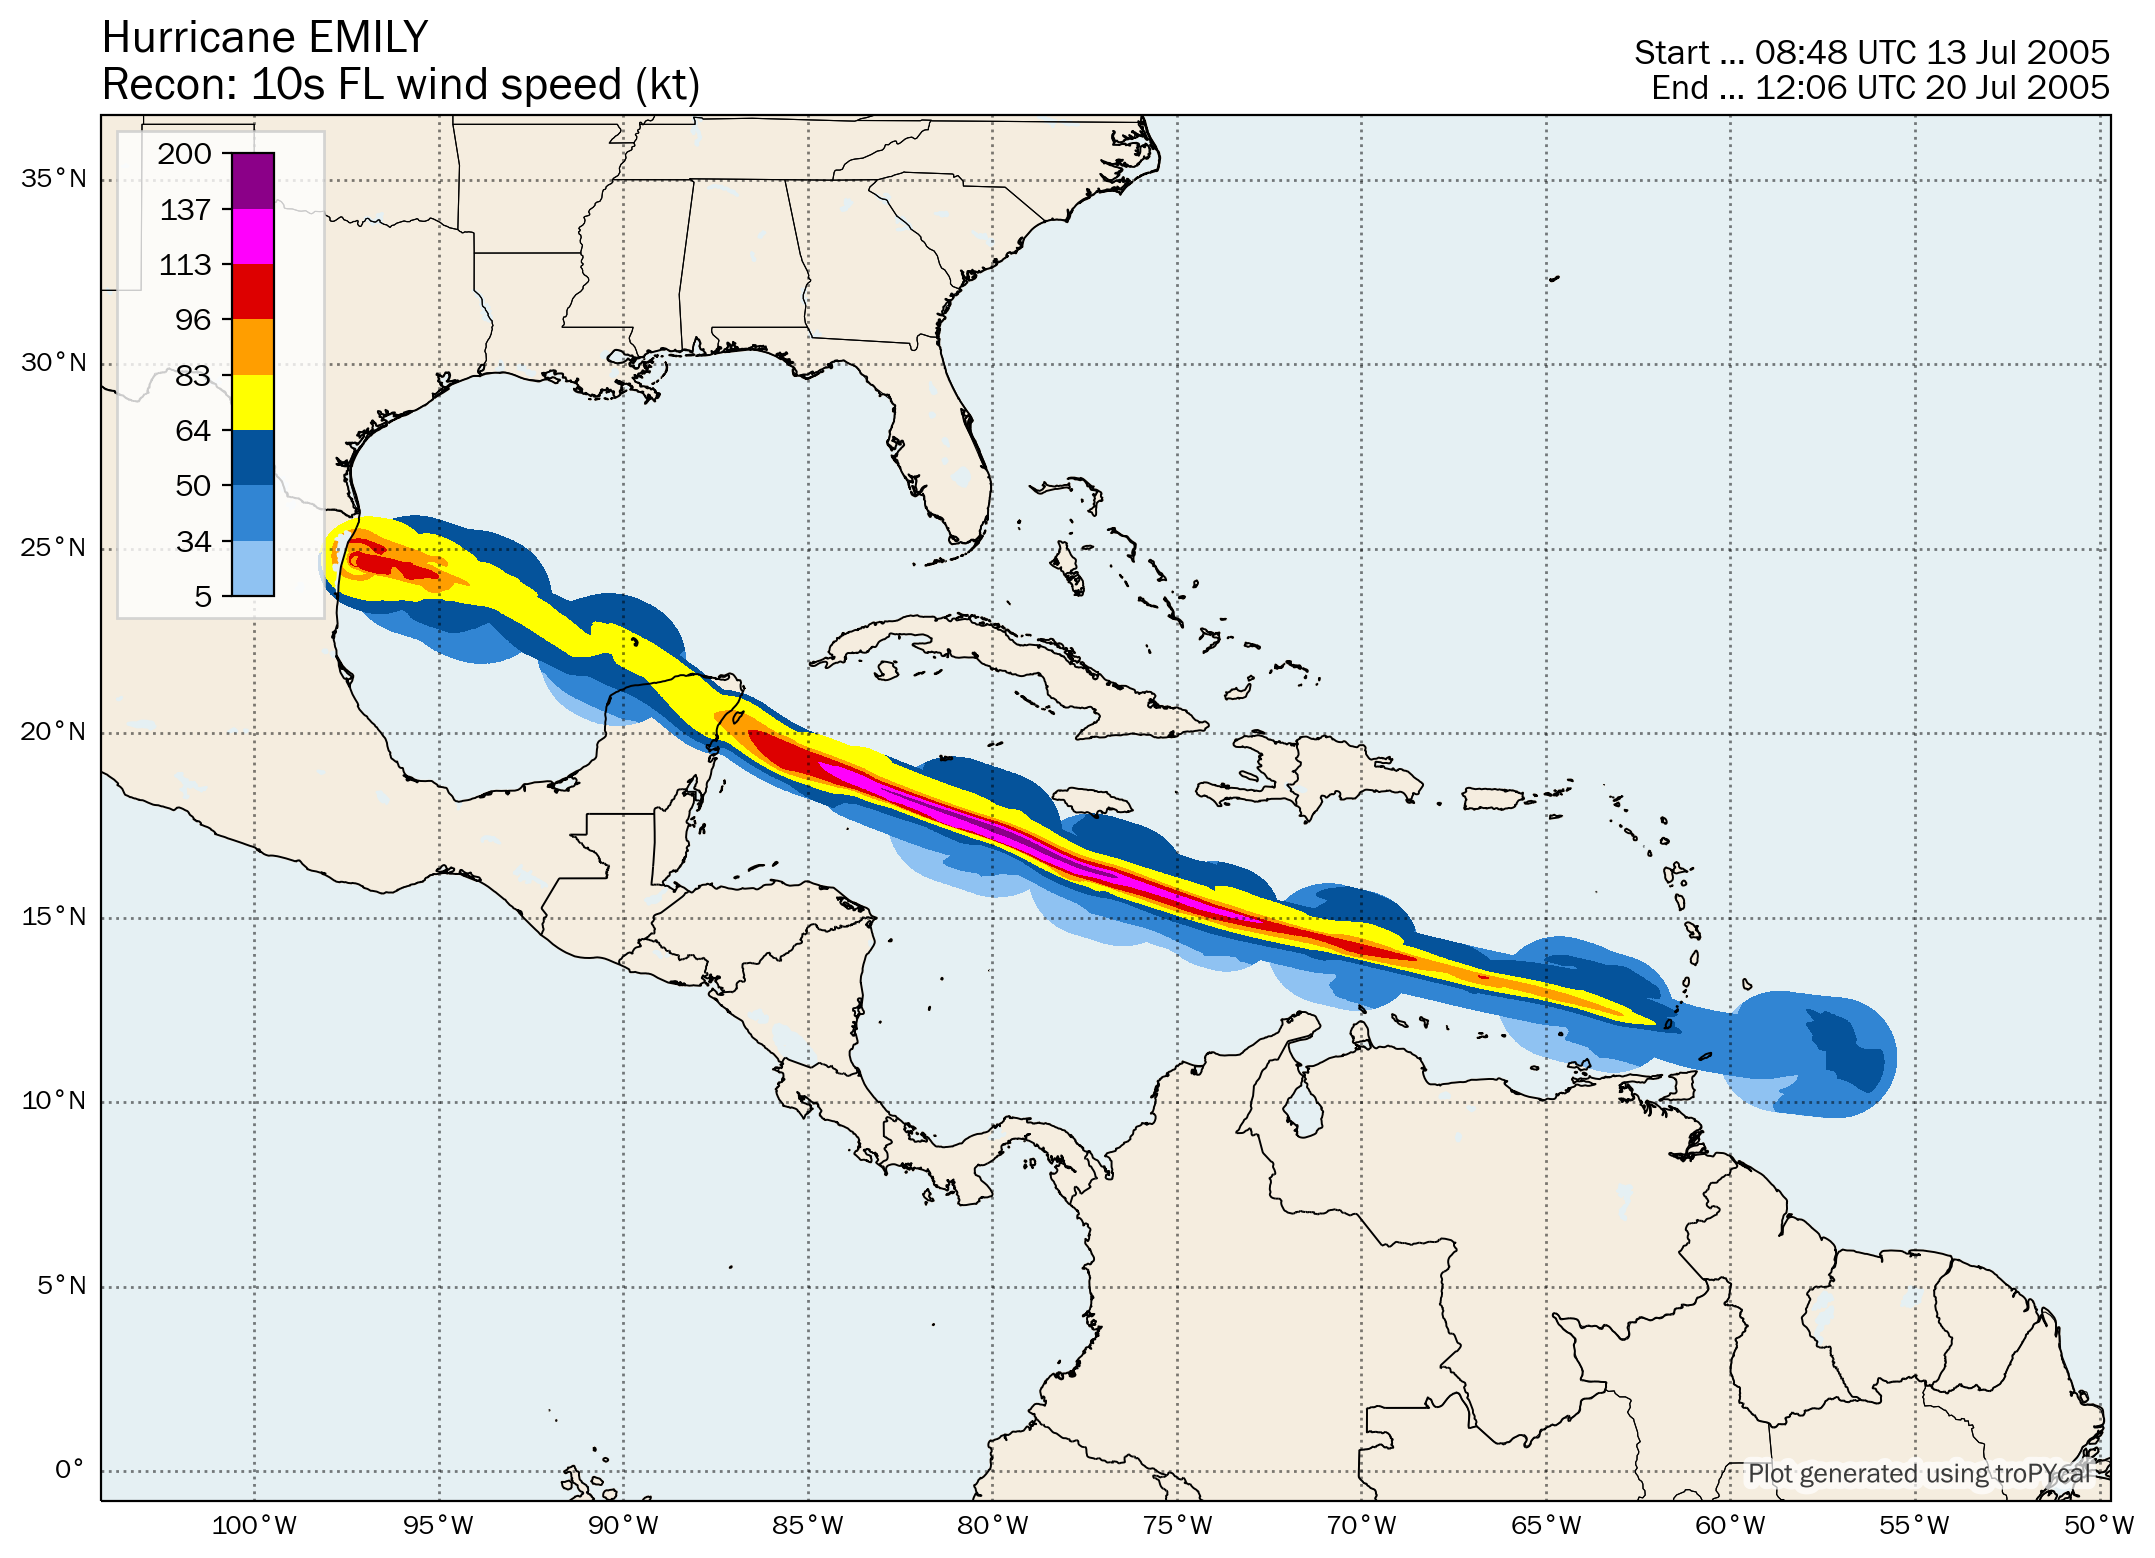
| 5 | Hurricane Emily | 140 kt | 929 hPa | 00z 07/11 | 12z 07/21 | 32.9 |
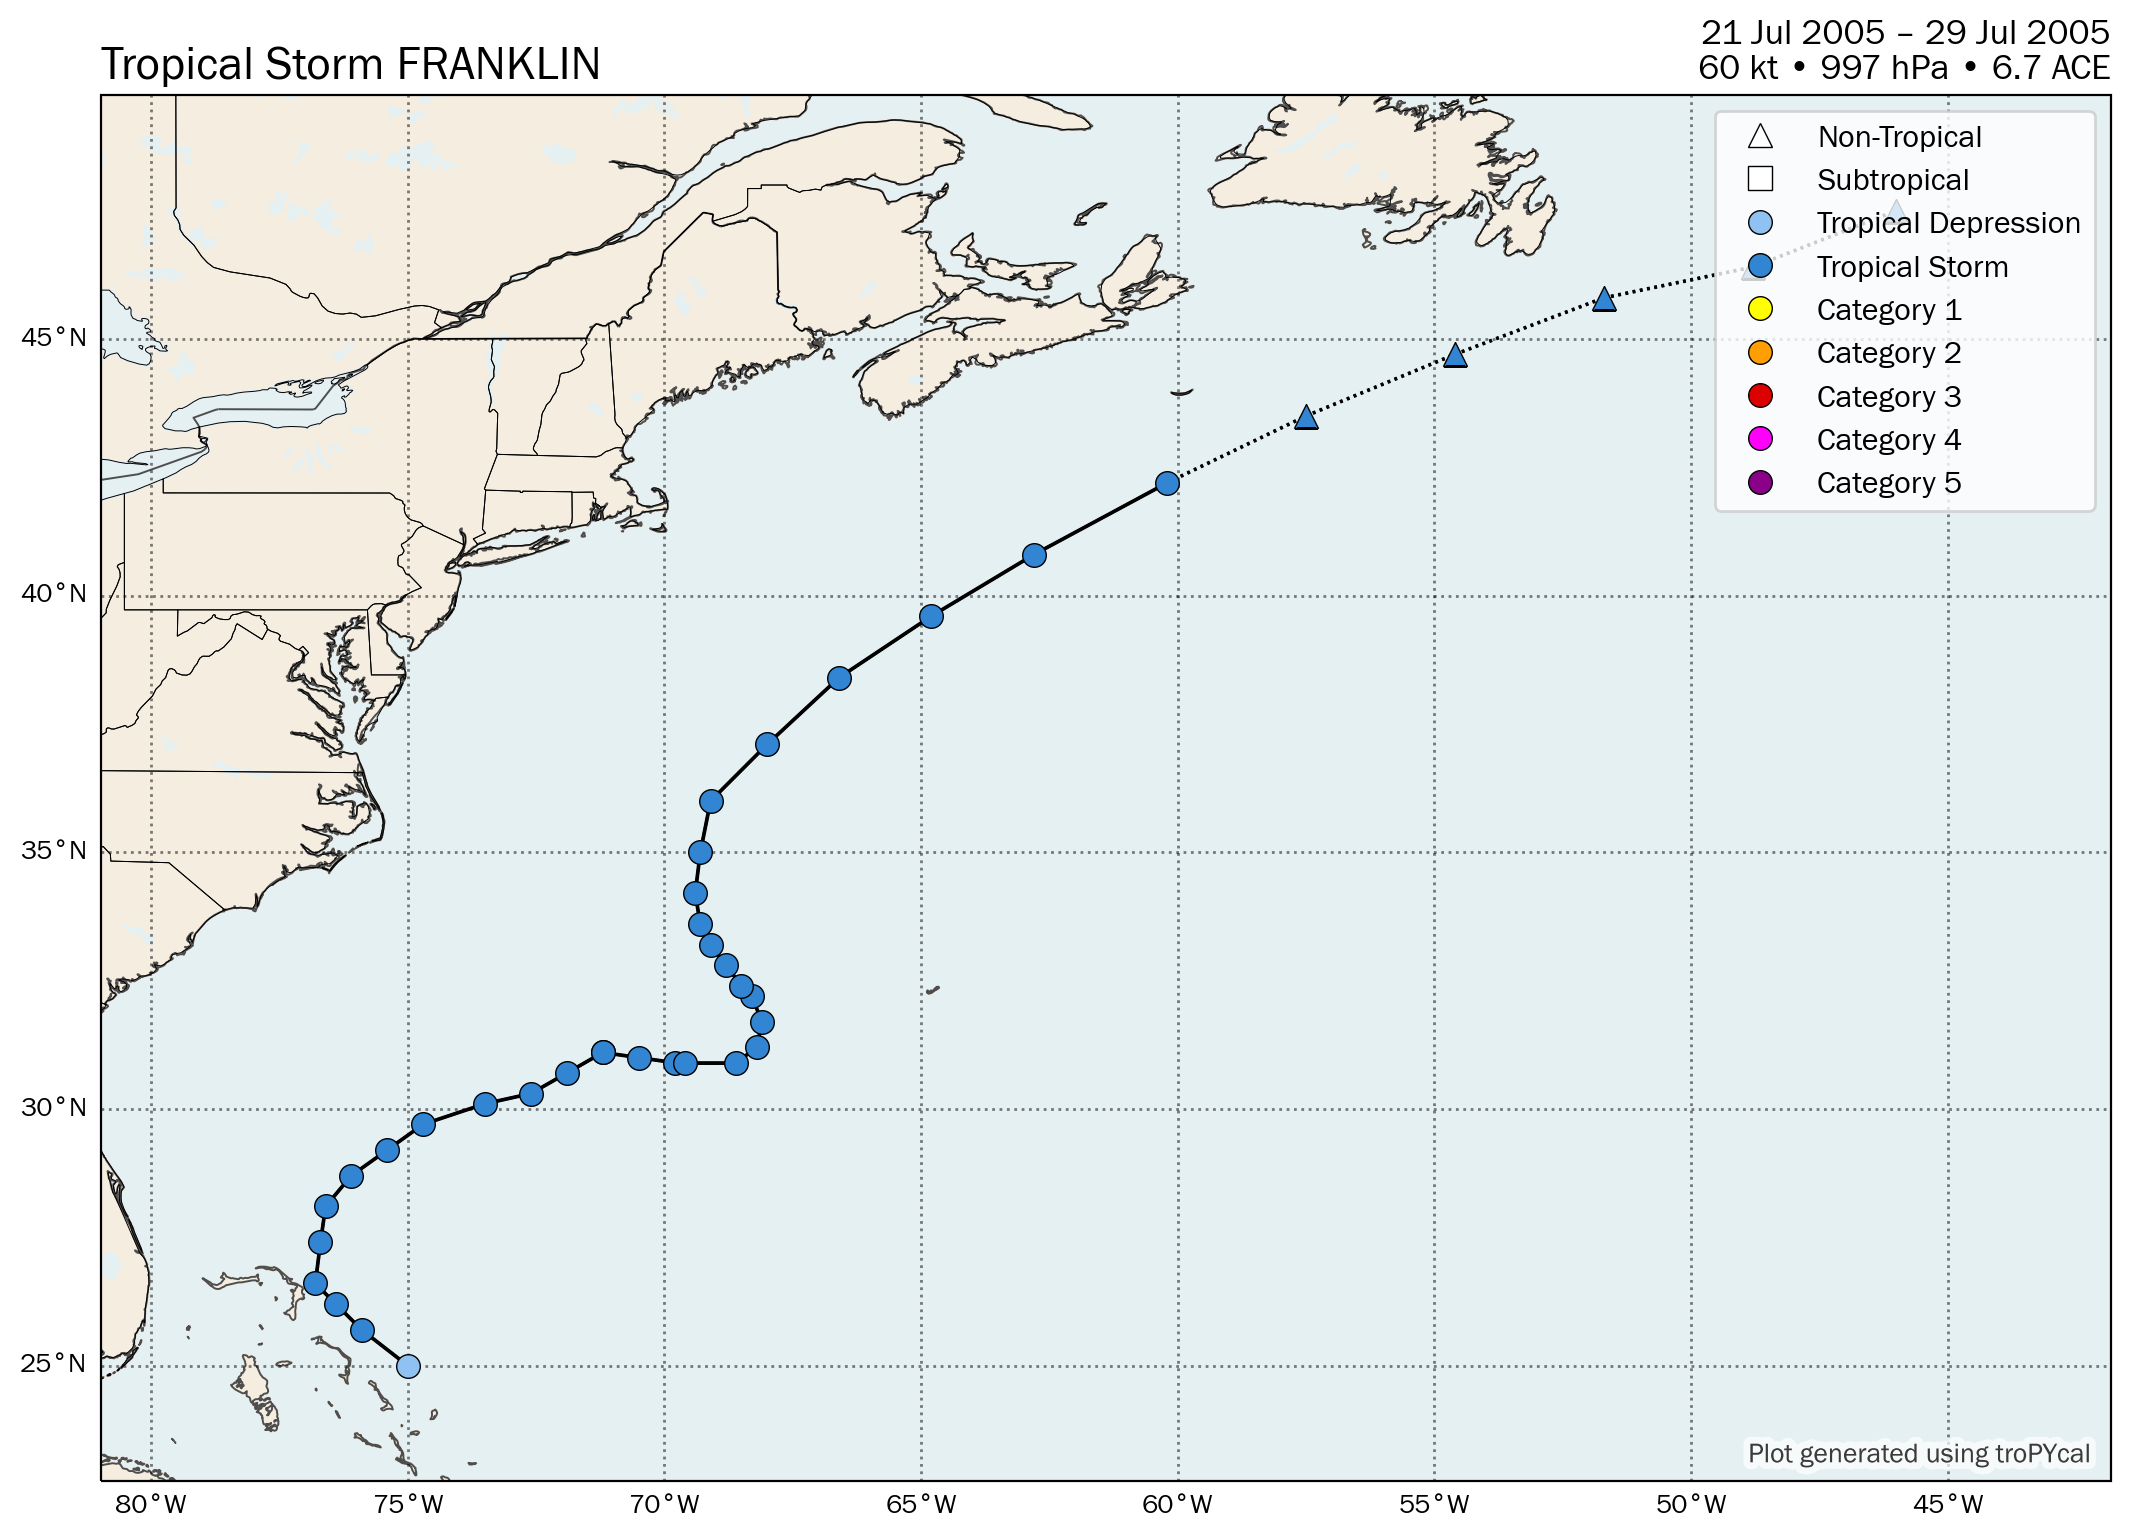
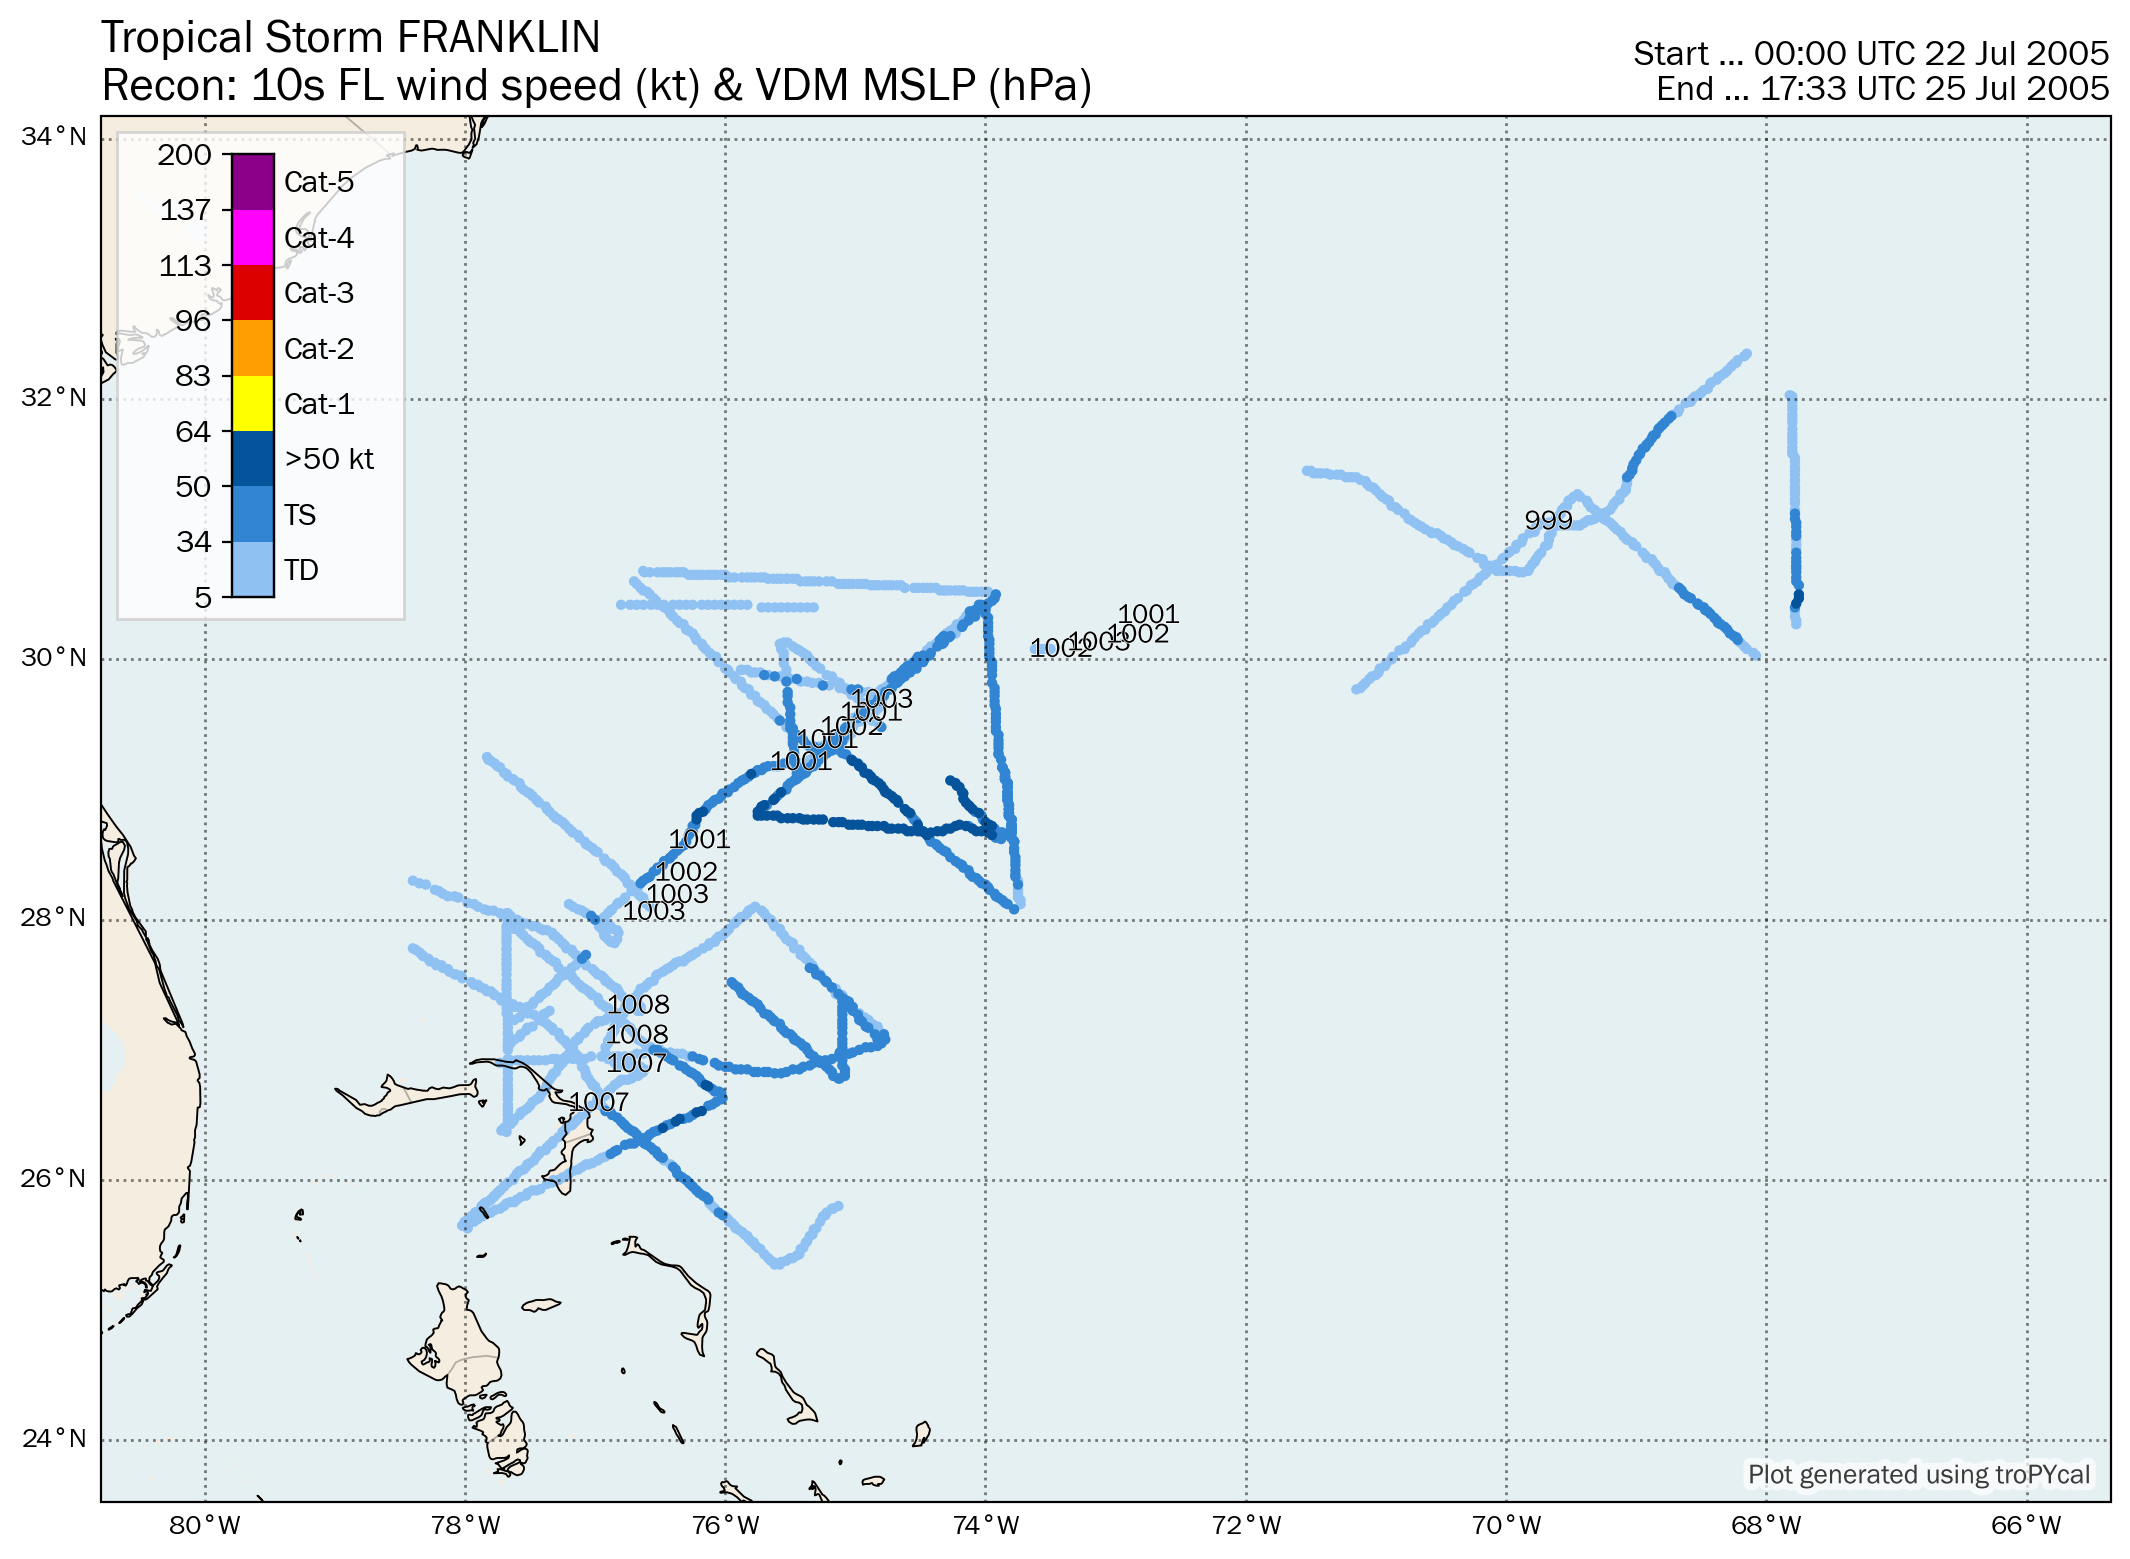
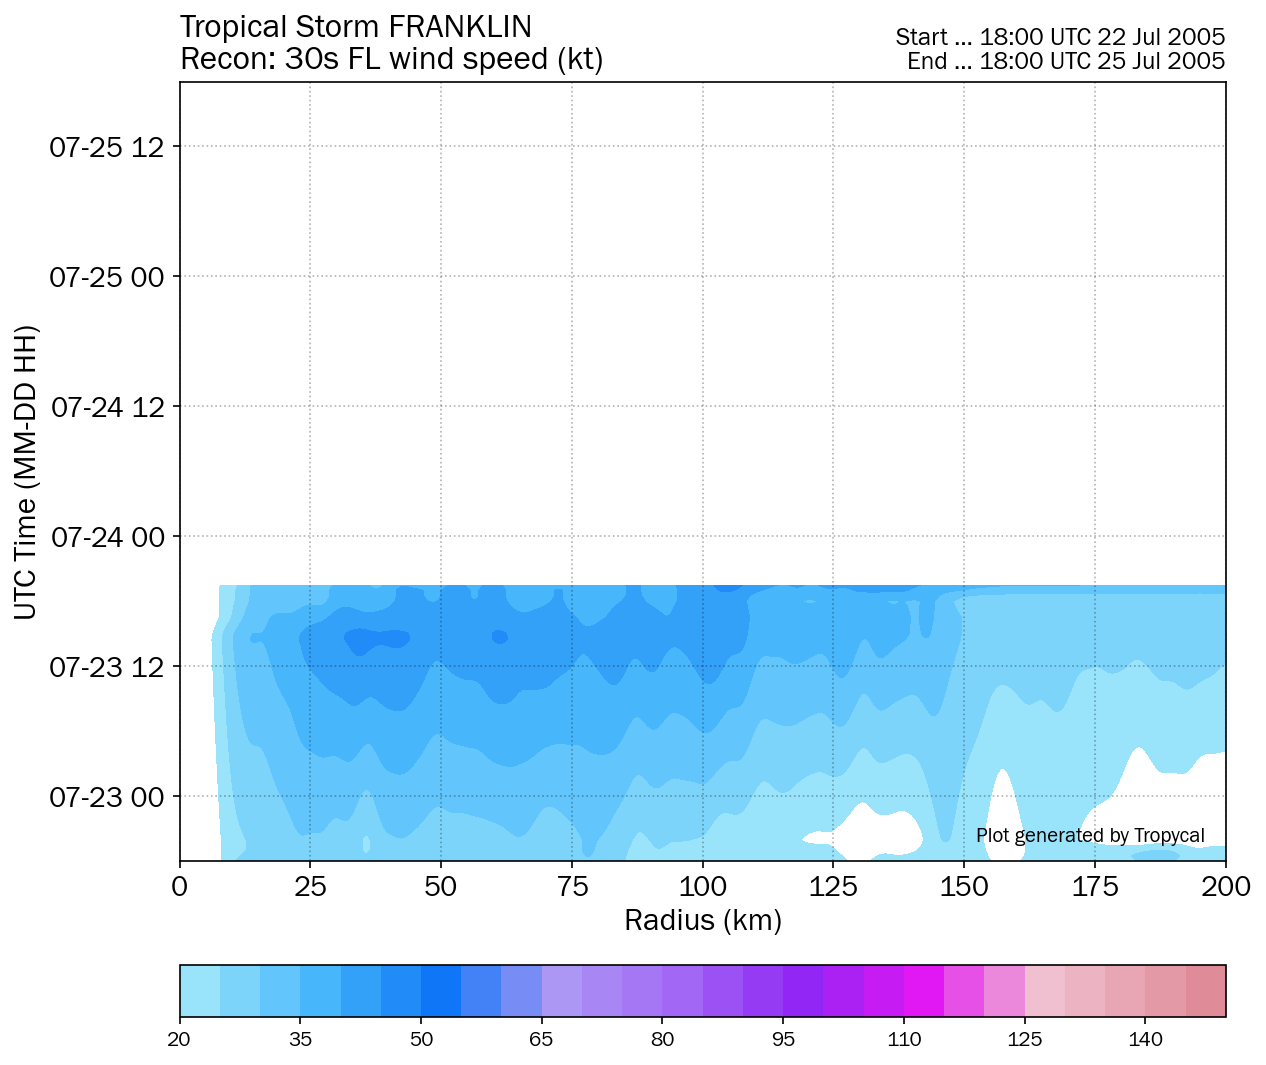
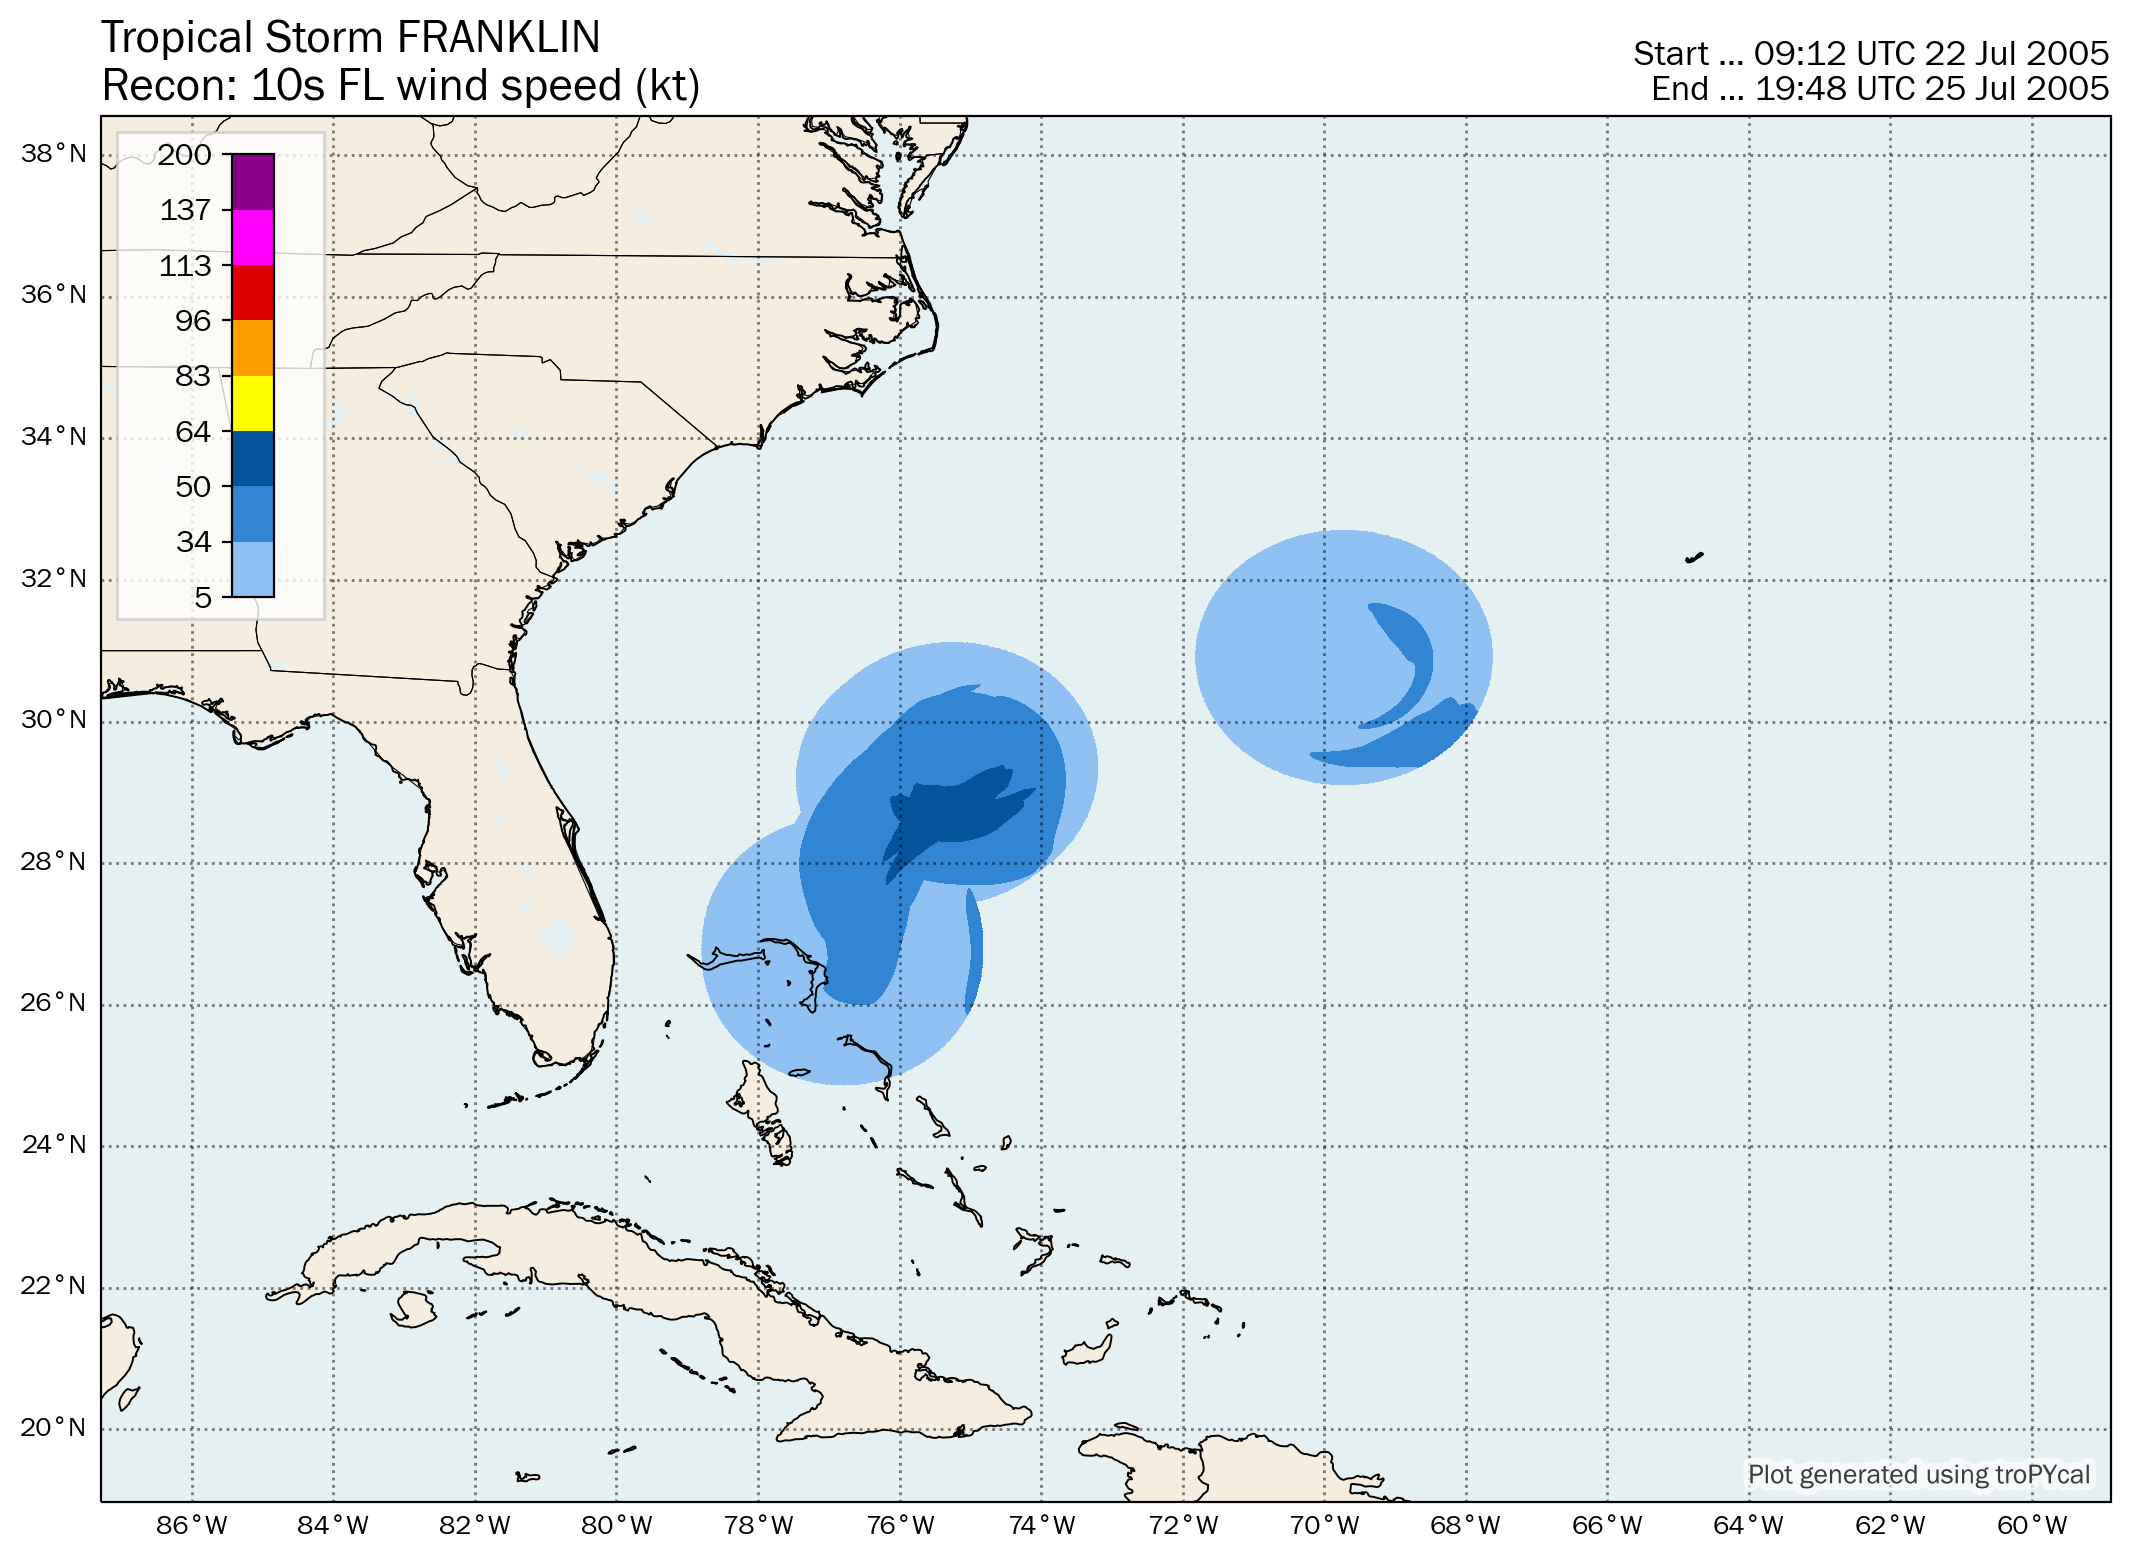
| S | Tropical Storm Franklin | 60 kt | 997 hPa | 18z 07/21 | 18z 07/29 | 6.7 |
| S | Tropical Storm Gert | 40 kt | 1005 hPa | 18z 07/23 | 12z 07/25 | 0.5 |
| S | Tropical Storm Harvey | 55 kt | 994 hPa | 18z 08/02 | 18z 08/08 | 5.4 |
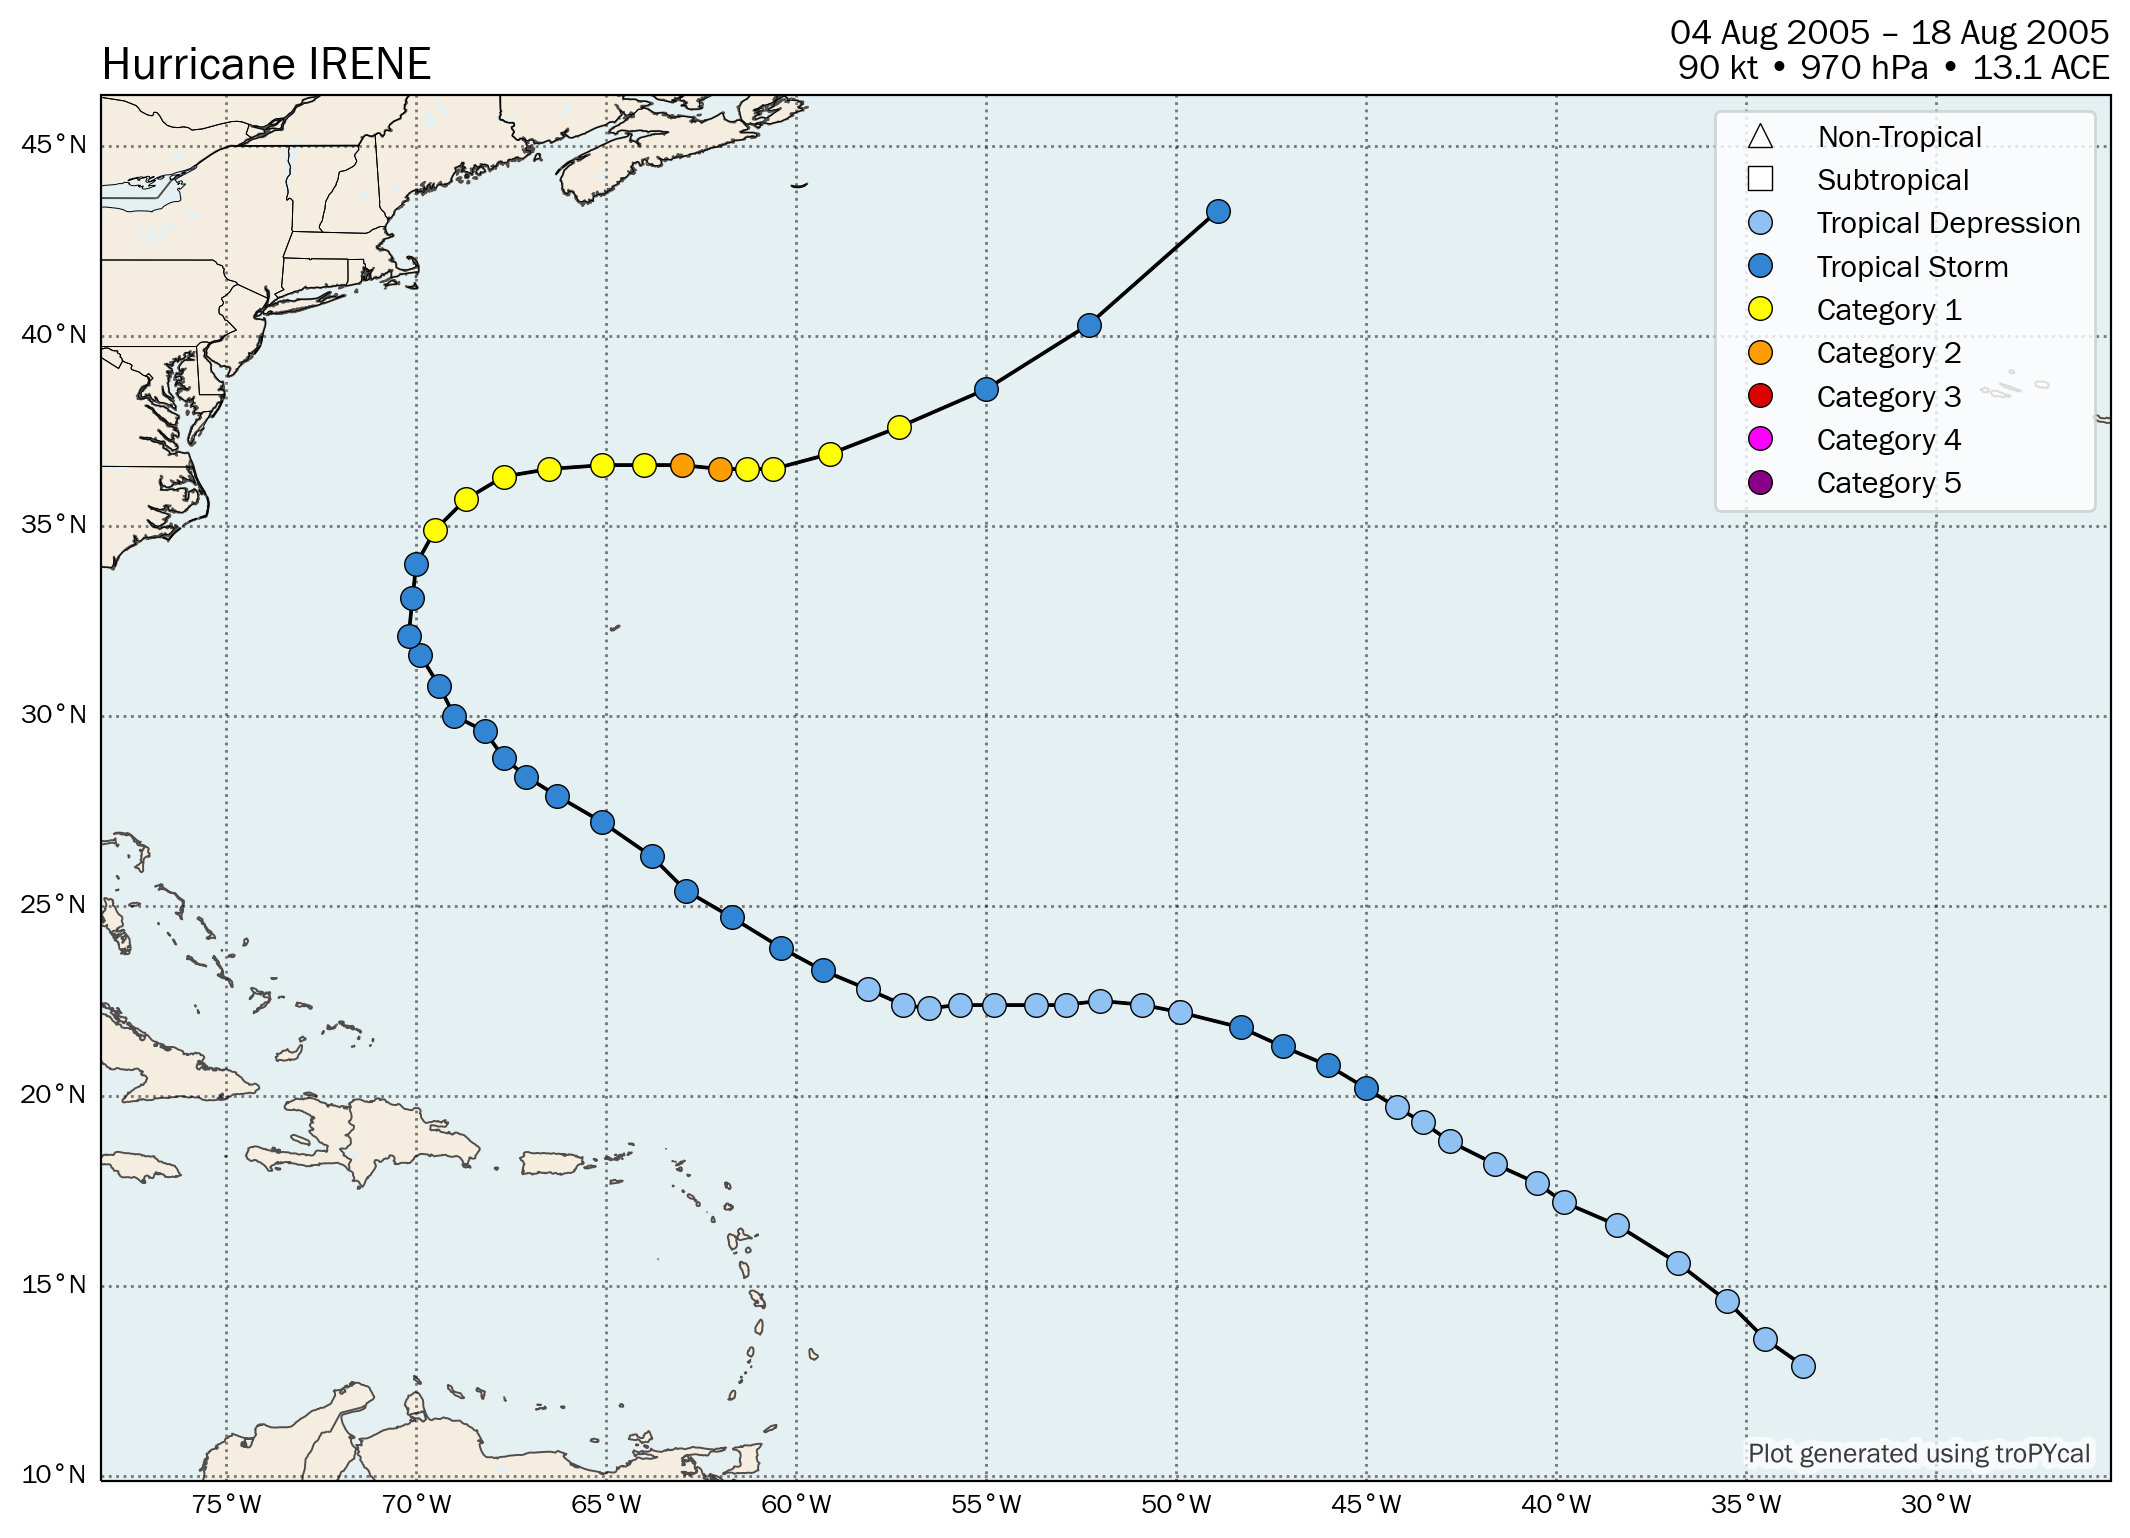
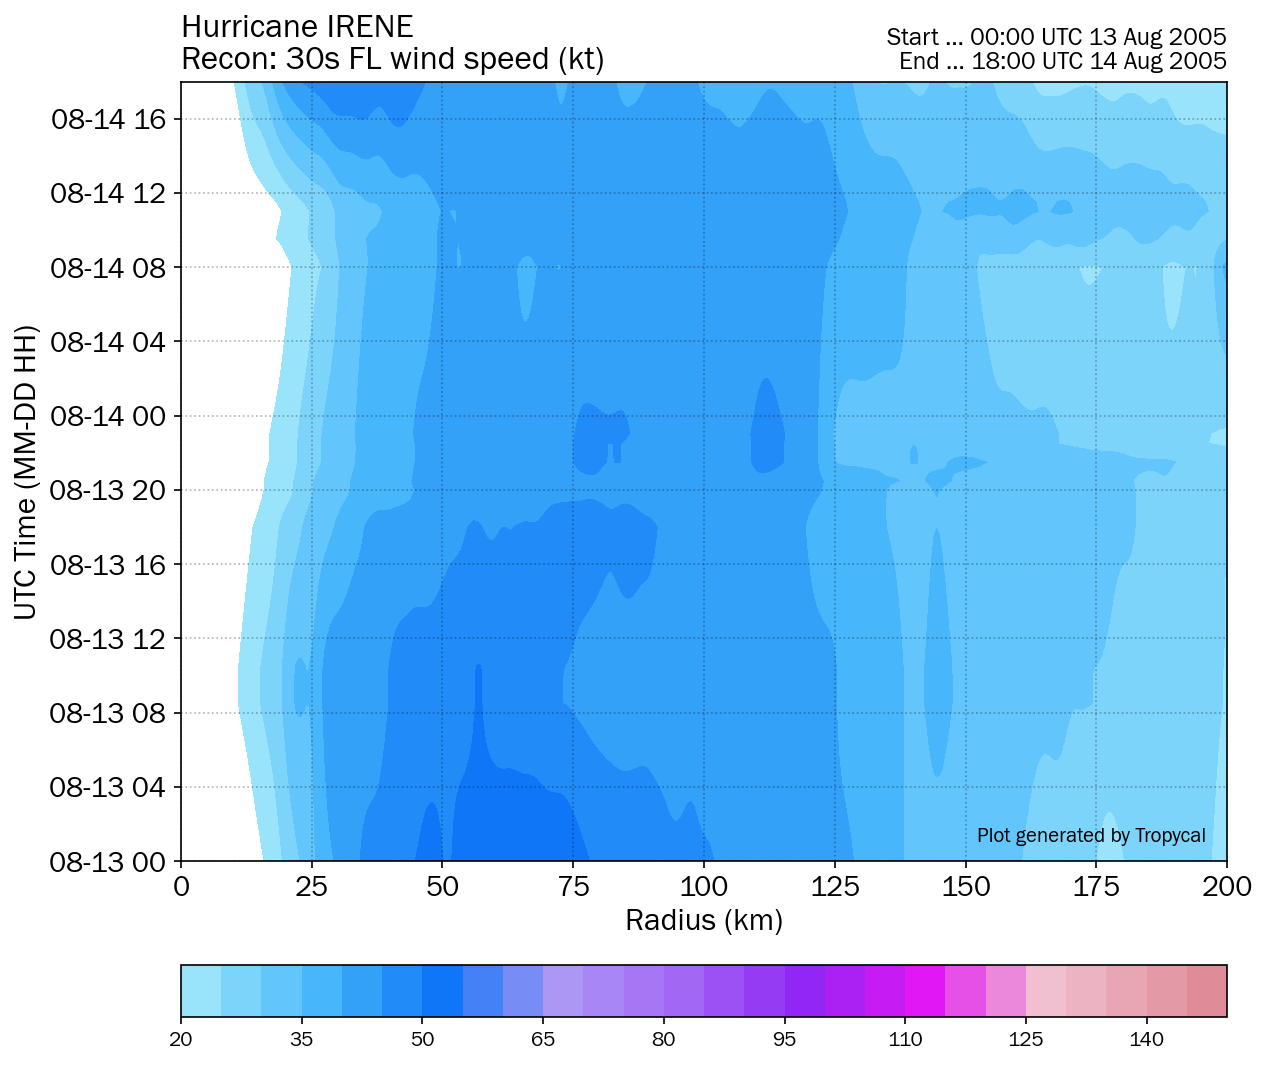
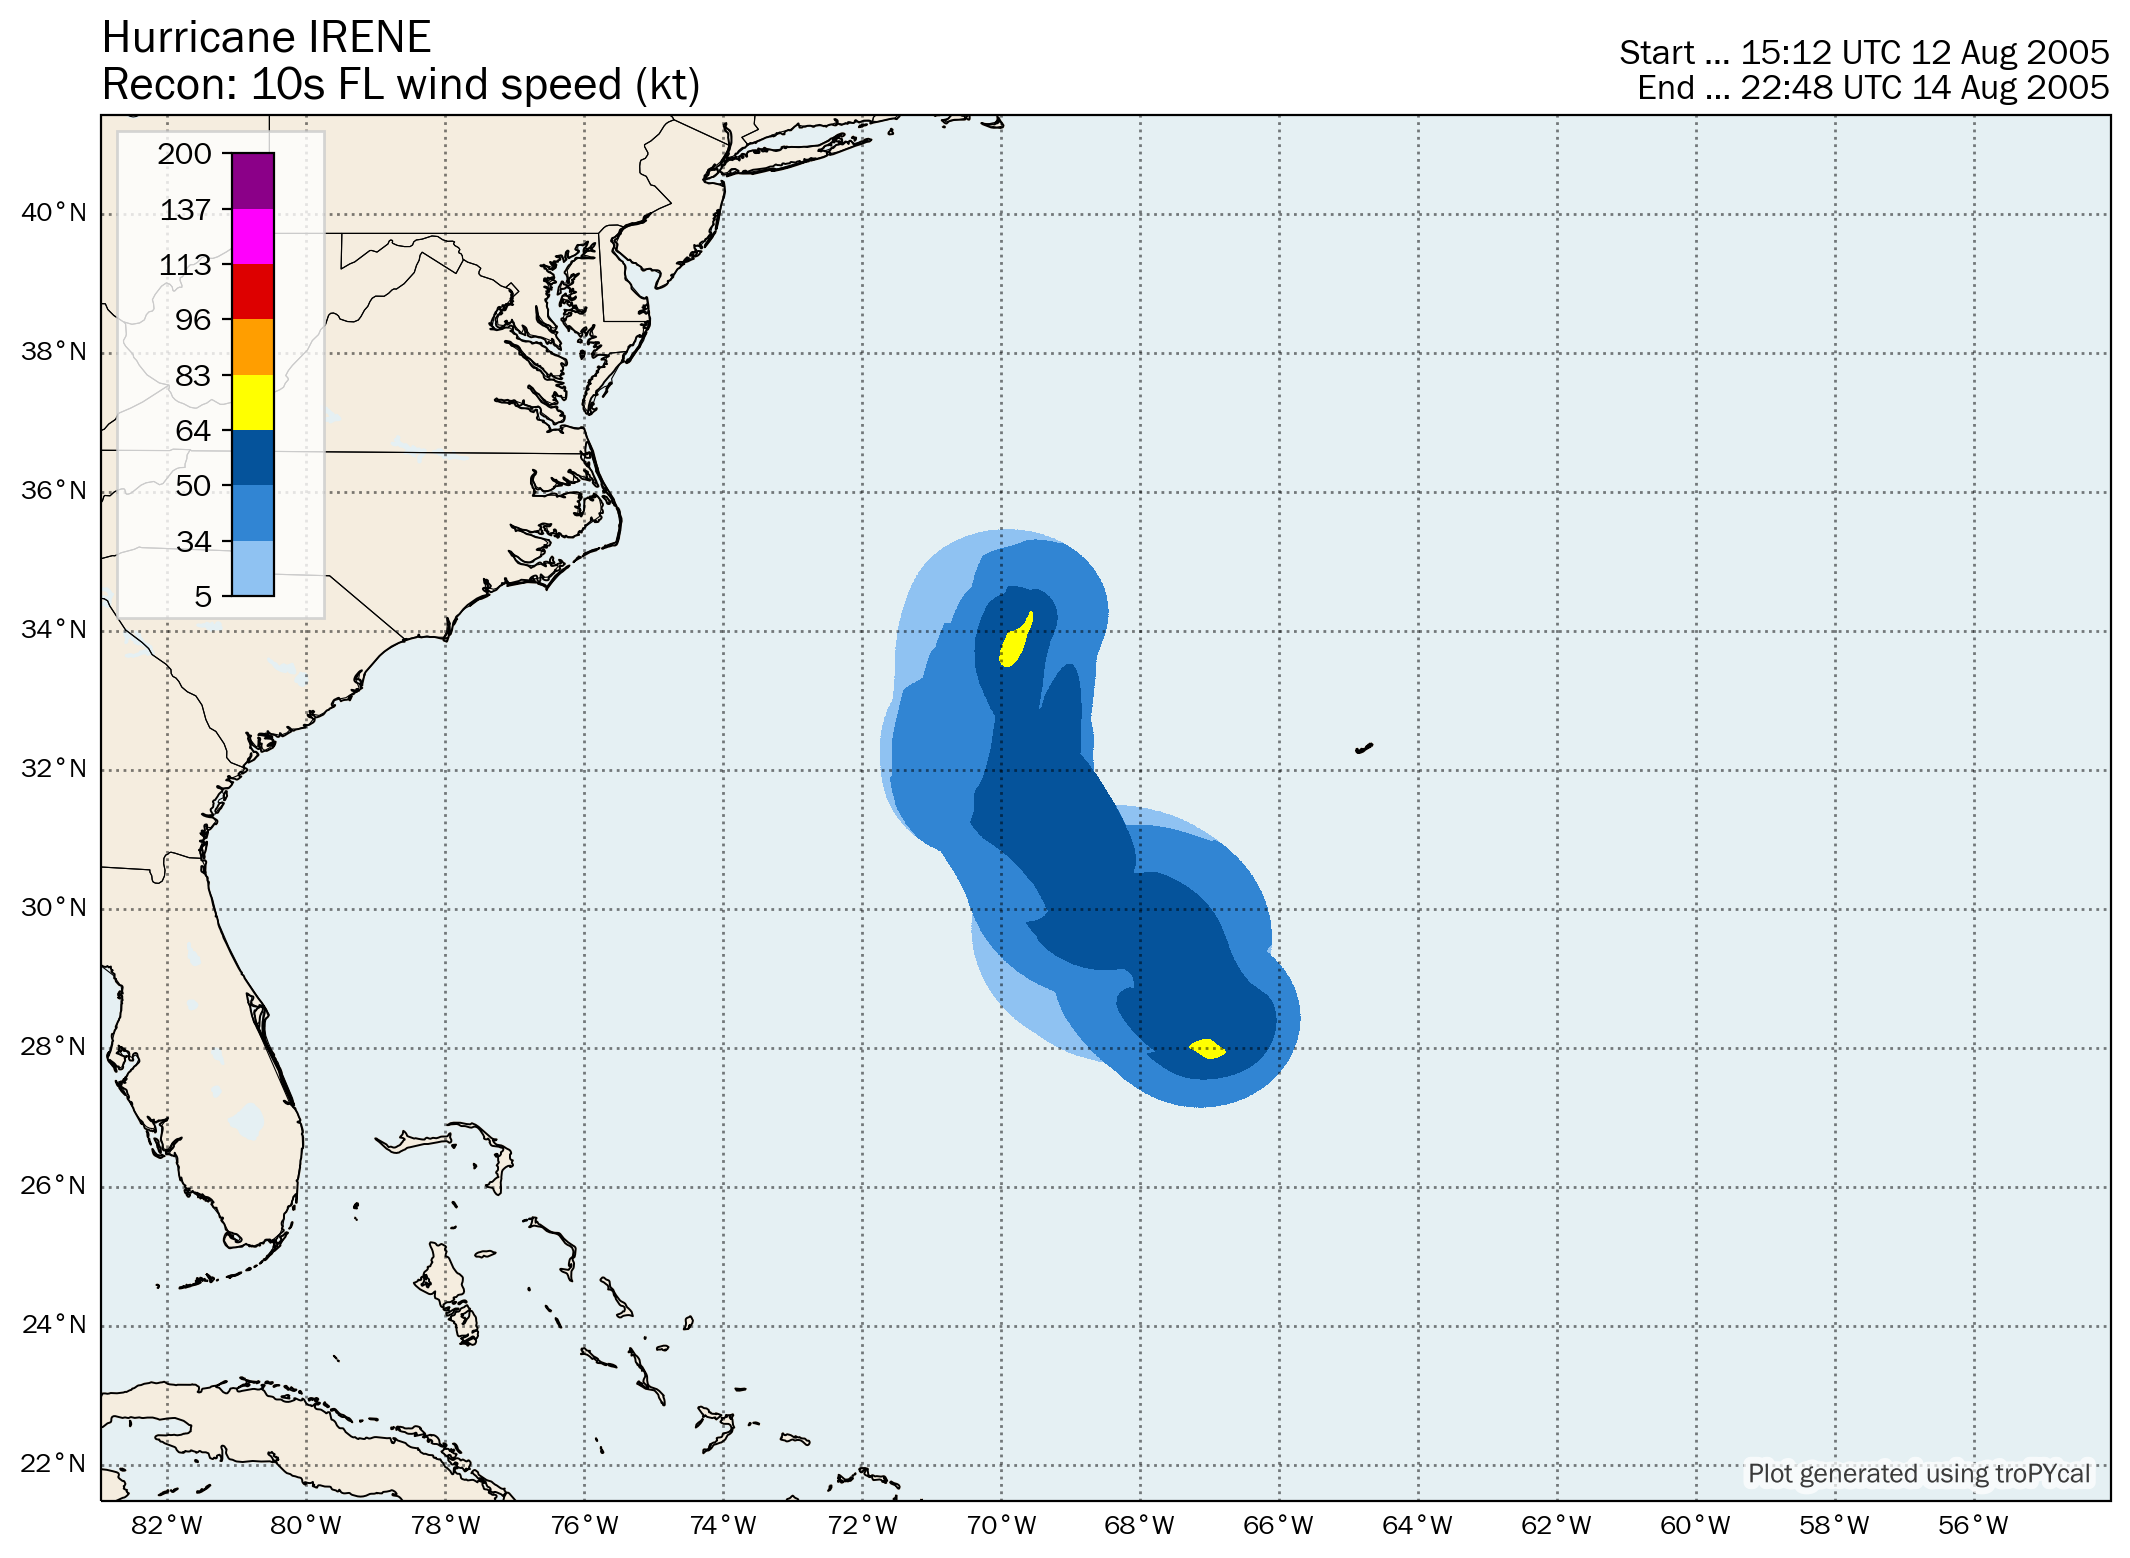
| 2 | Hurricane Irene | 90 kt | 970 hPa | 18z 08/04 | 12z 08/18 | 13.1 |
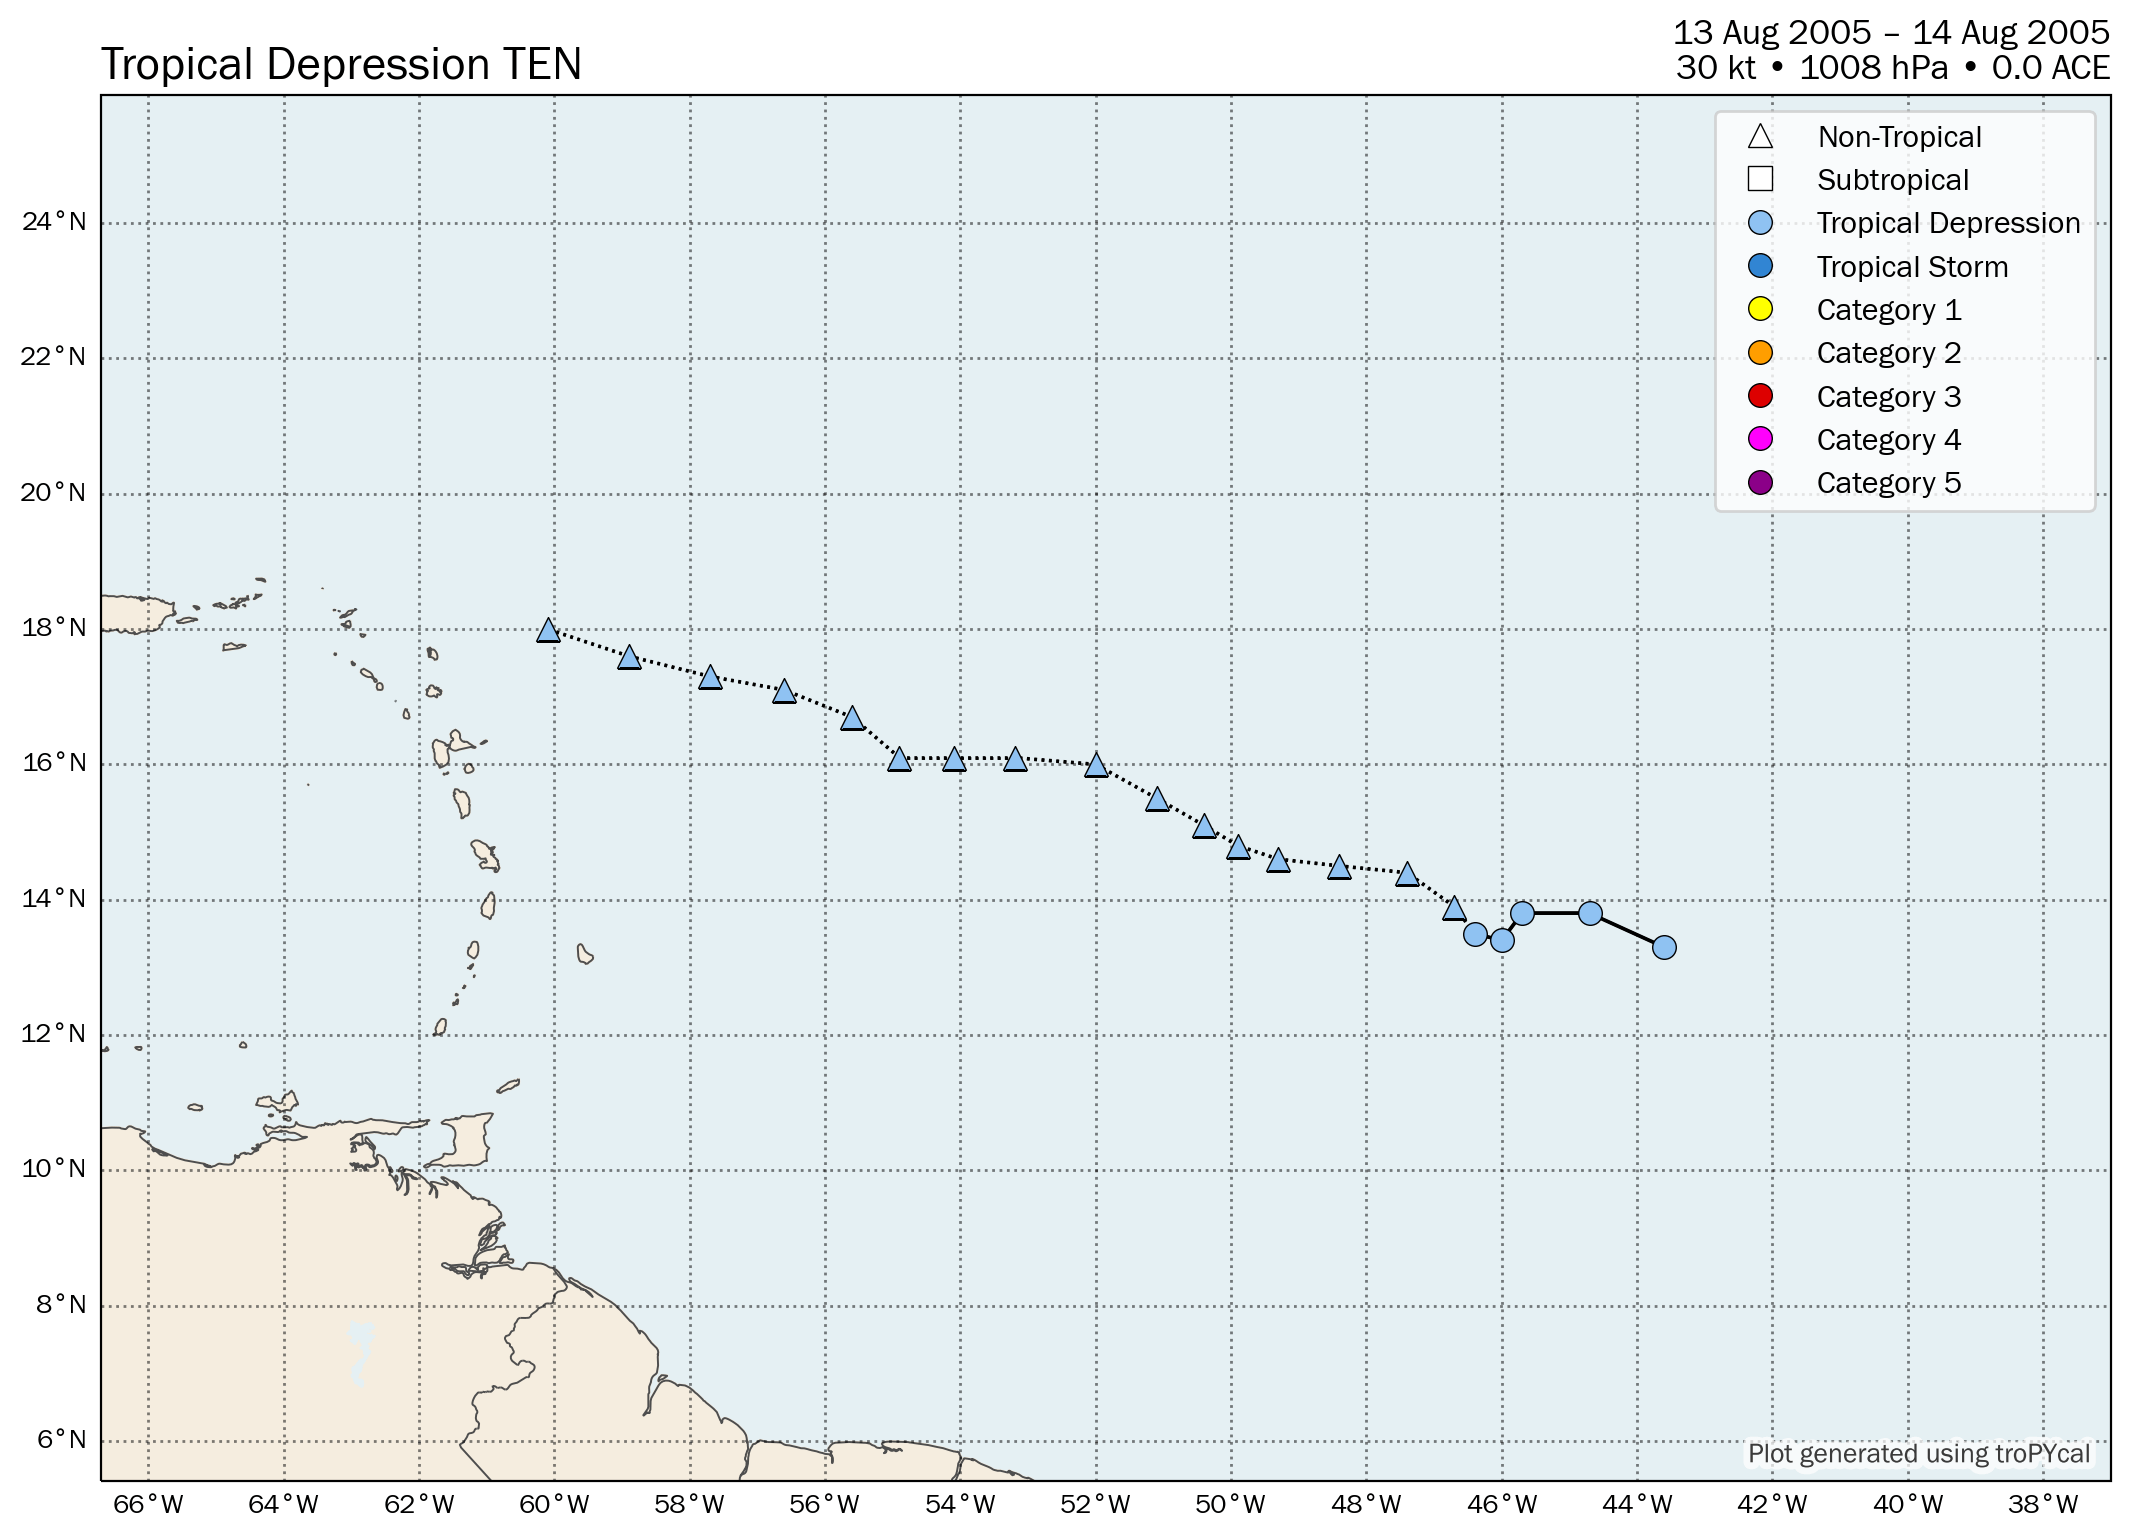
| D | Tropical Depression Ten | 30 kt | 1008 hPa | 12z 08/13 | 12z 08/14 | 0.0 |
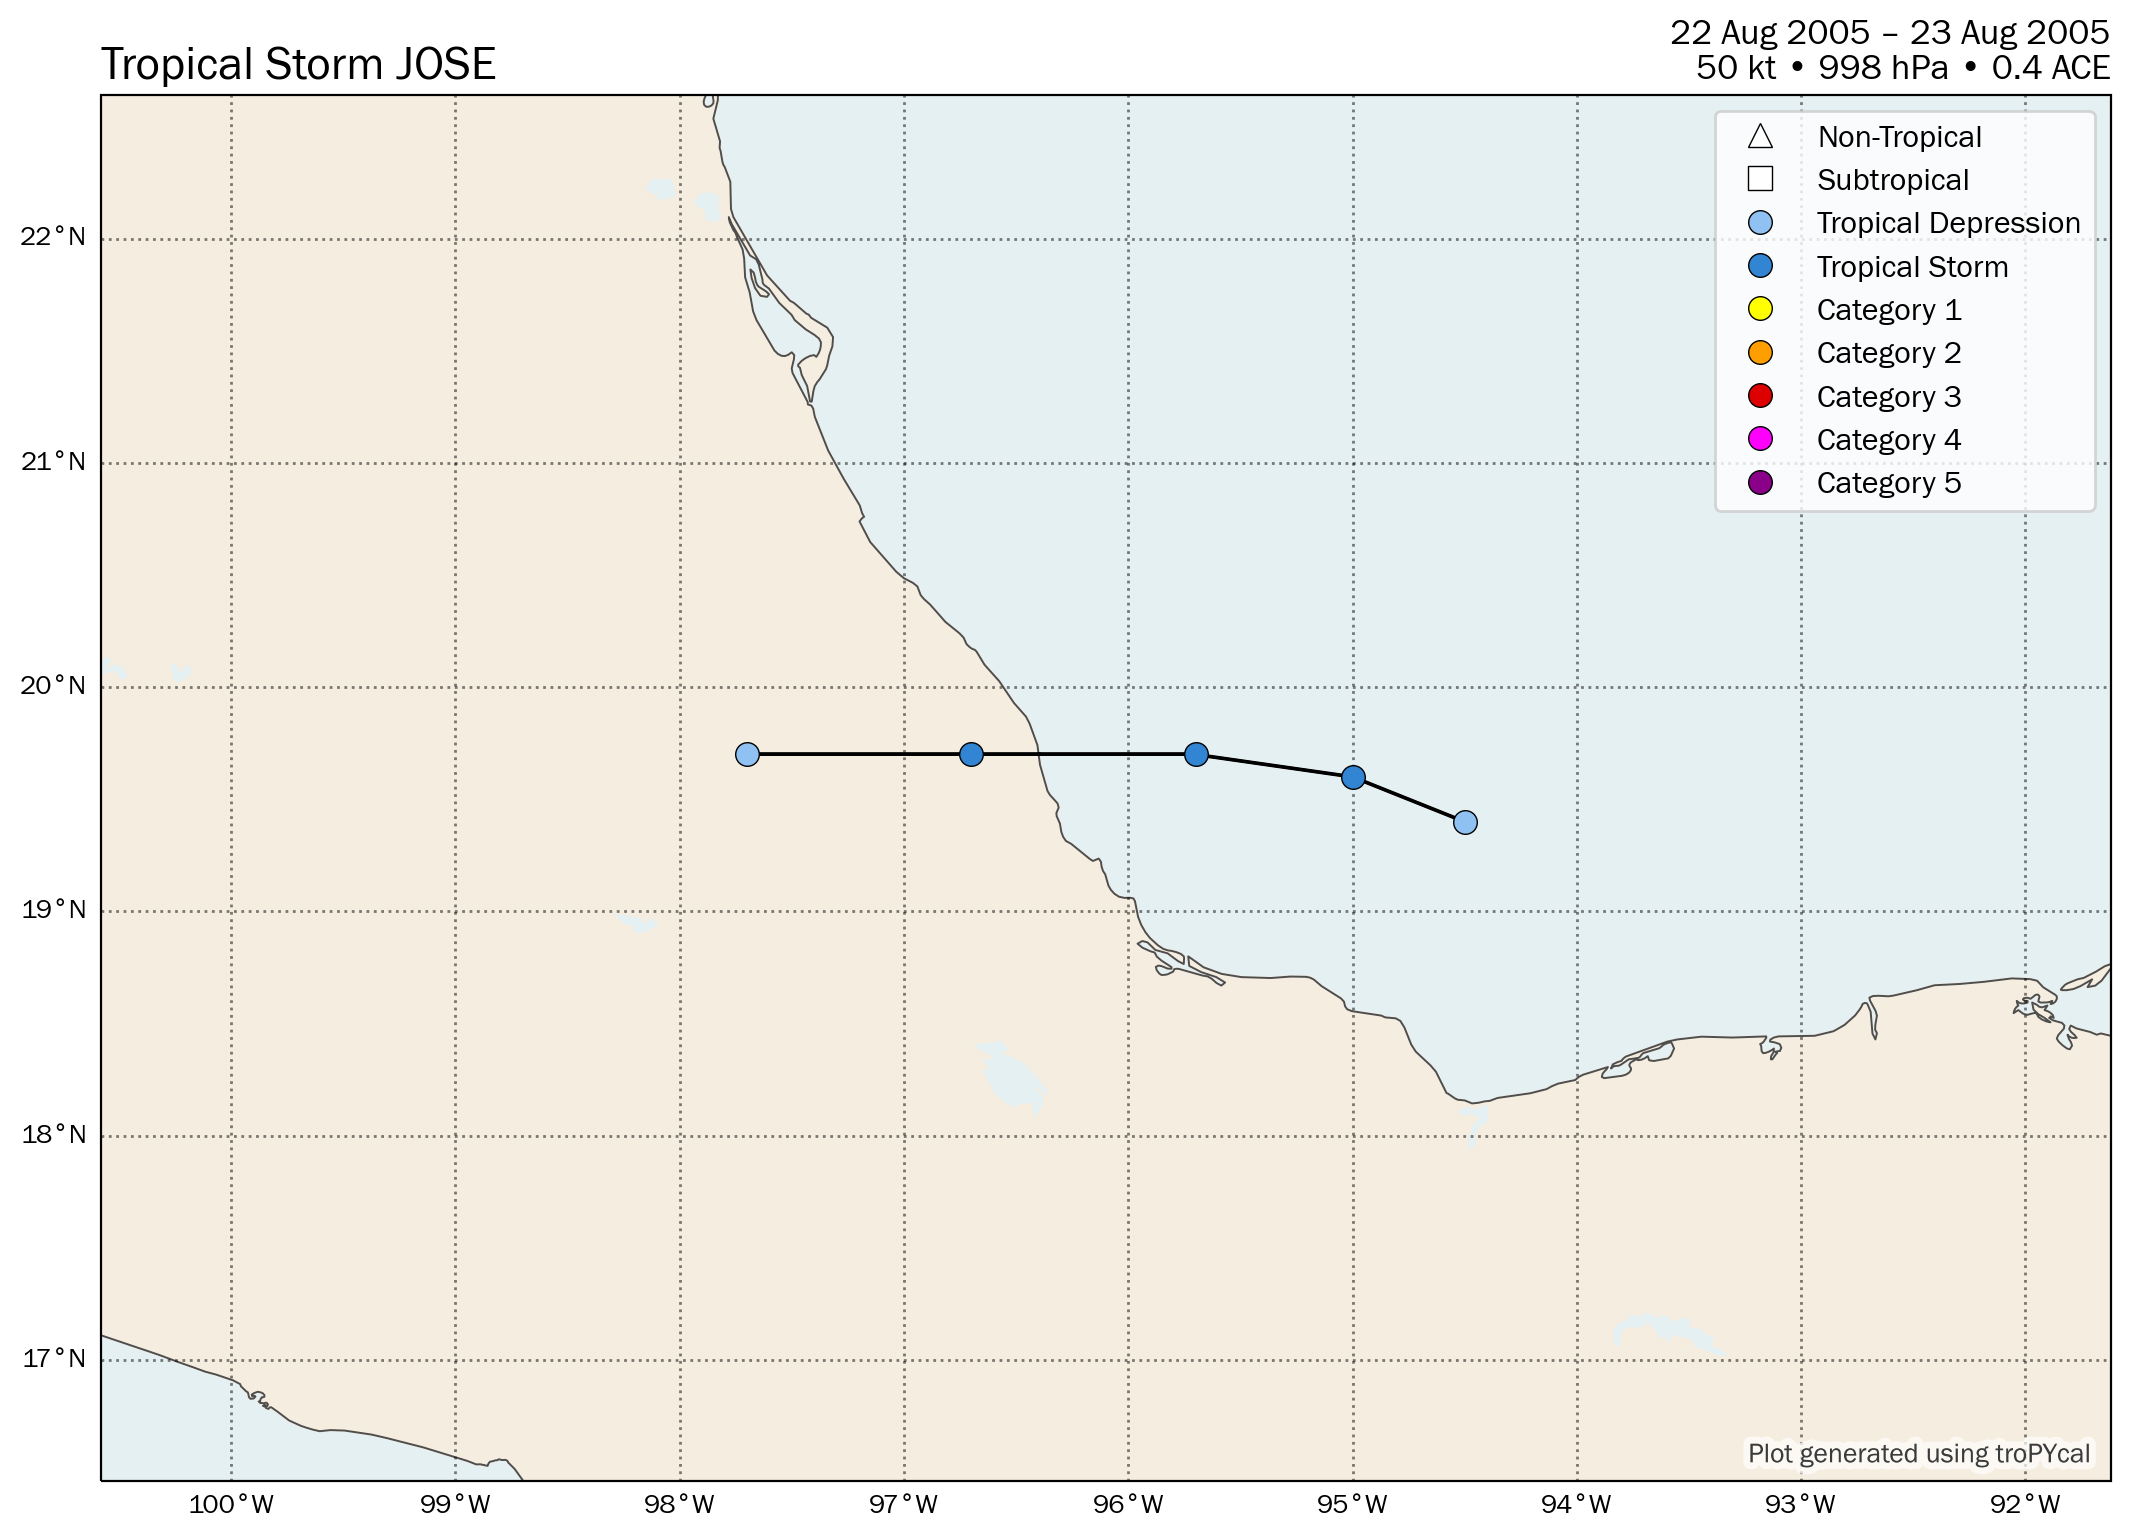
| S | Tropical Storm Jose | 50 kt | 998 hPa | 12z 08/22 | 12z 08/23 | 0.4 |
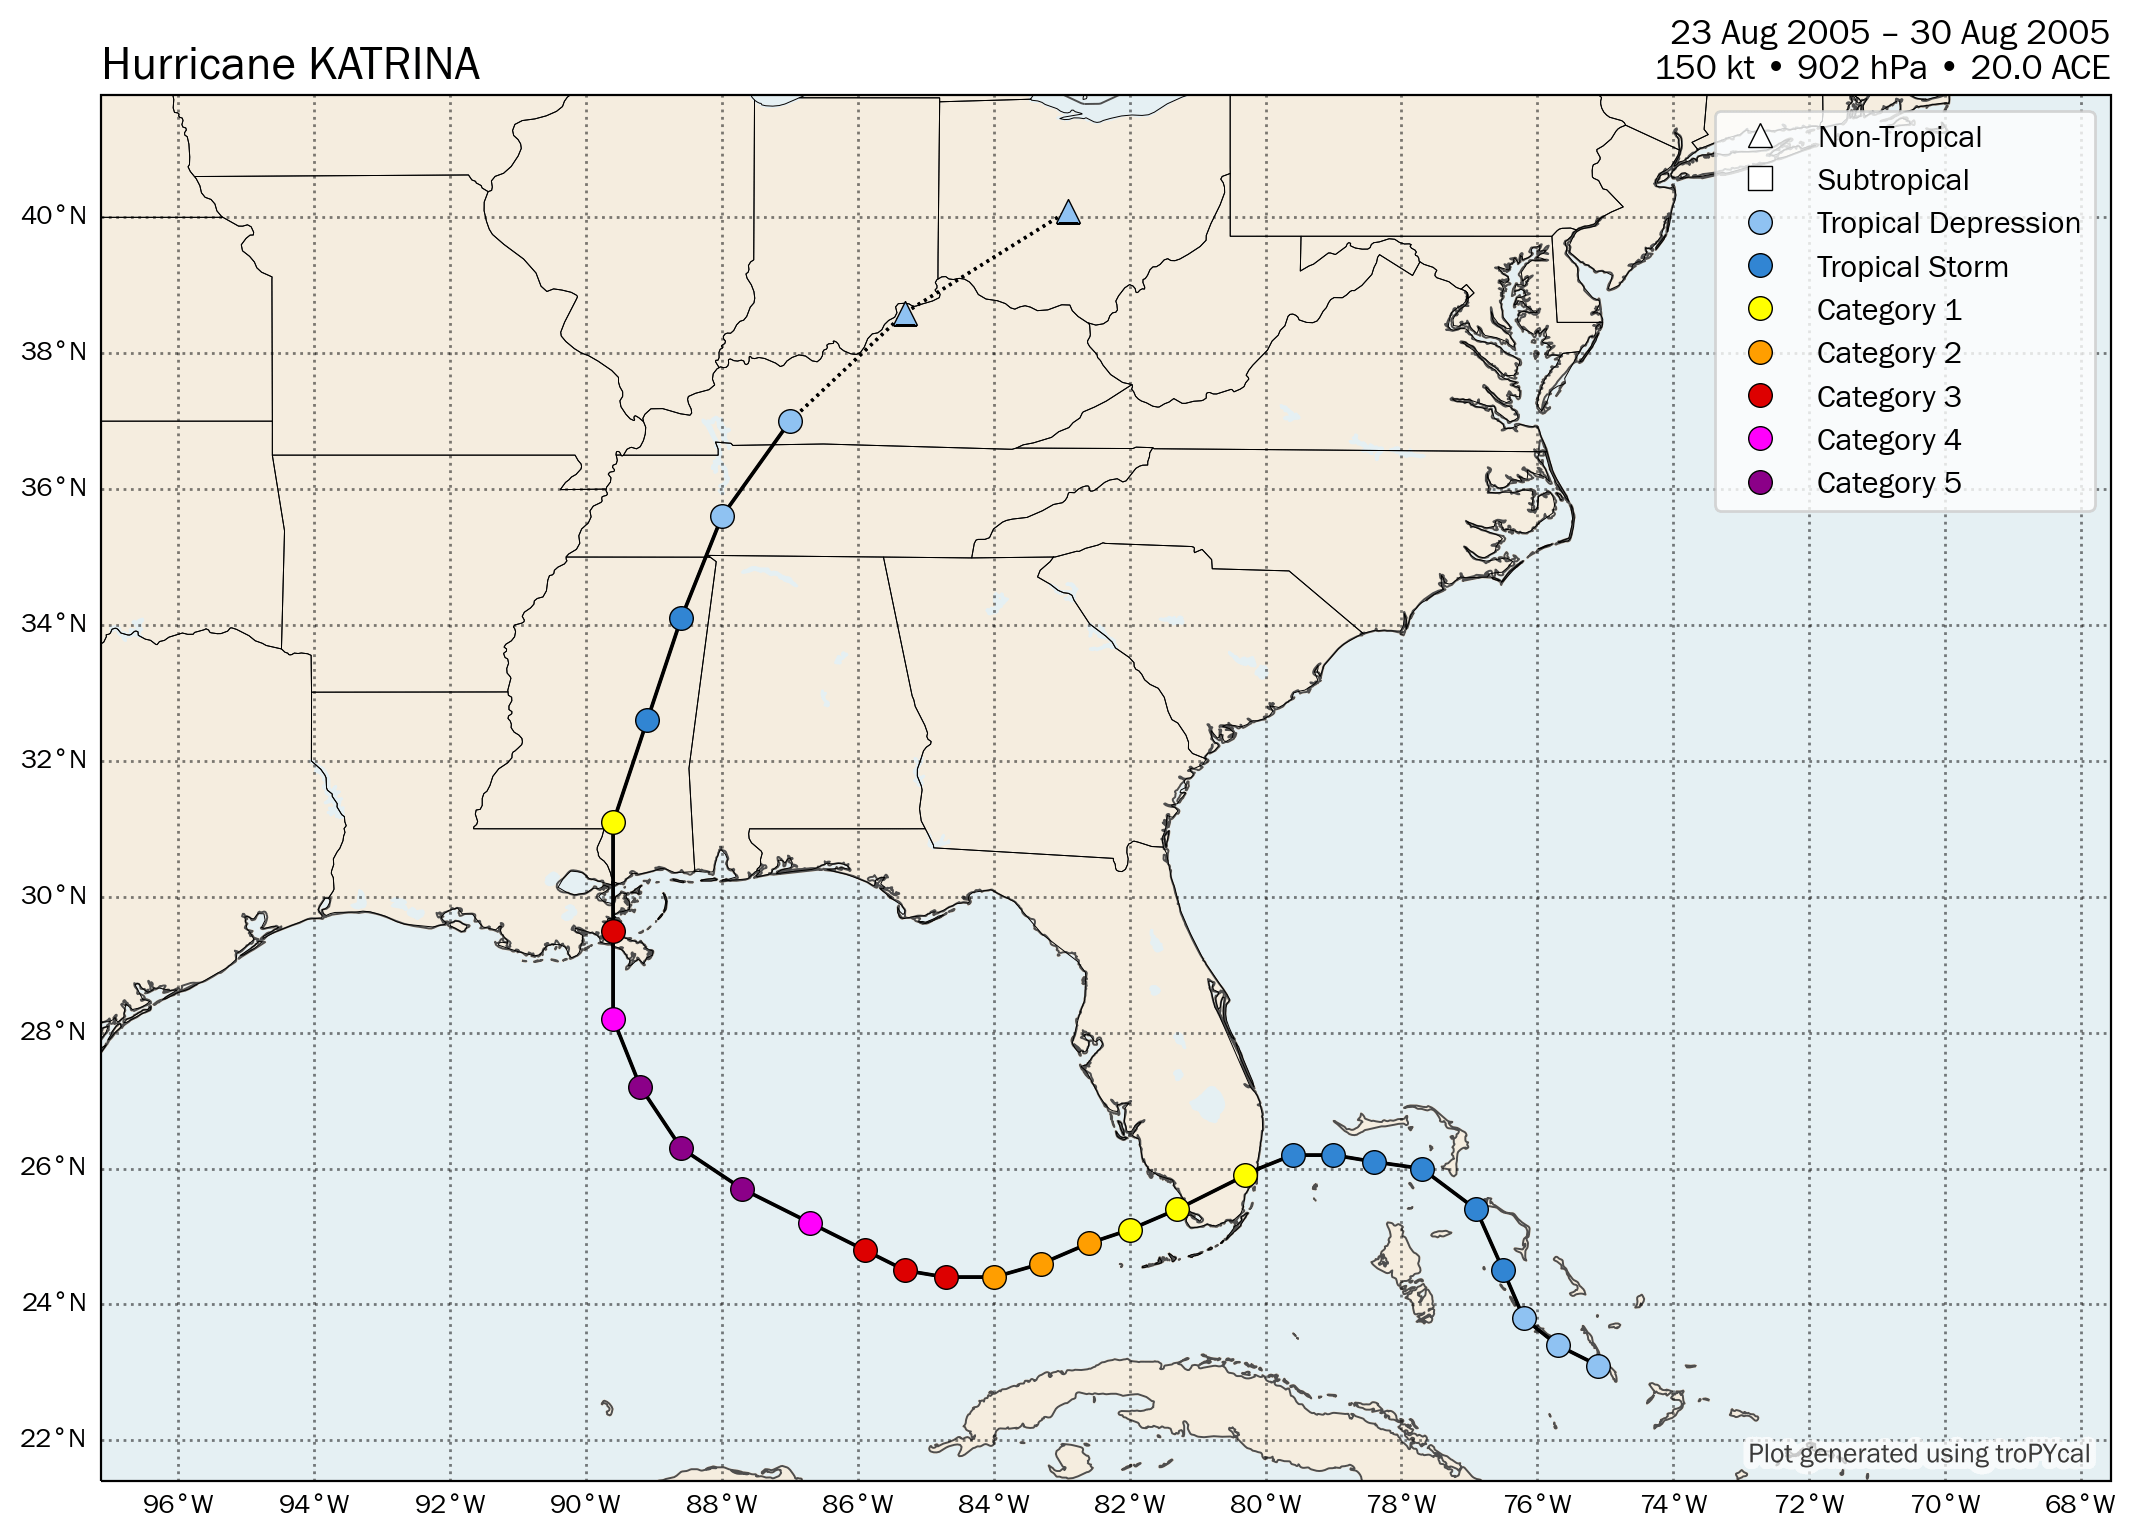
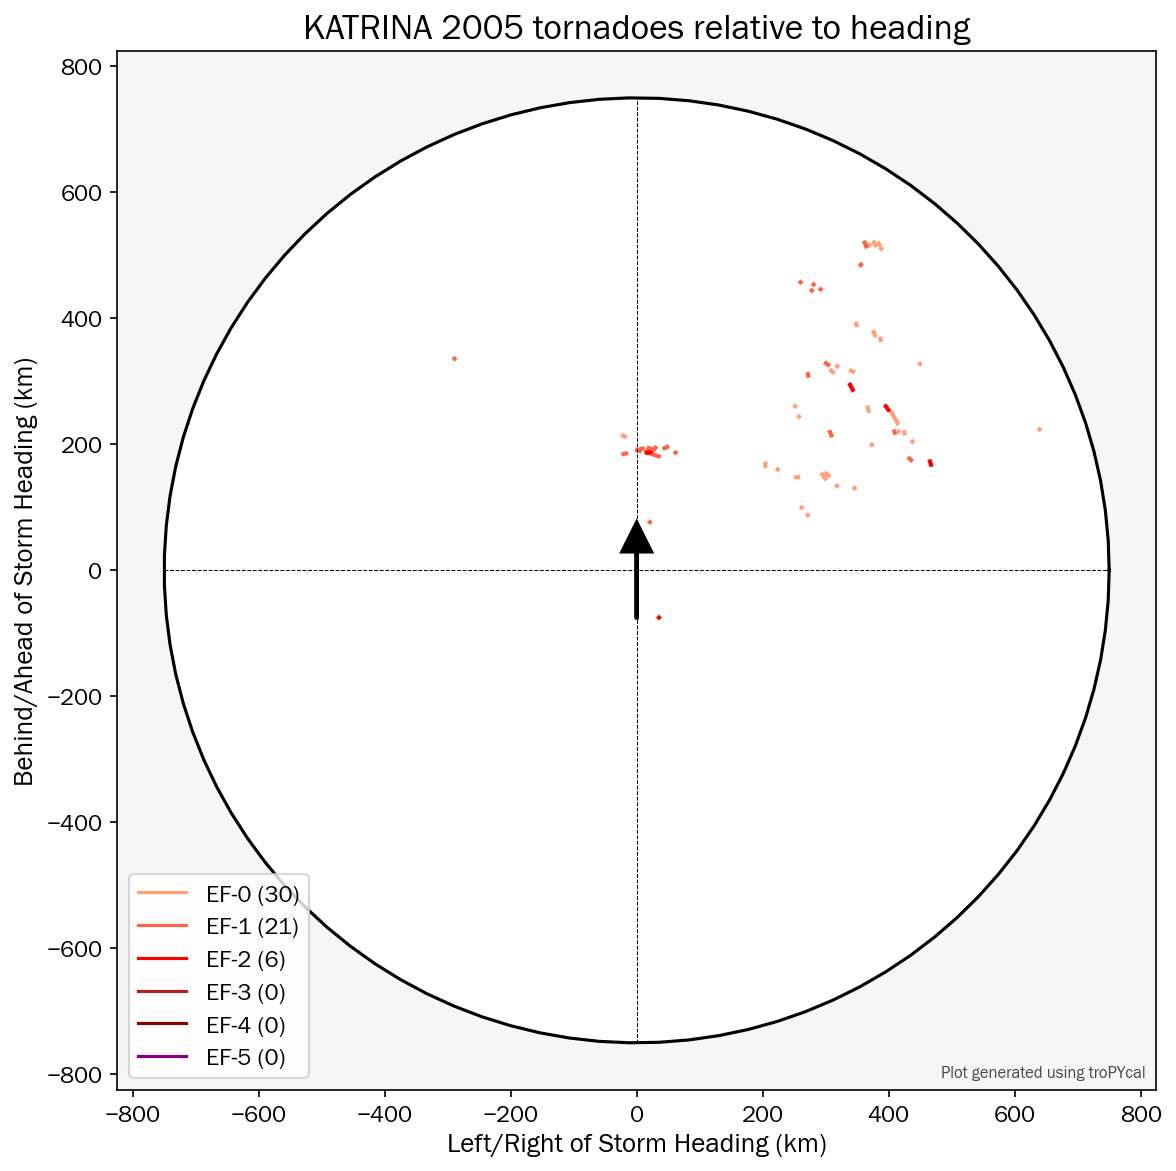
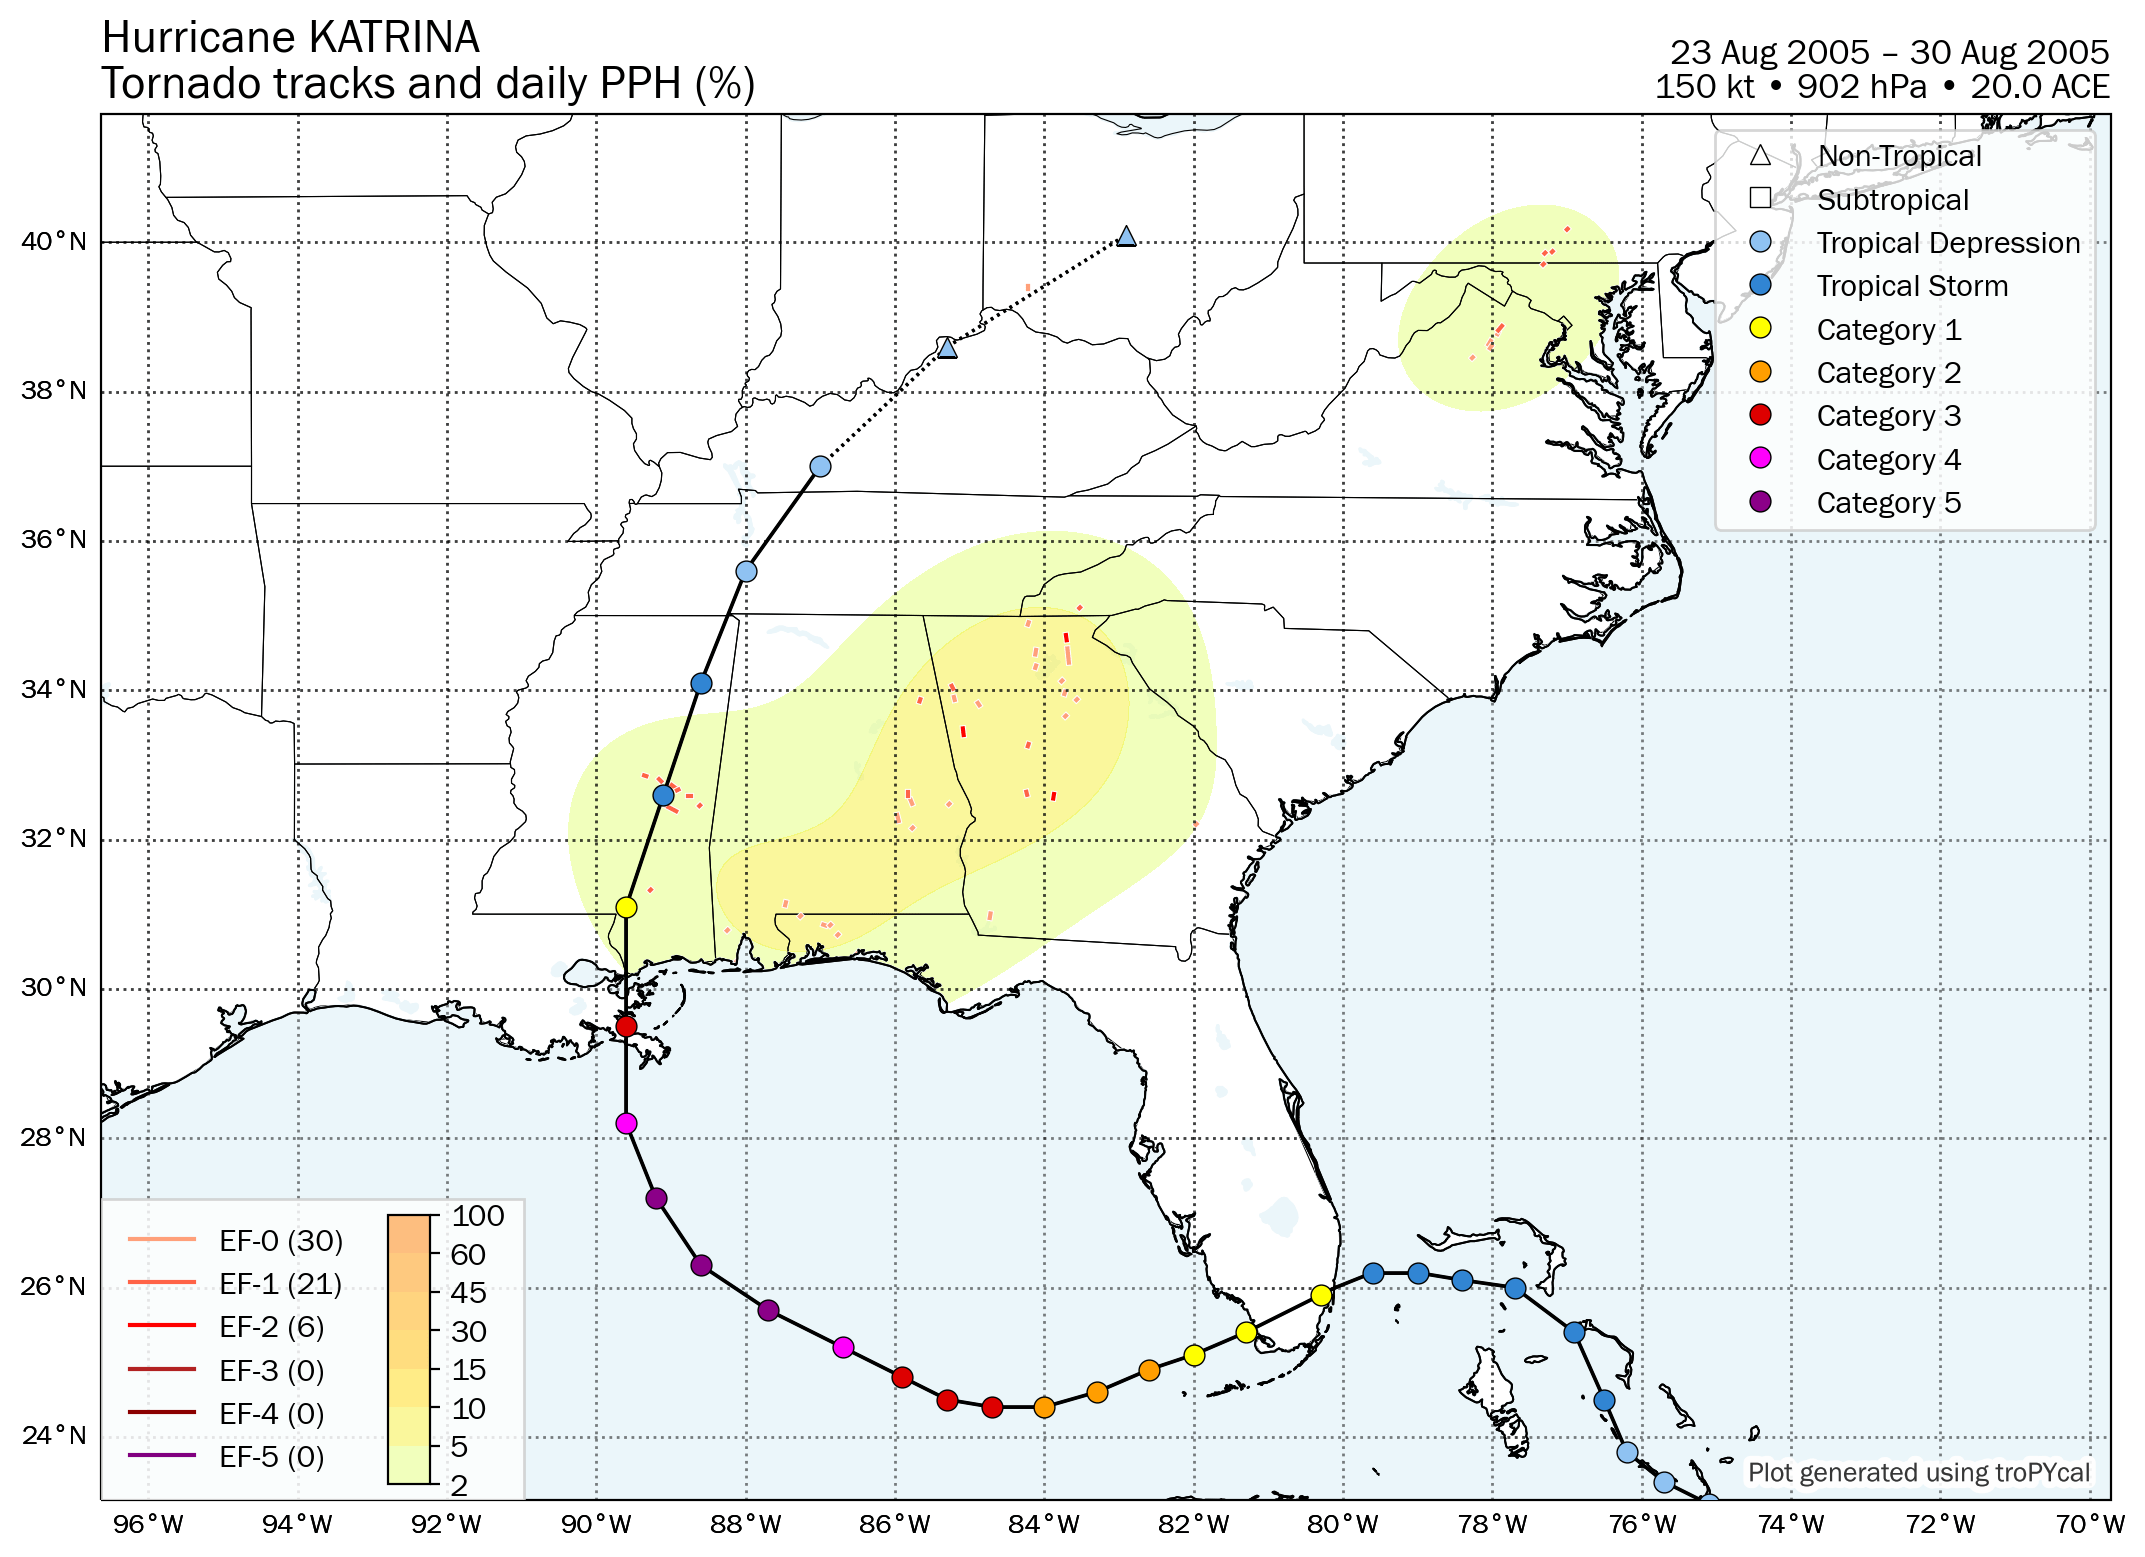
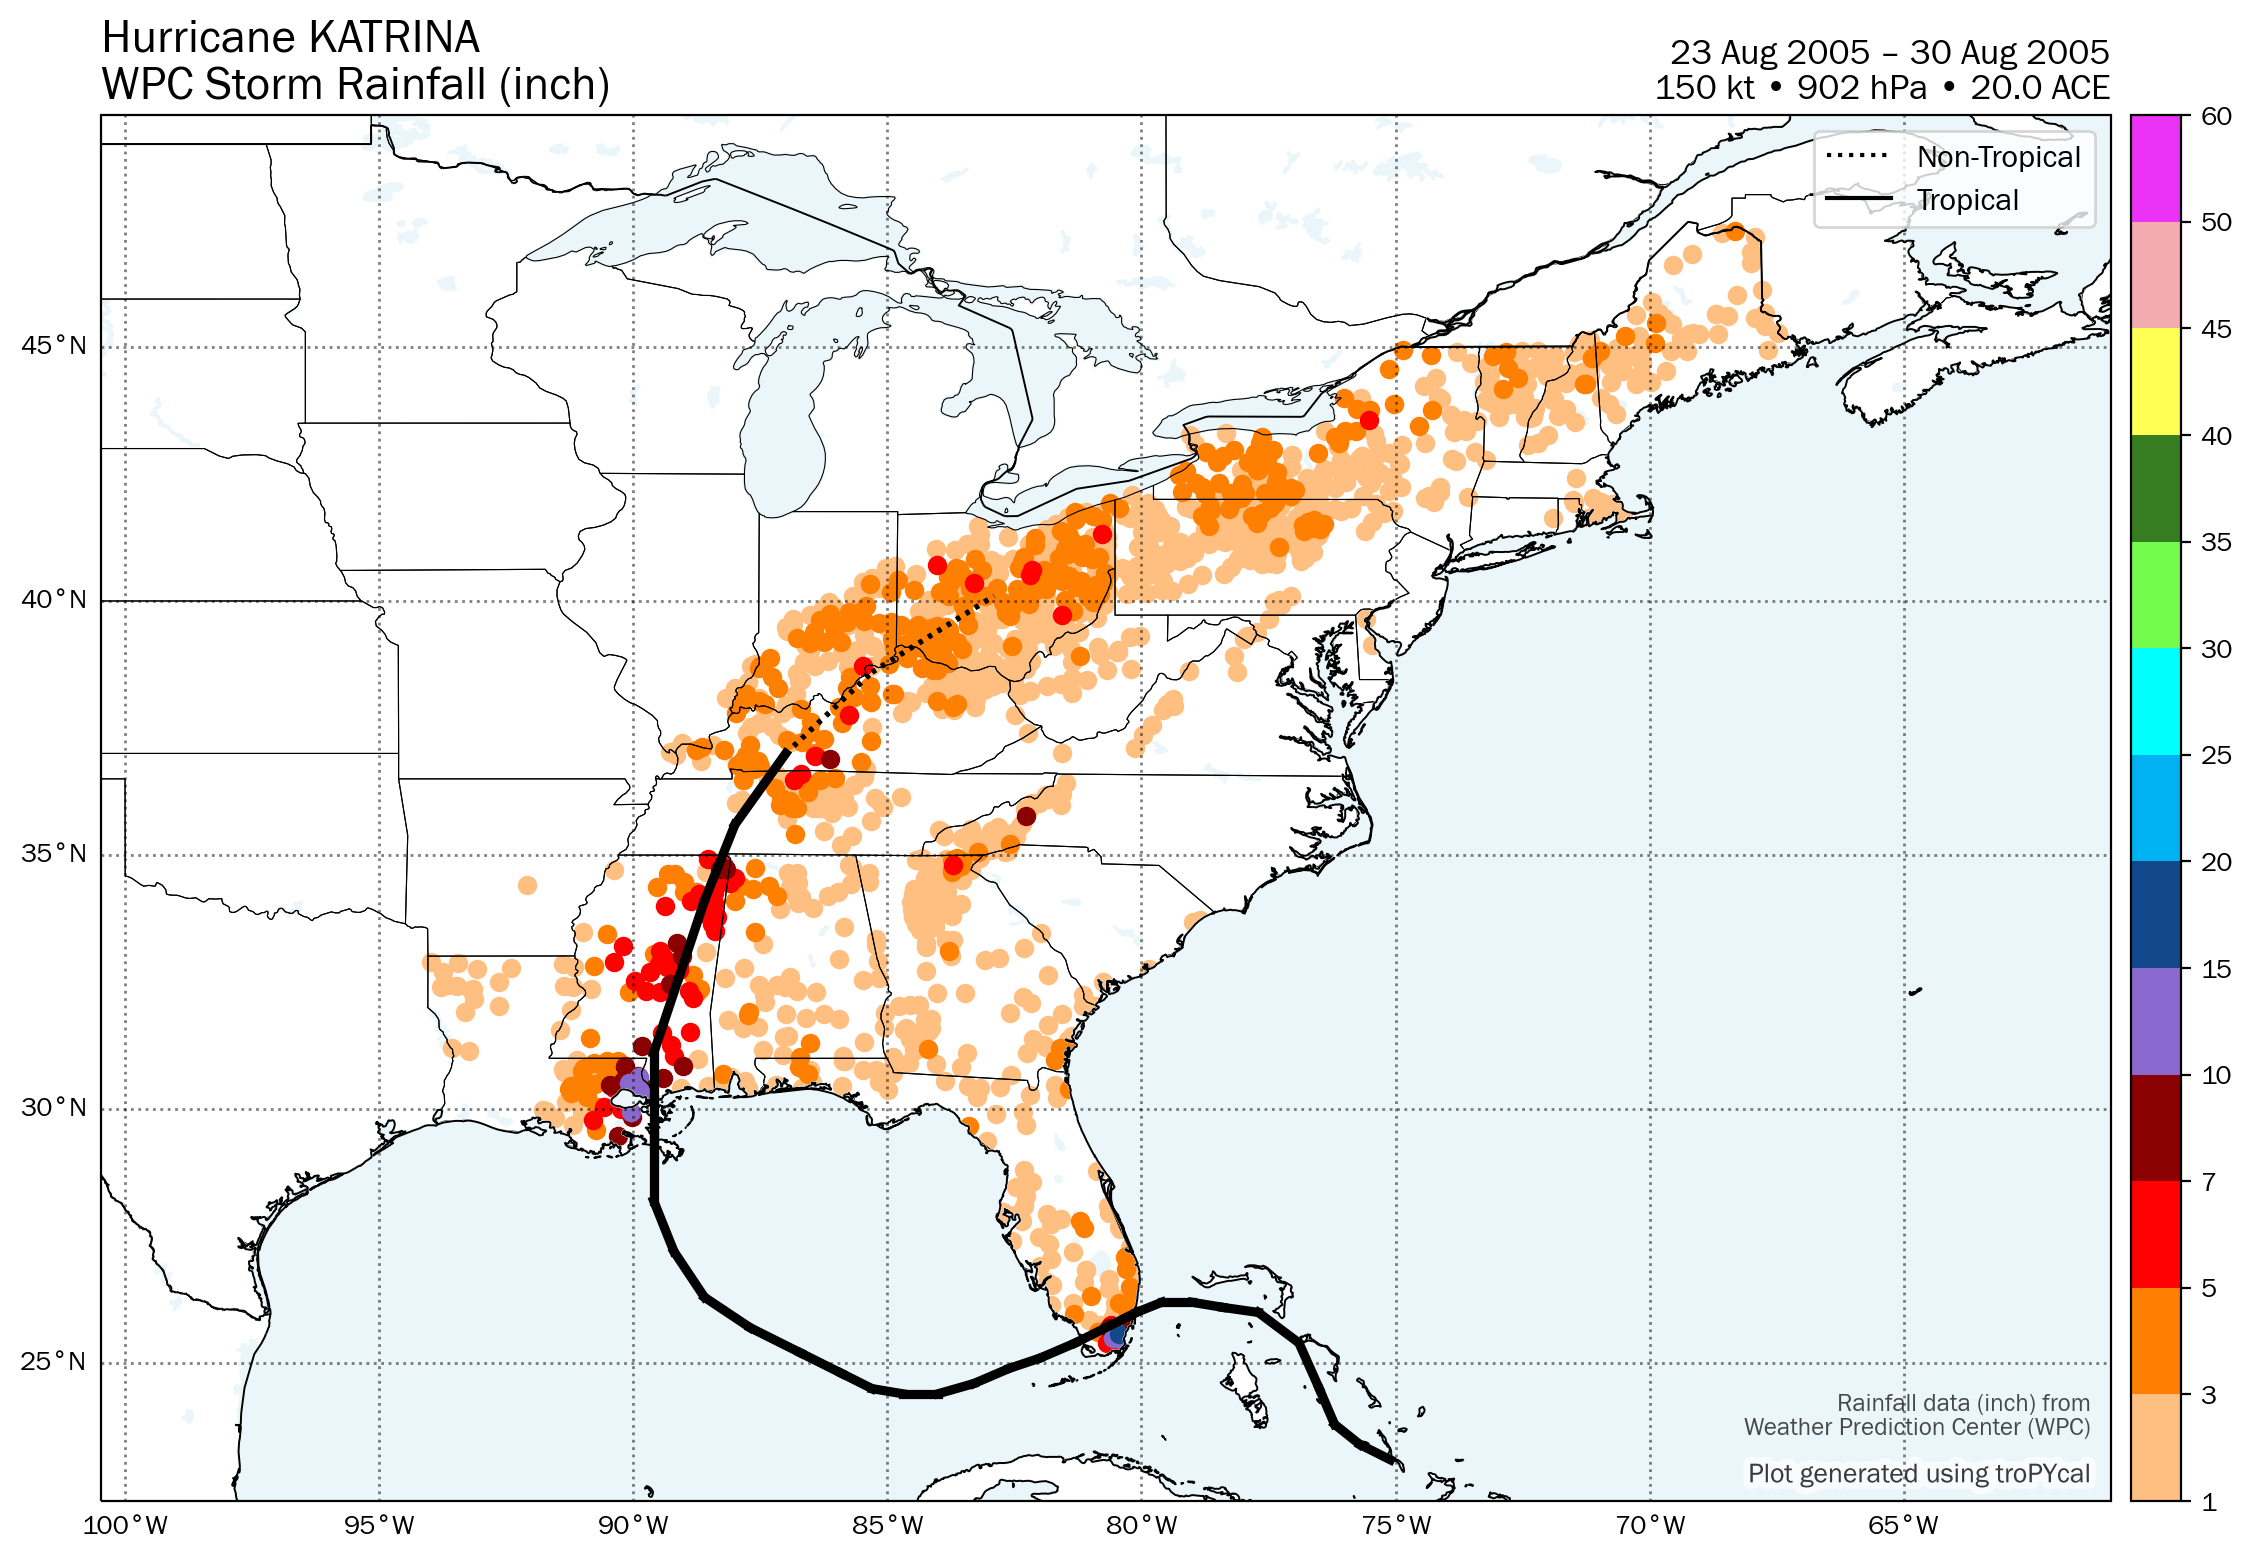
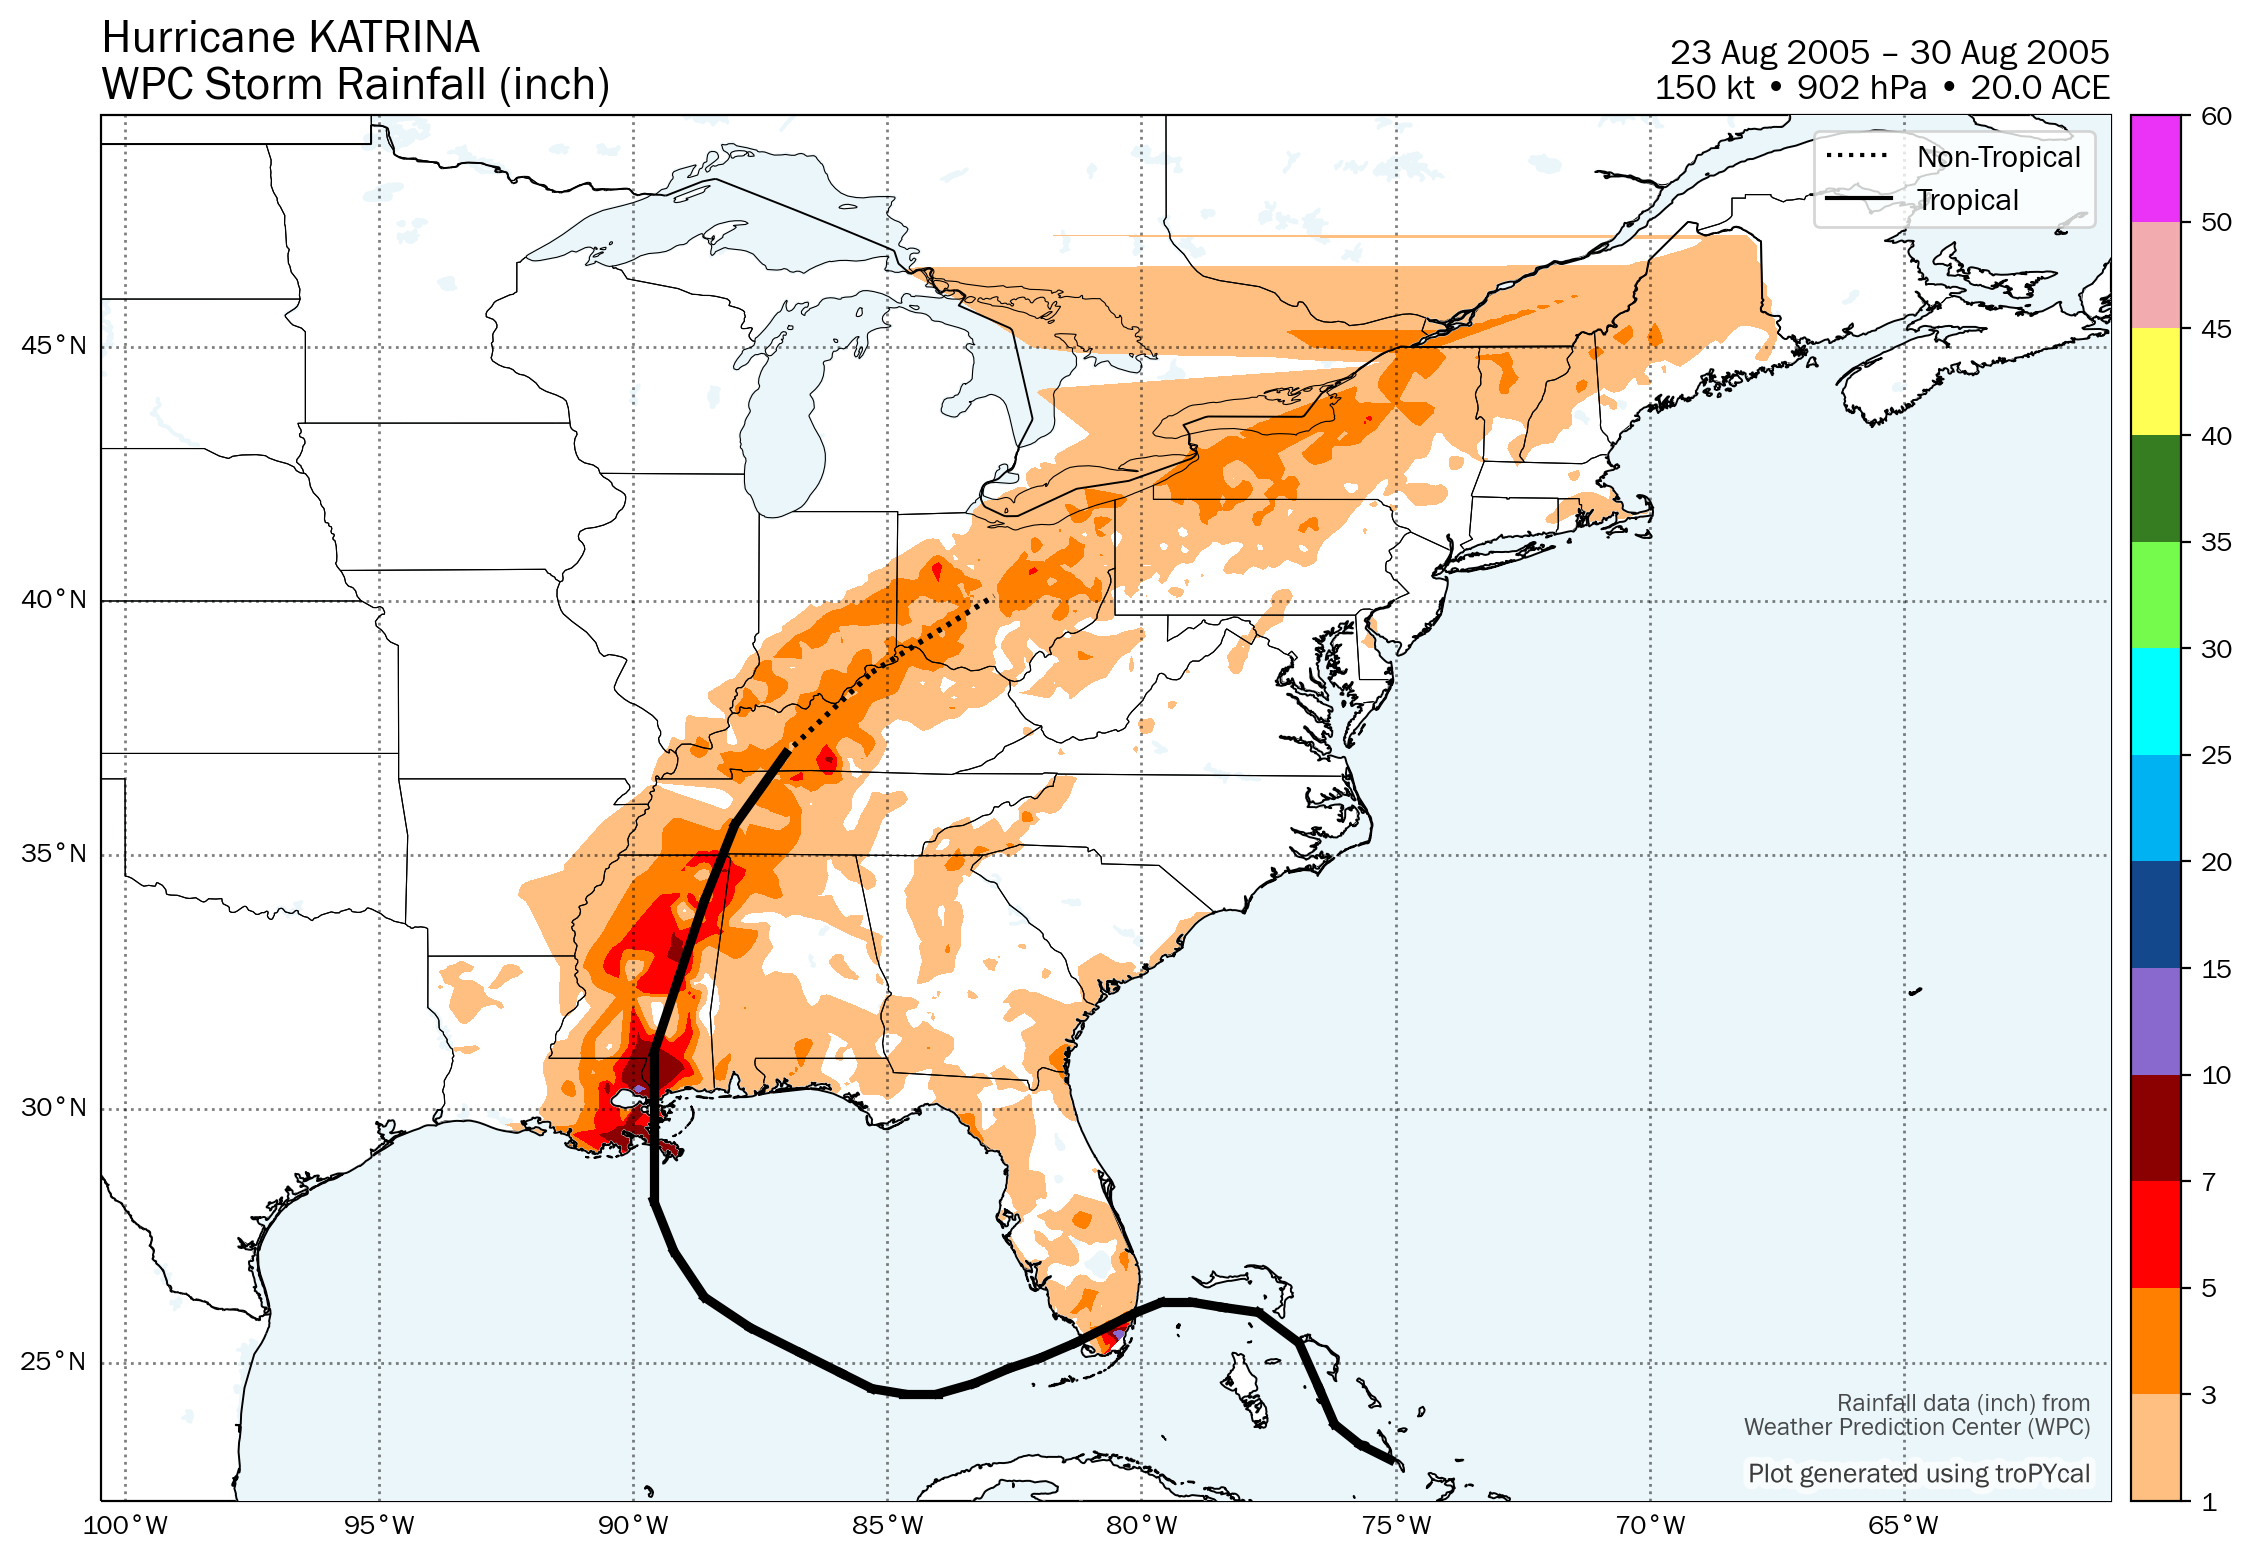
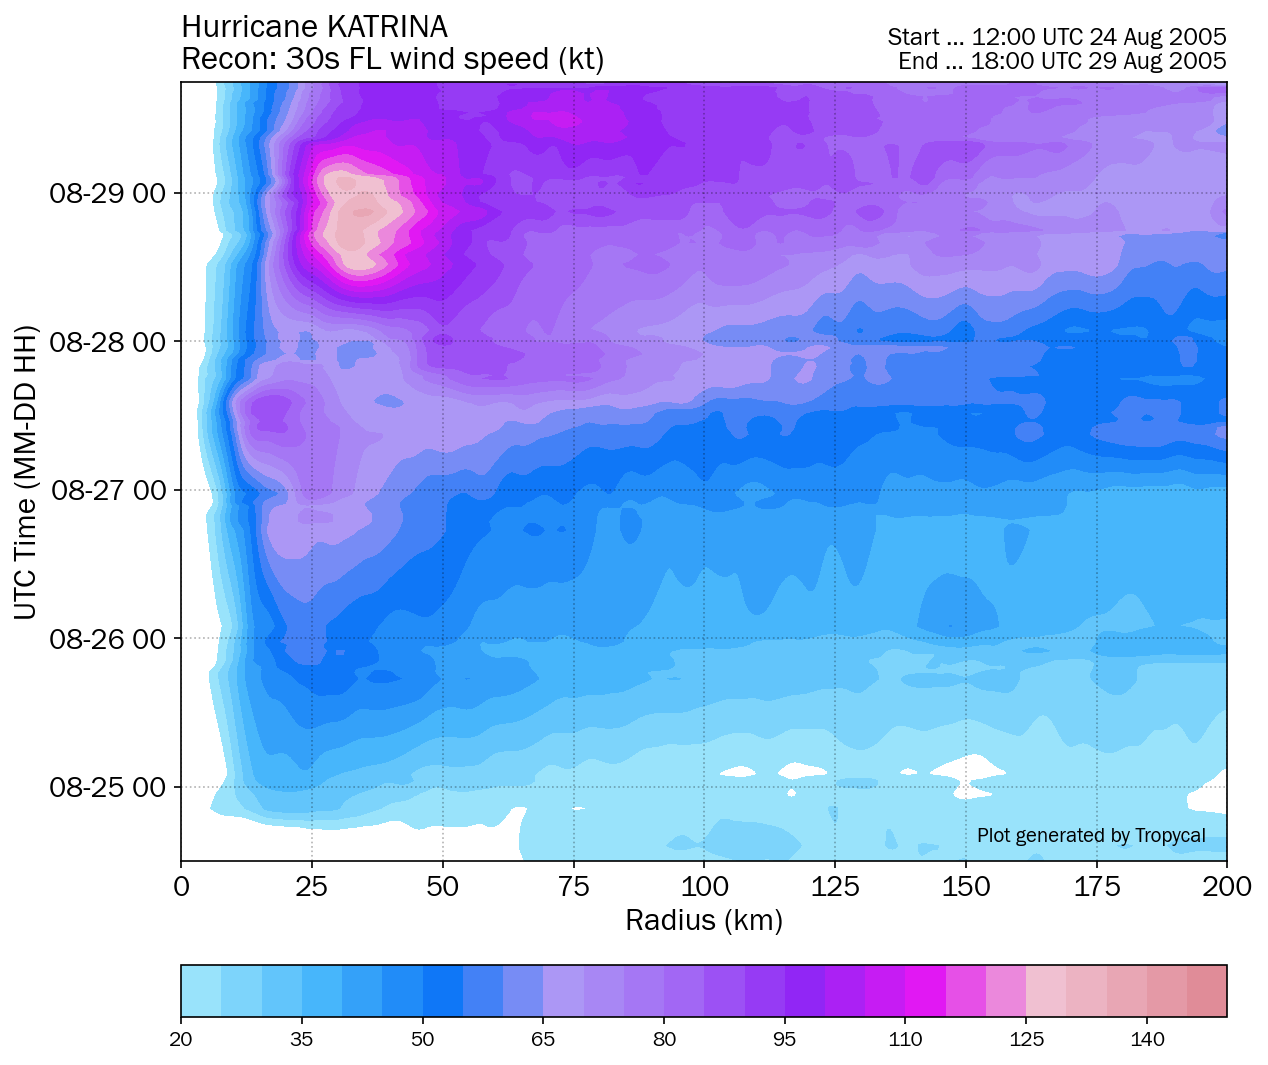
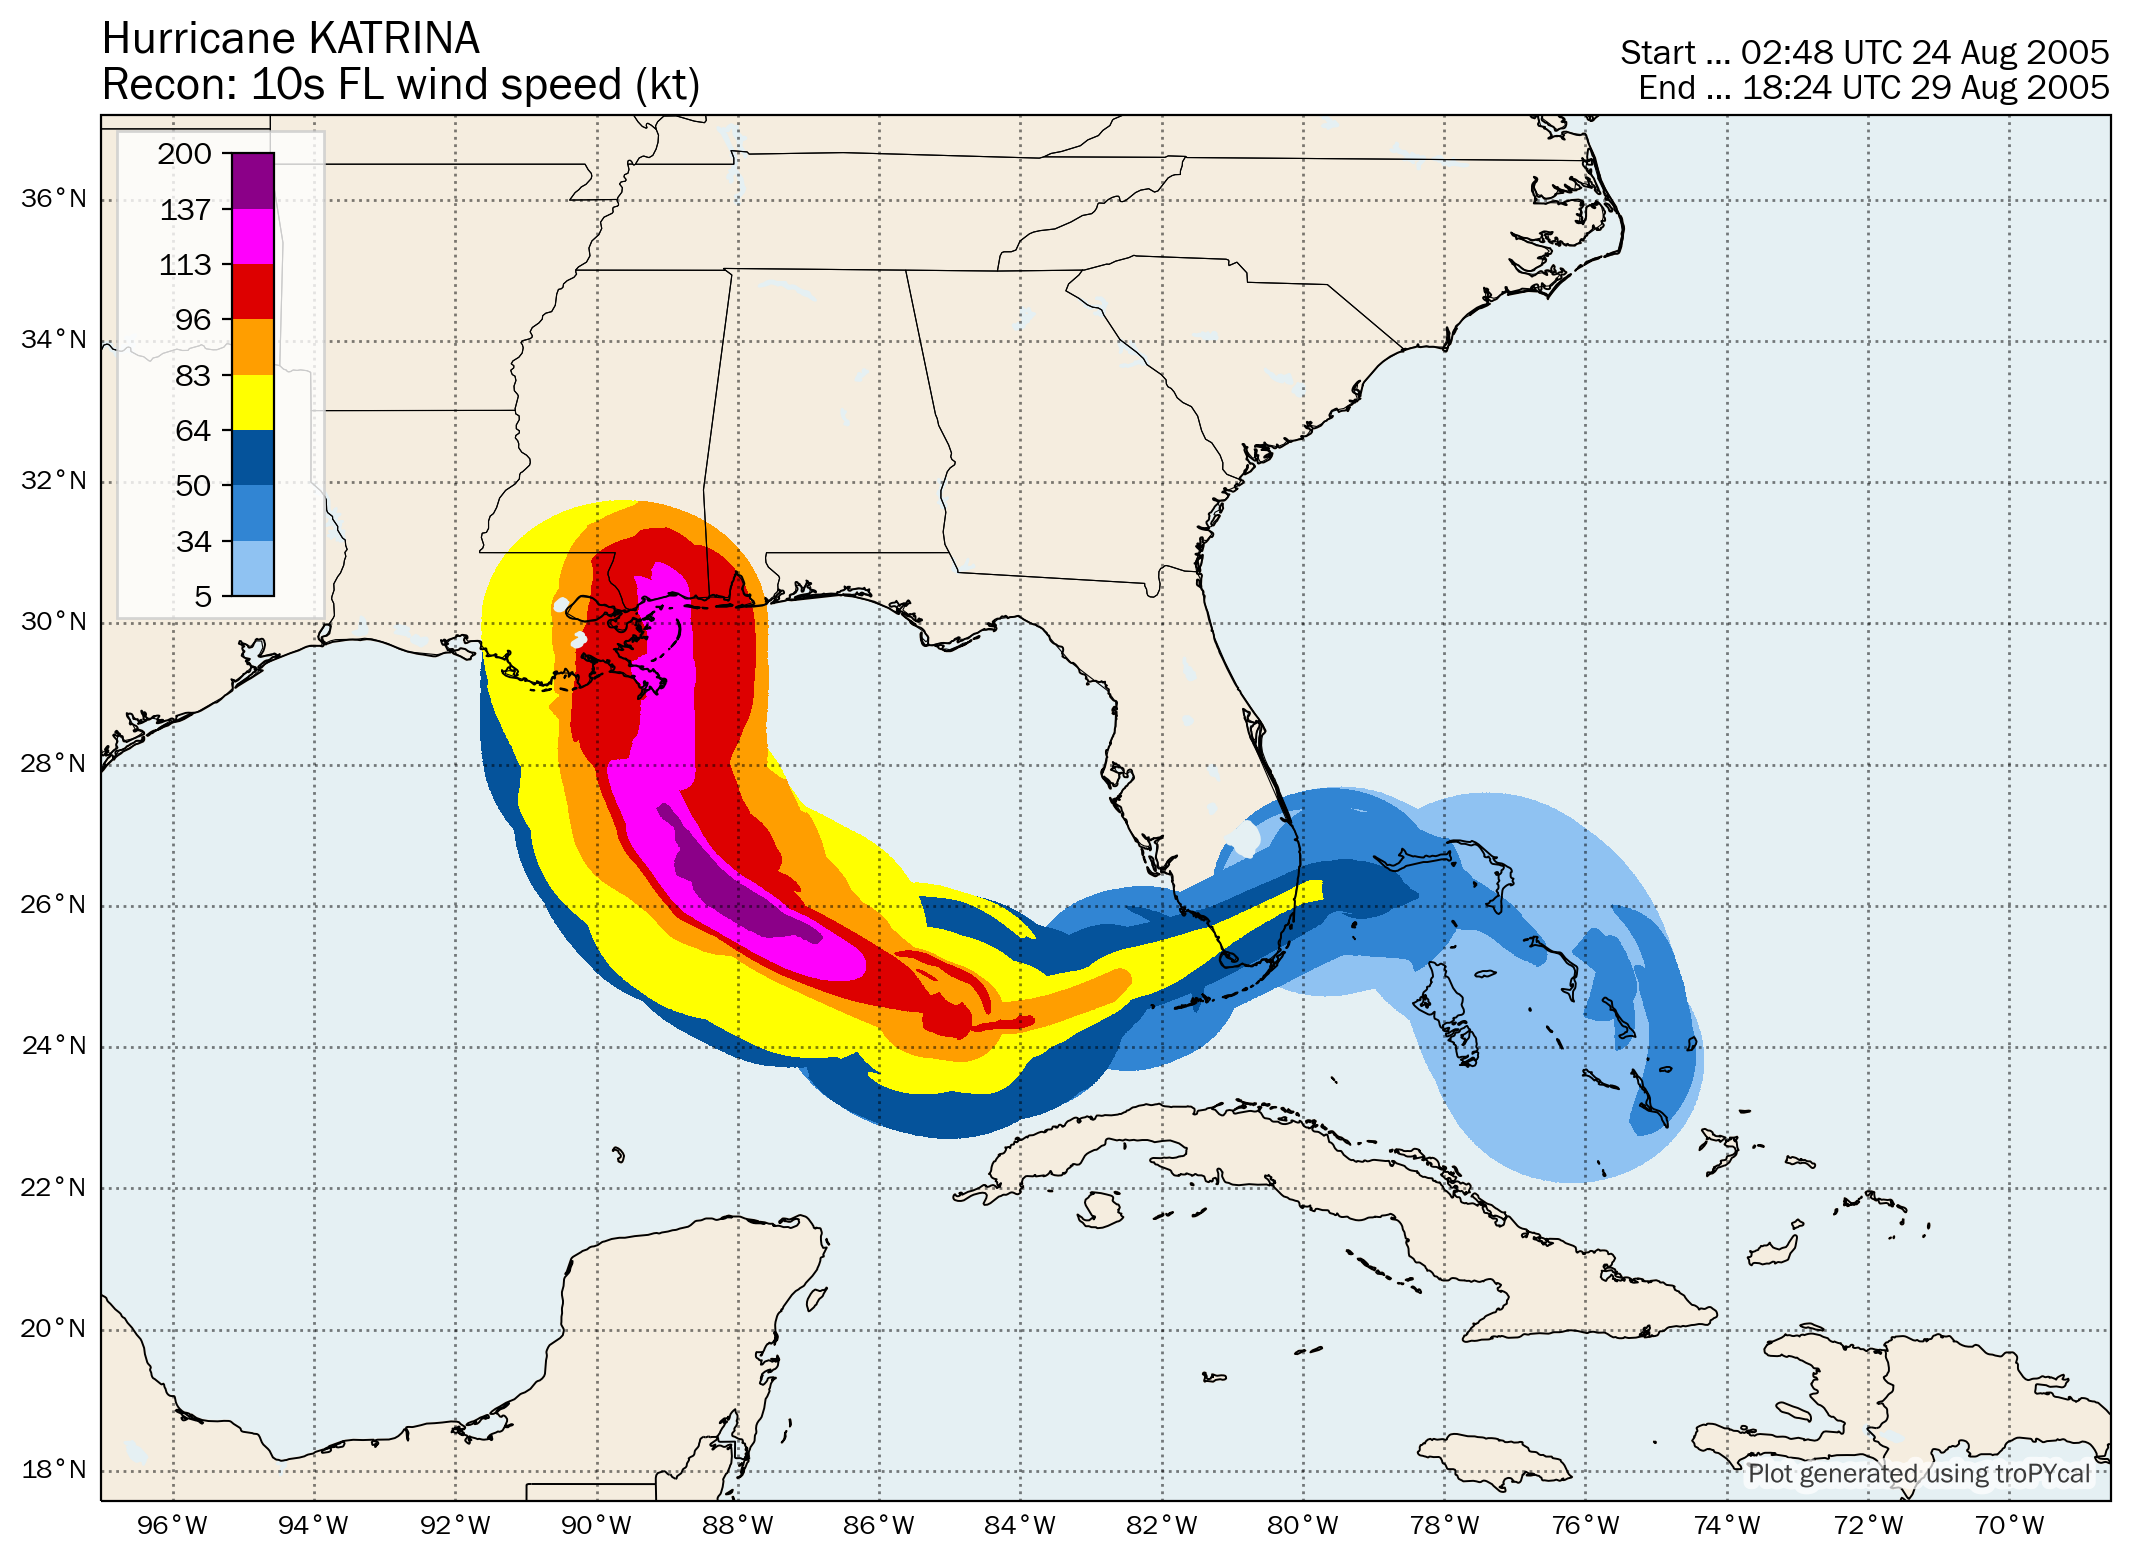
| 5 | Hurricane Katrina | 150 kt | 902 hPa | 18z 08/23 | 18z 08/30 | 20.0 |
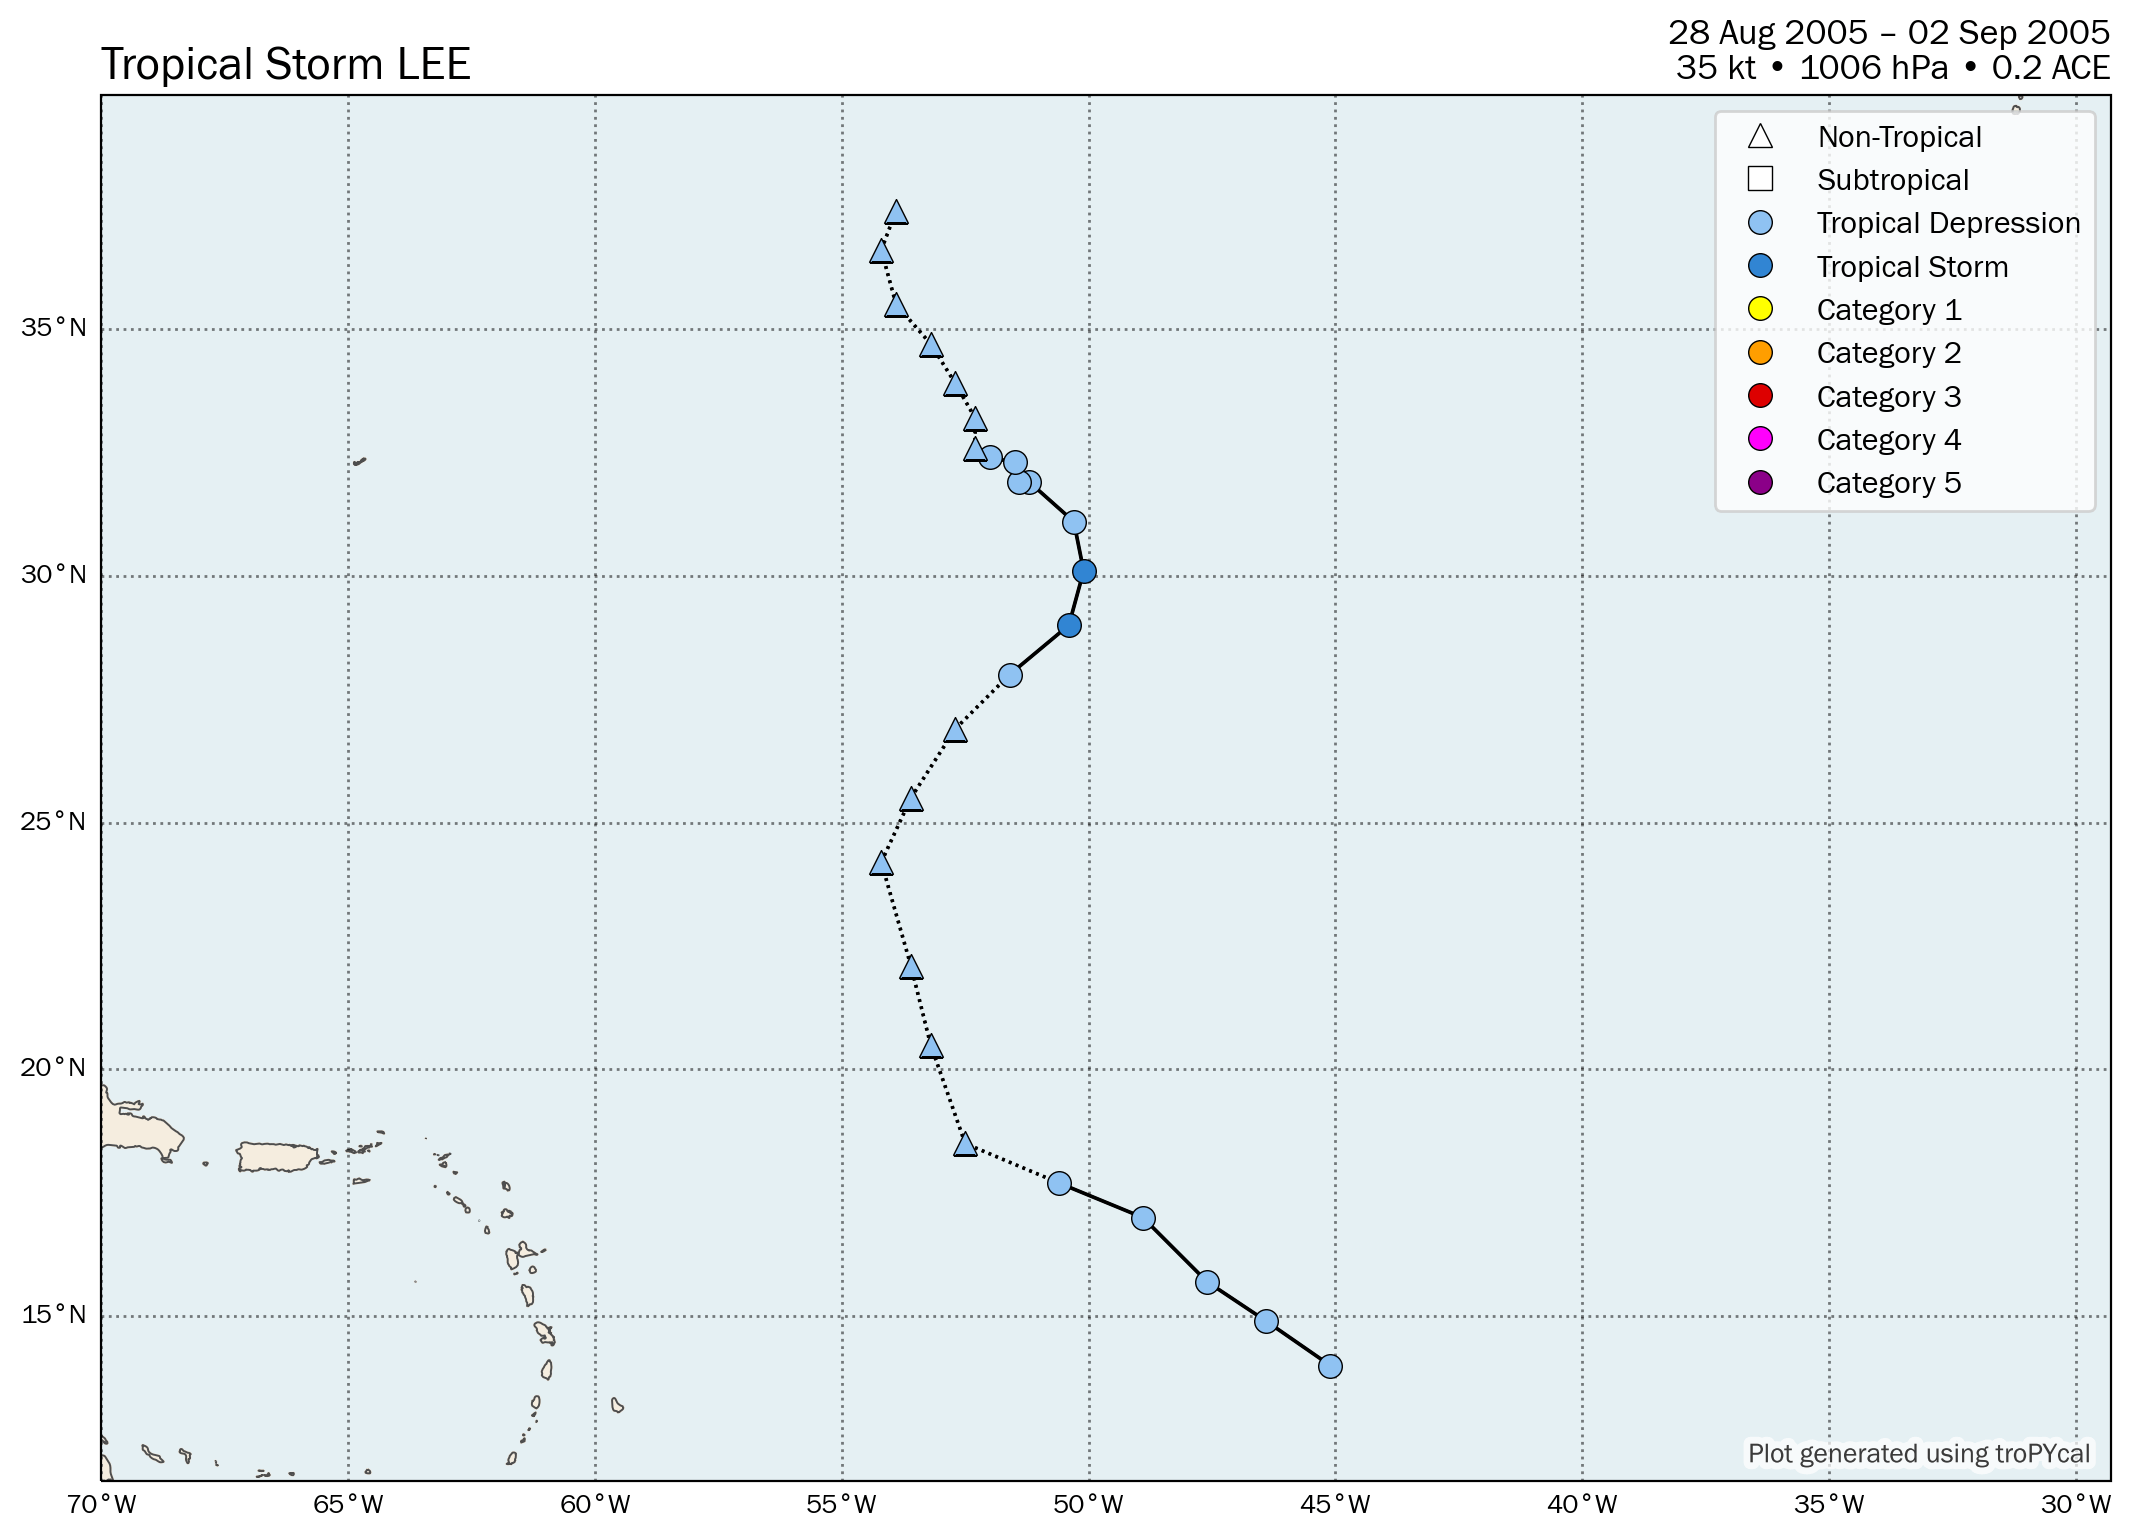
| S | Tropical Storm Lee | 35 kt | 1006 hPa | 12z 08/28 | 00z 09/02 | 0.2 |
| 3 | Hurricane Maria | 100 kt | 962 hPa | 12z 09/01 | 06z 09/10 | 14.3 |
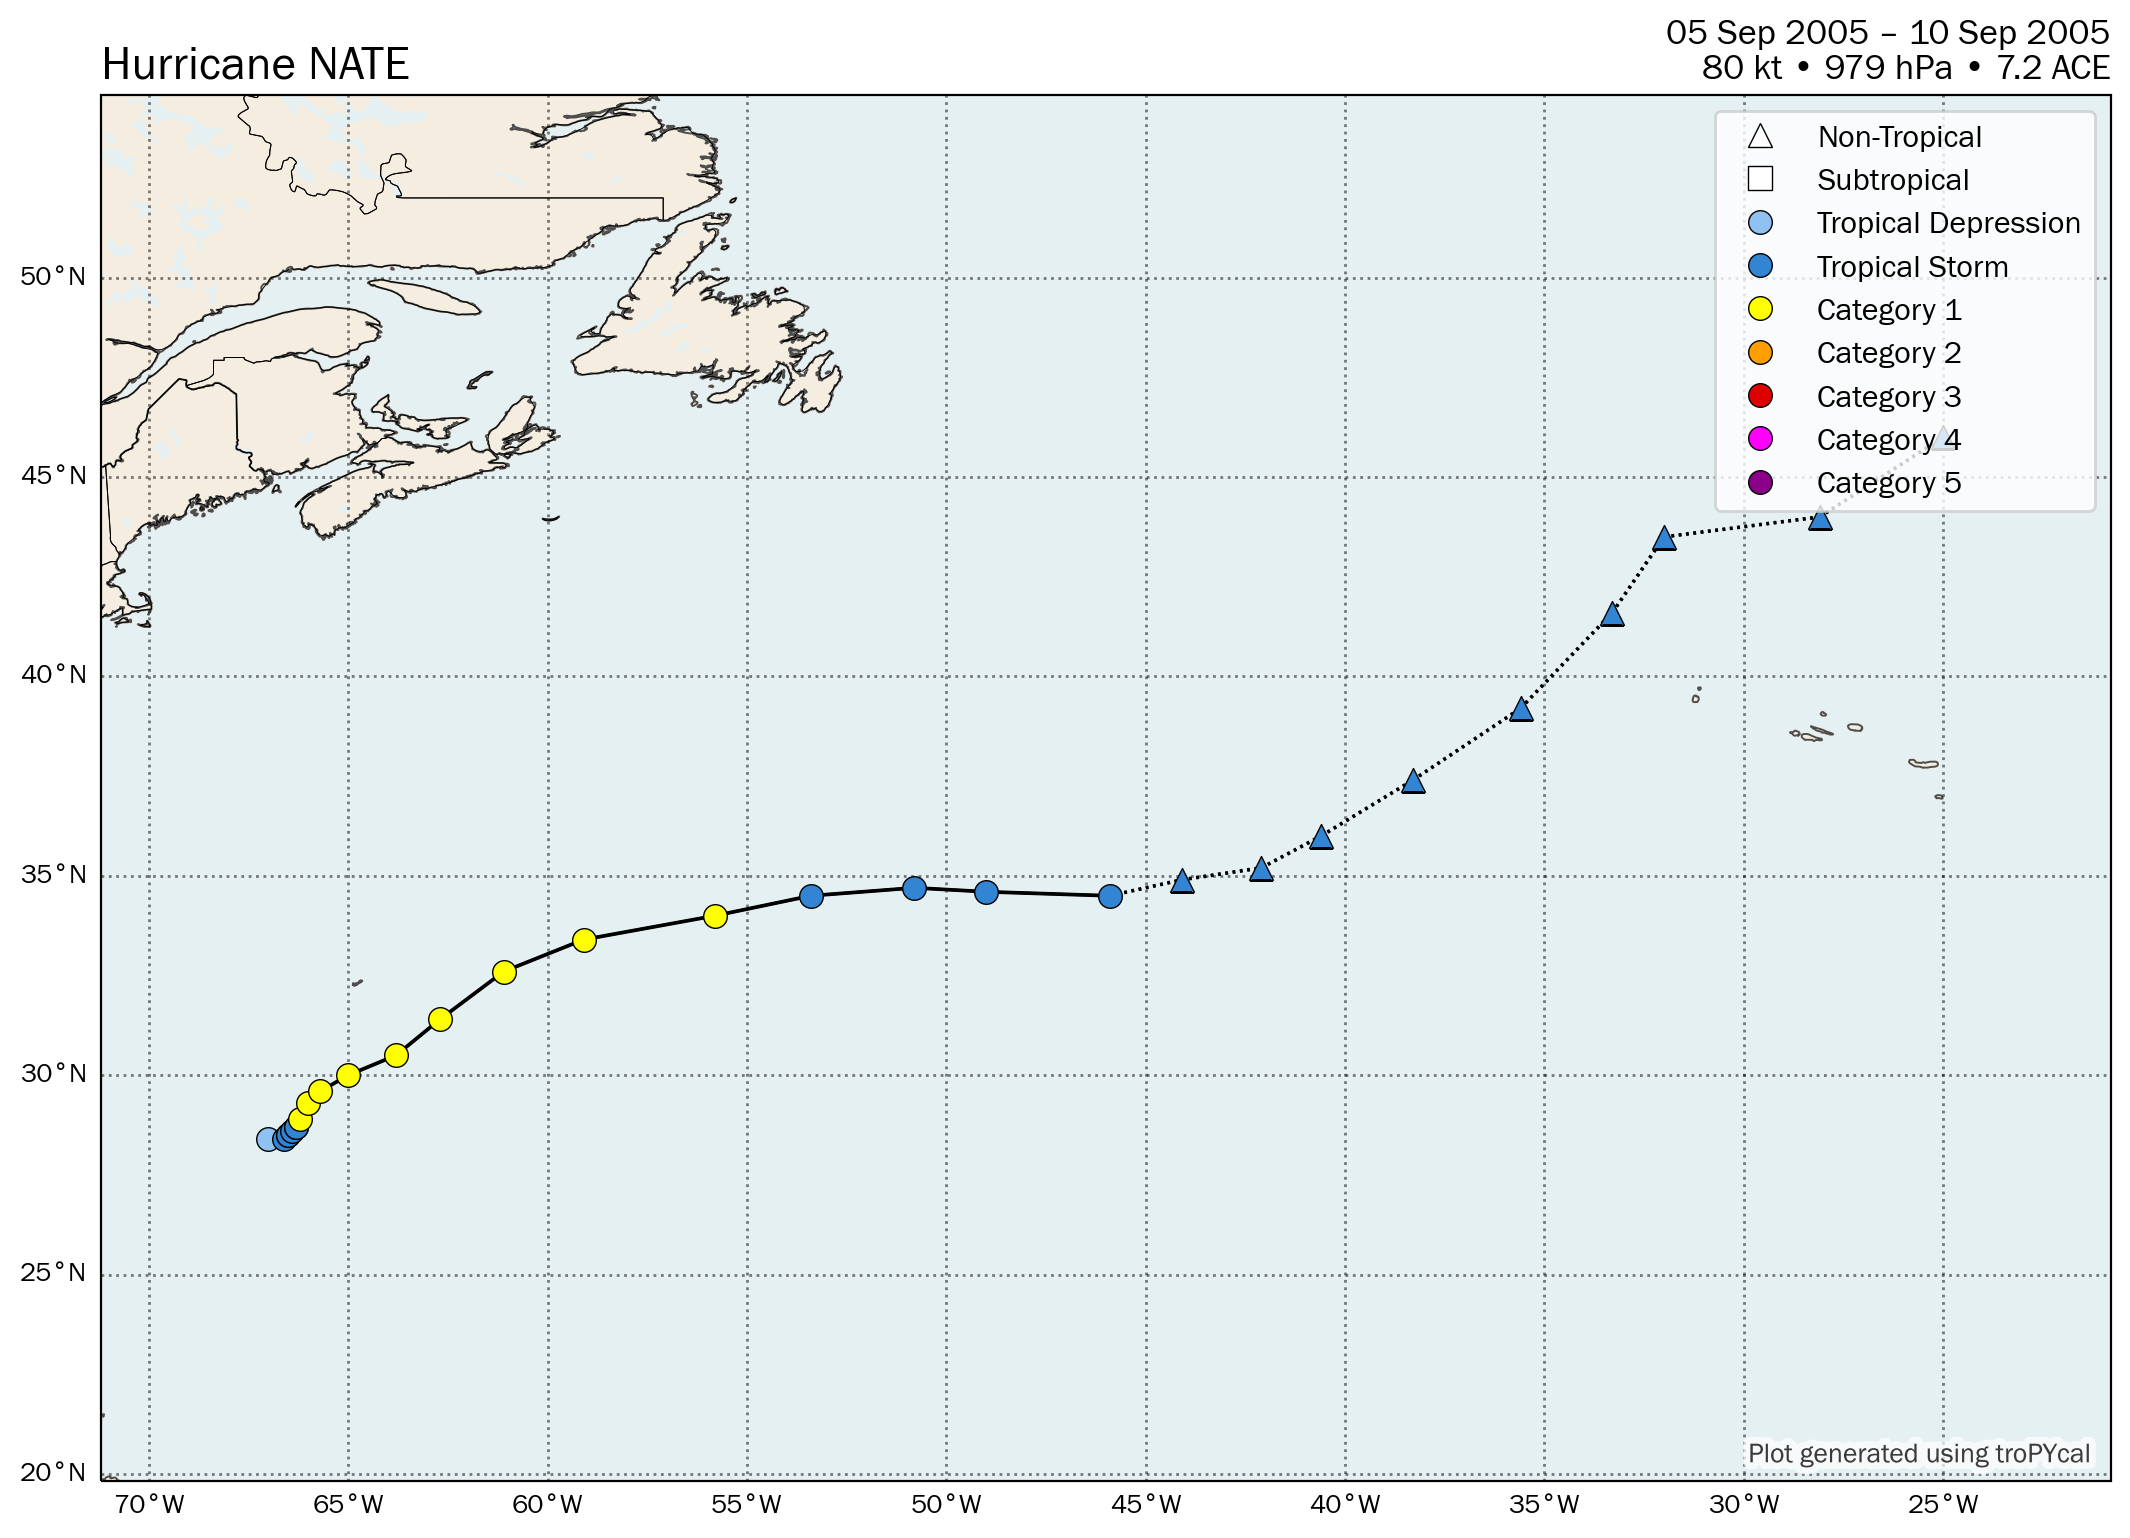
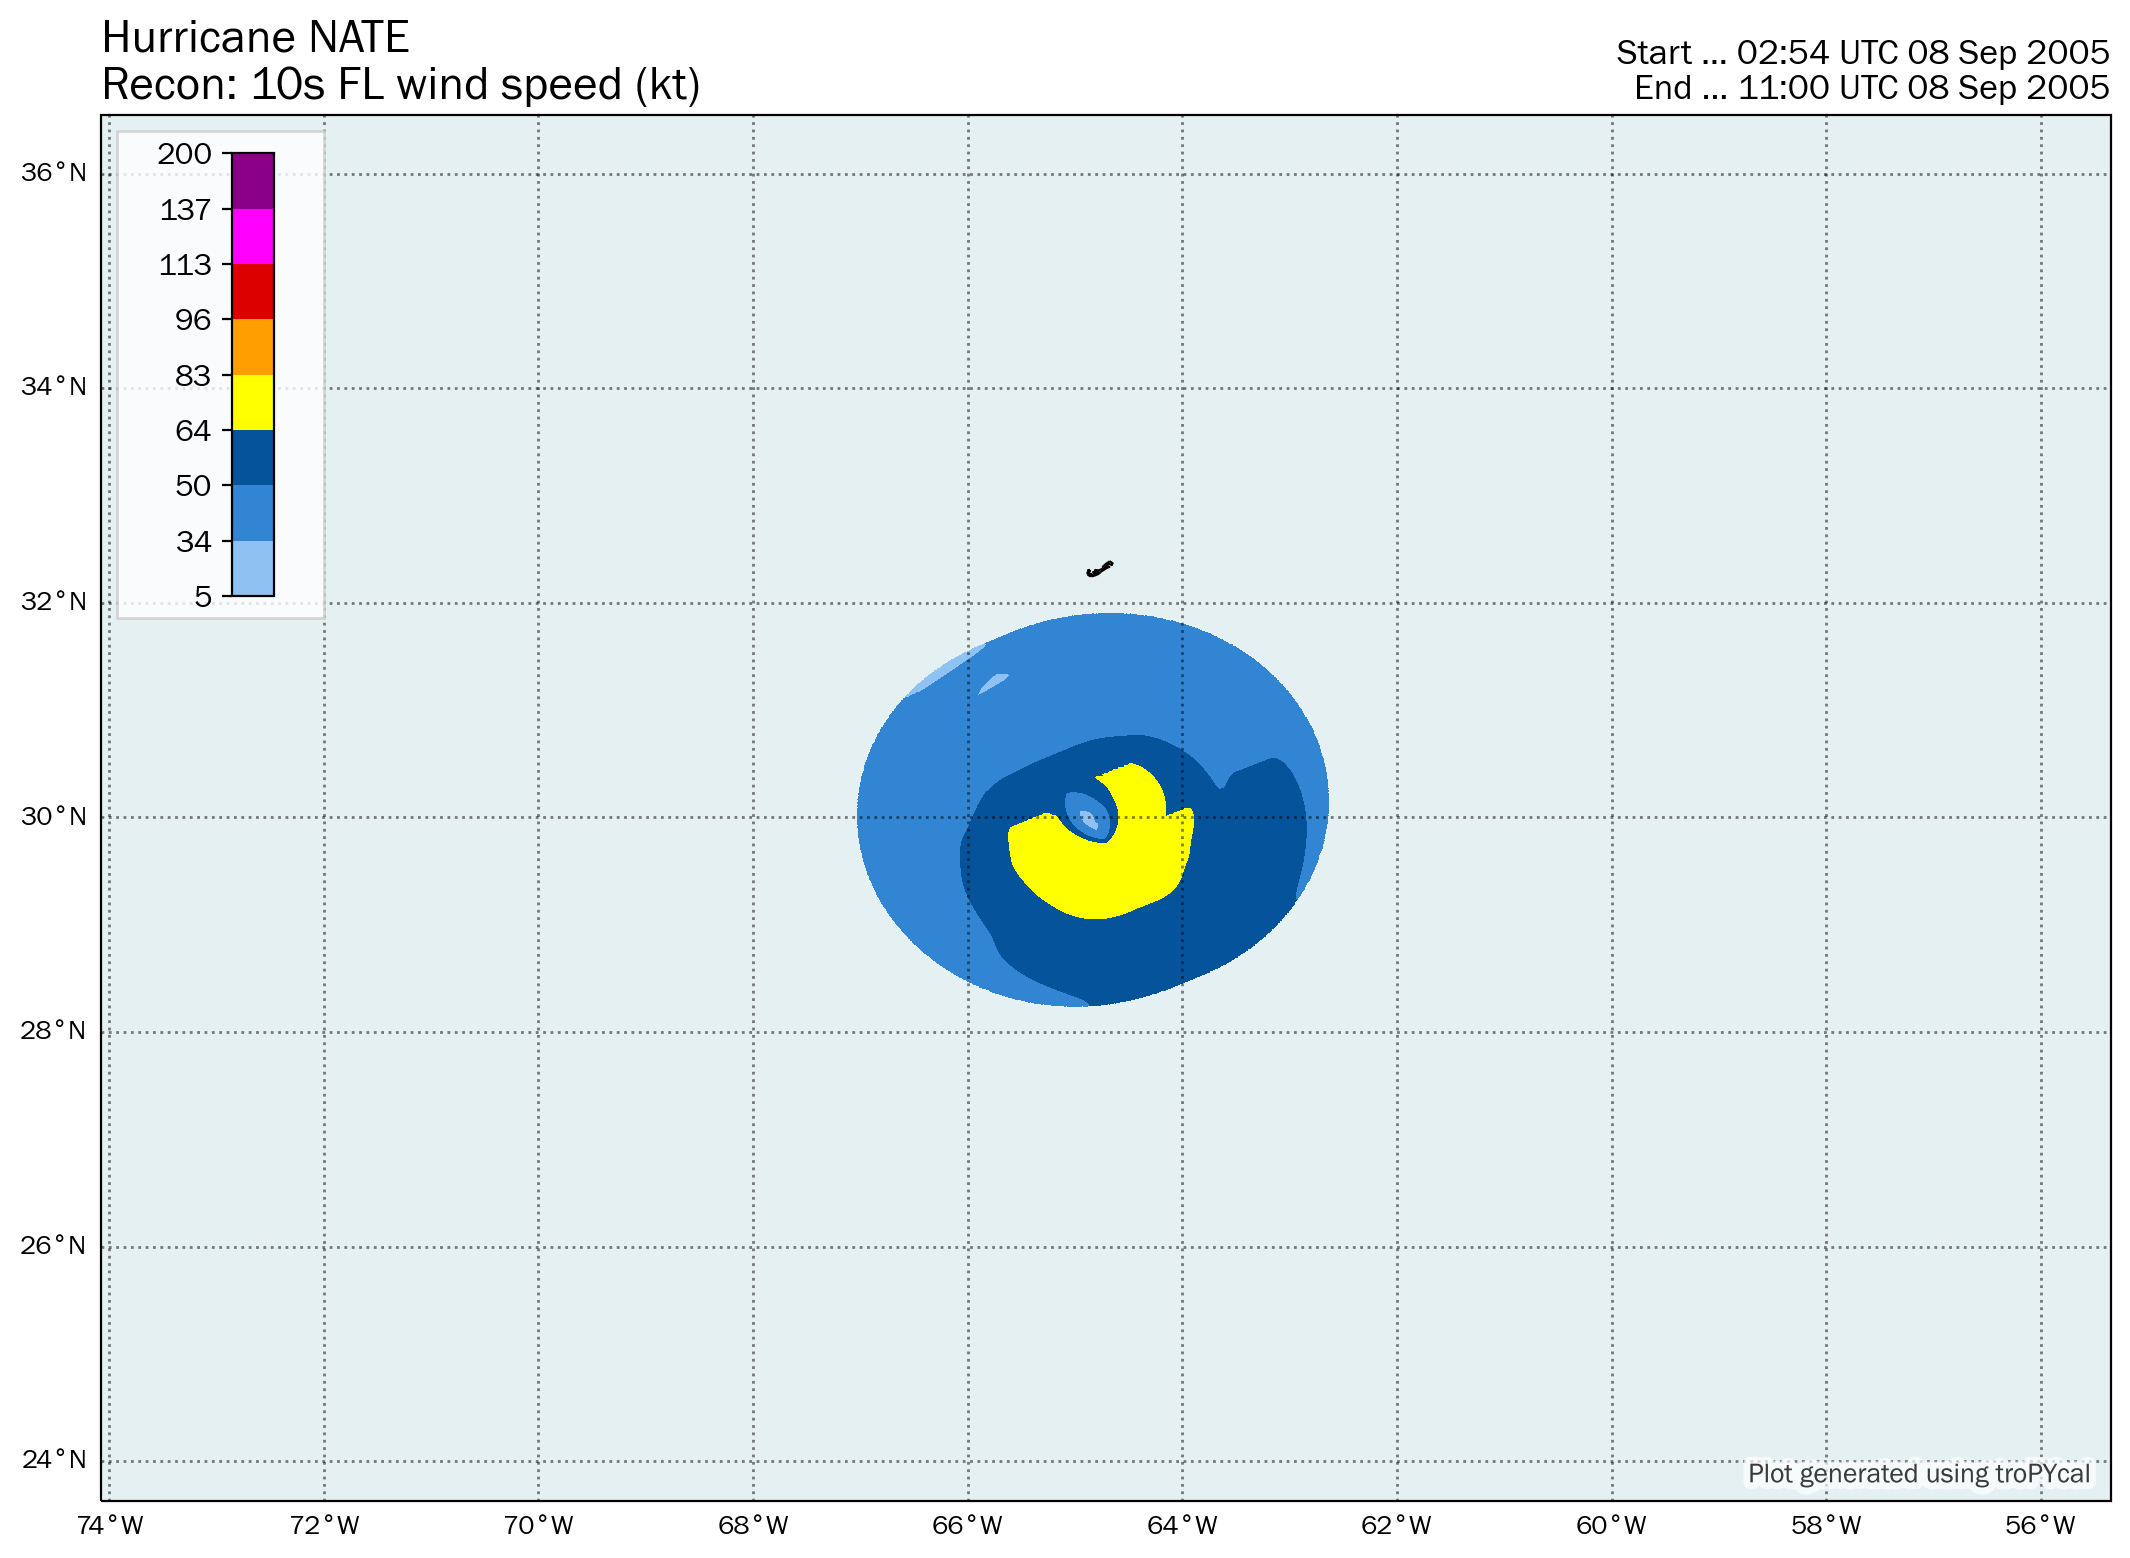
| 1 | Hurricane Nate | 80 kt | 979 hPa | 18z 09/05 | 12z 09/10 | 7.2 |
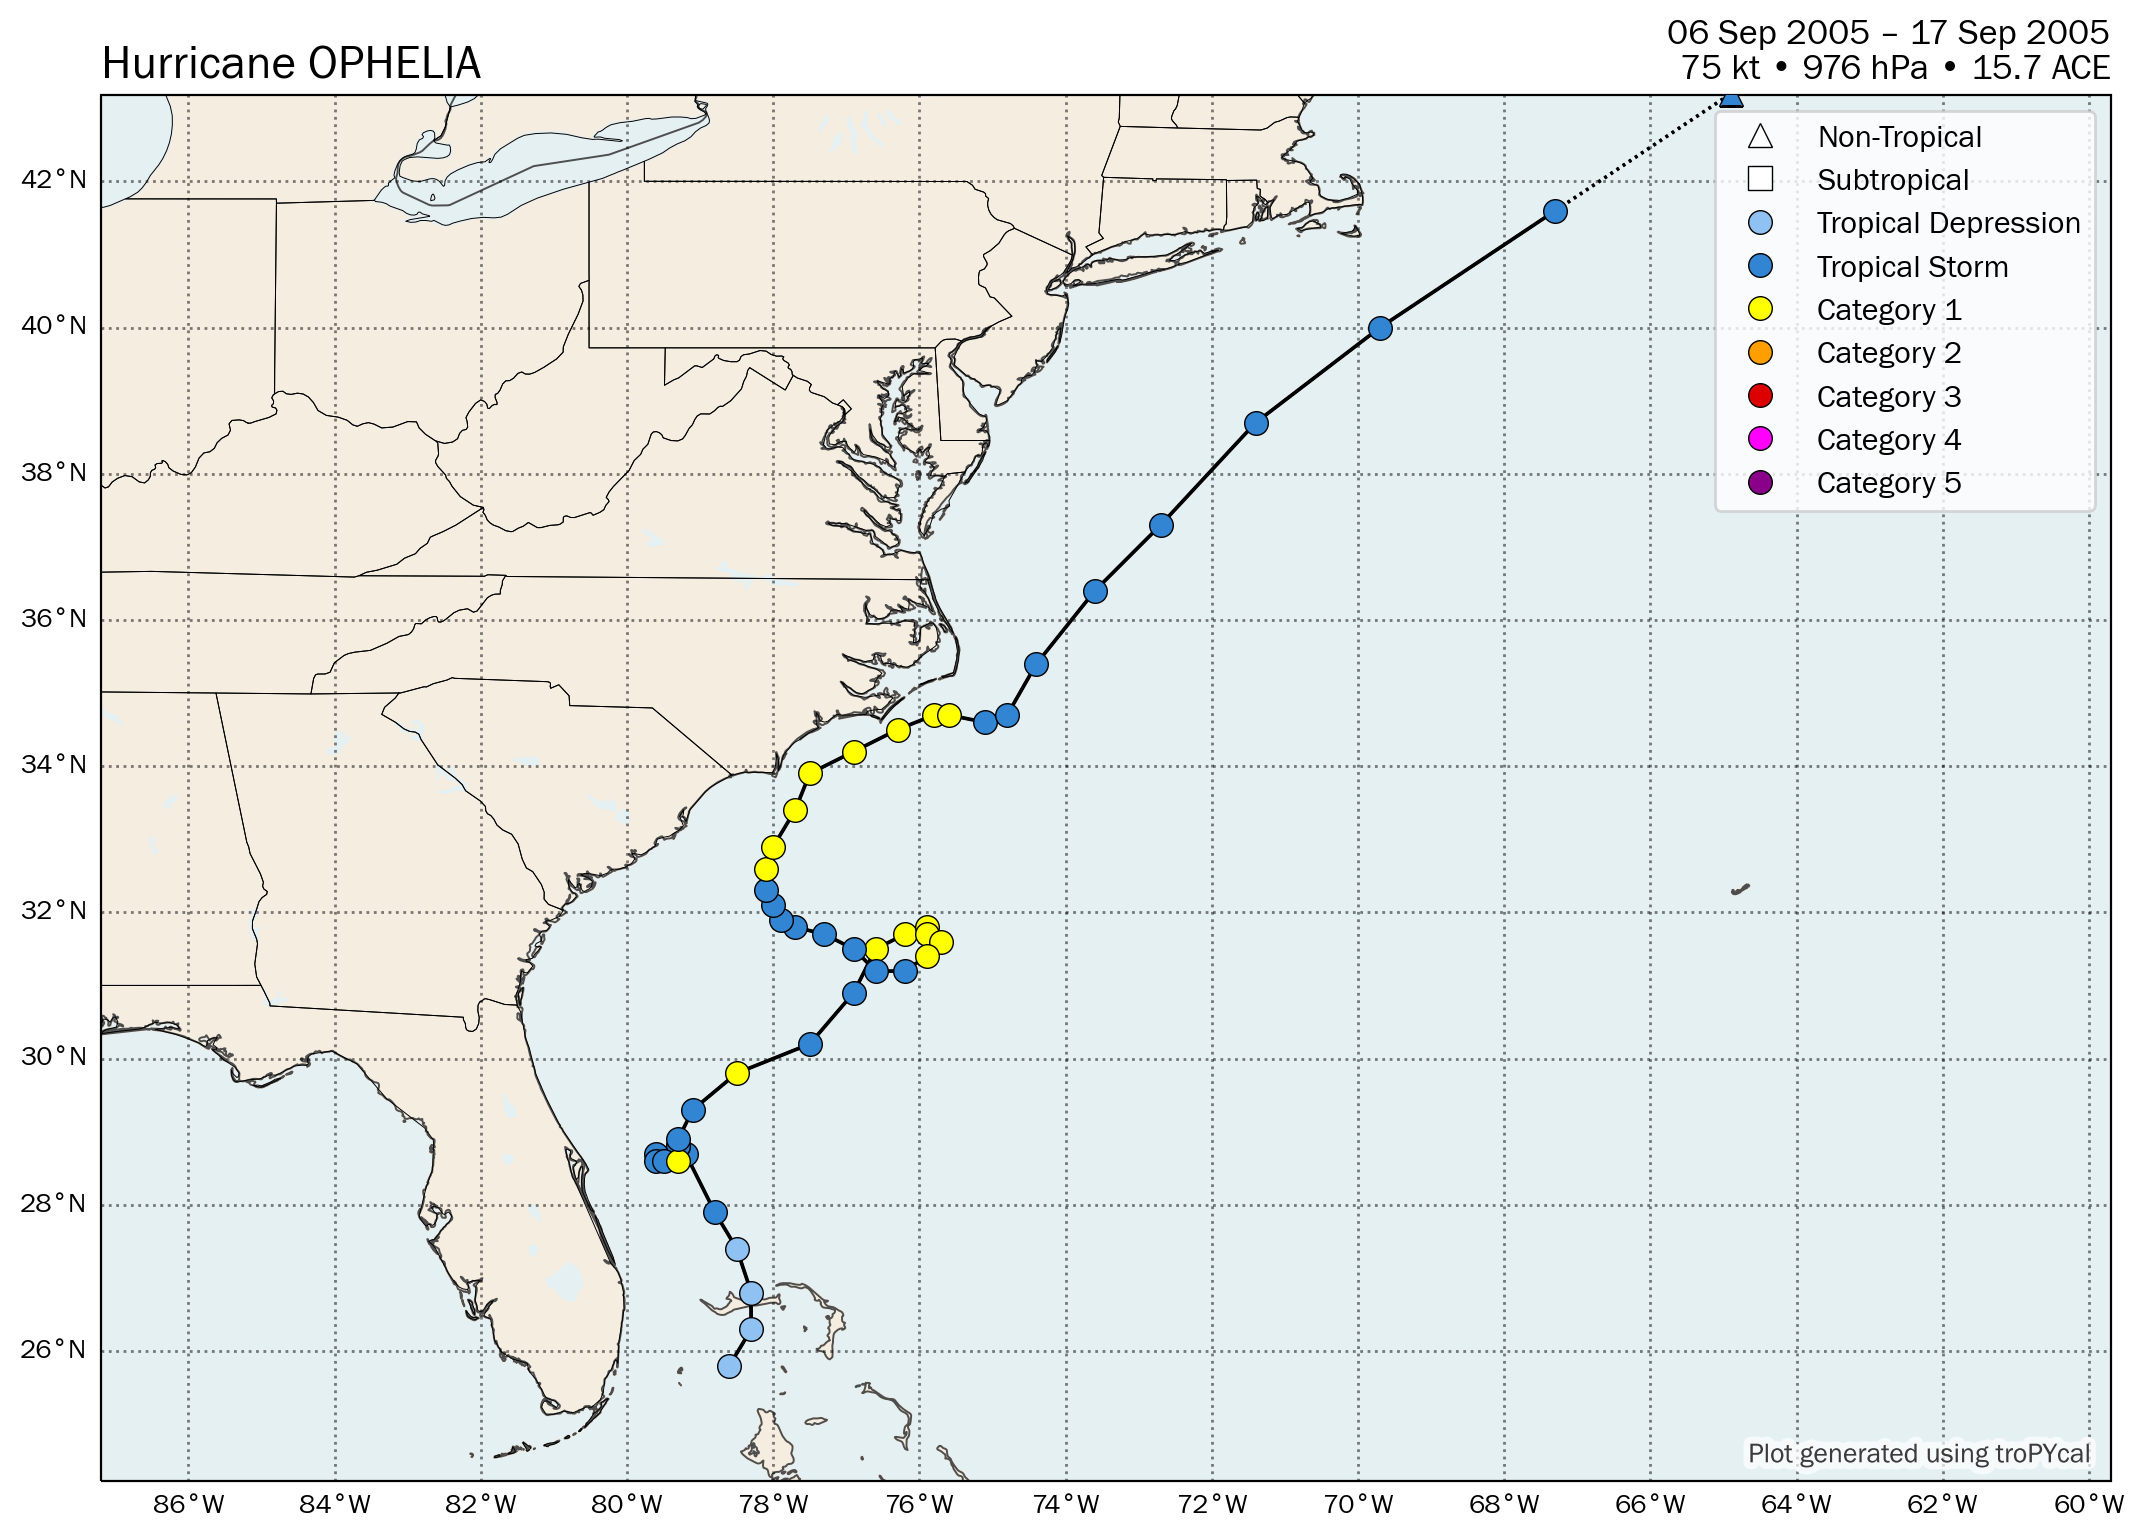
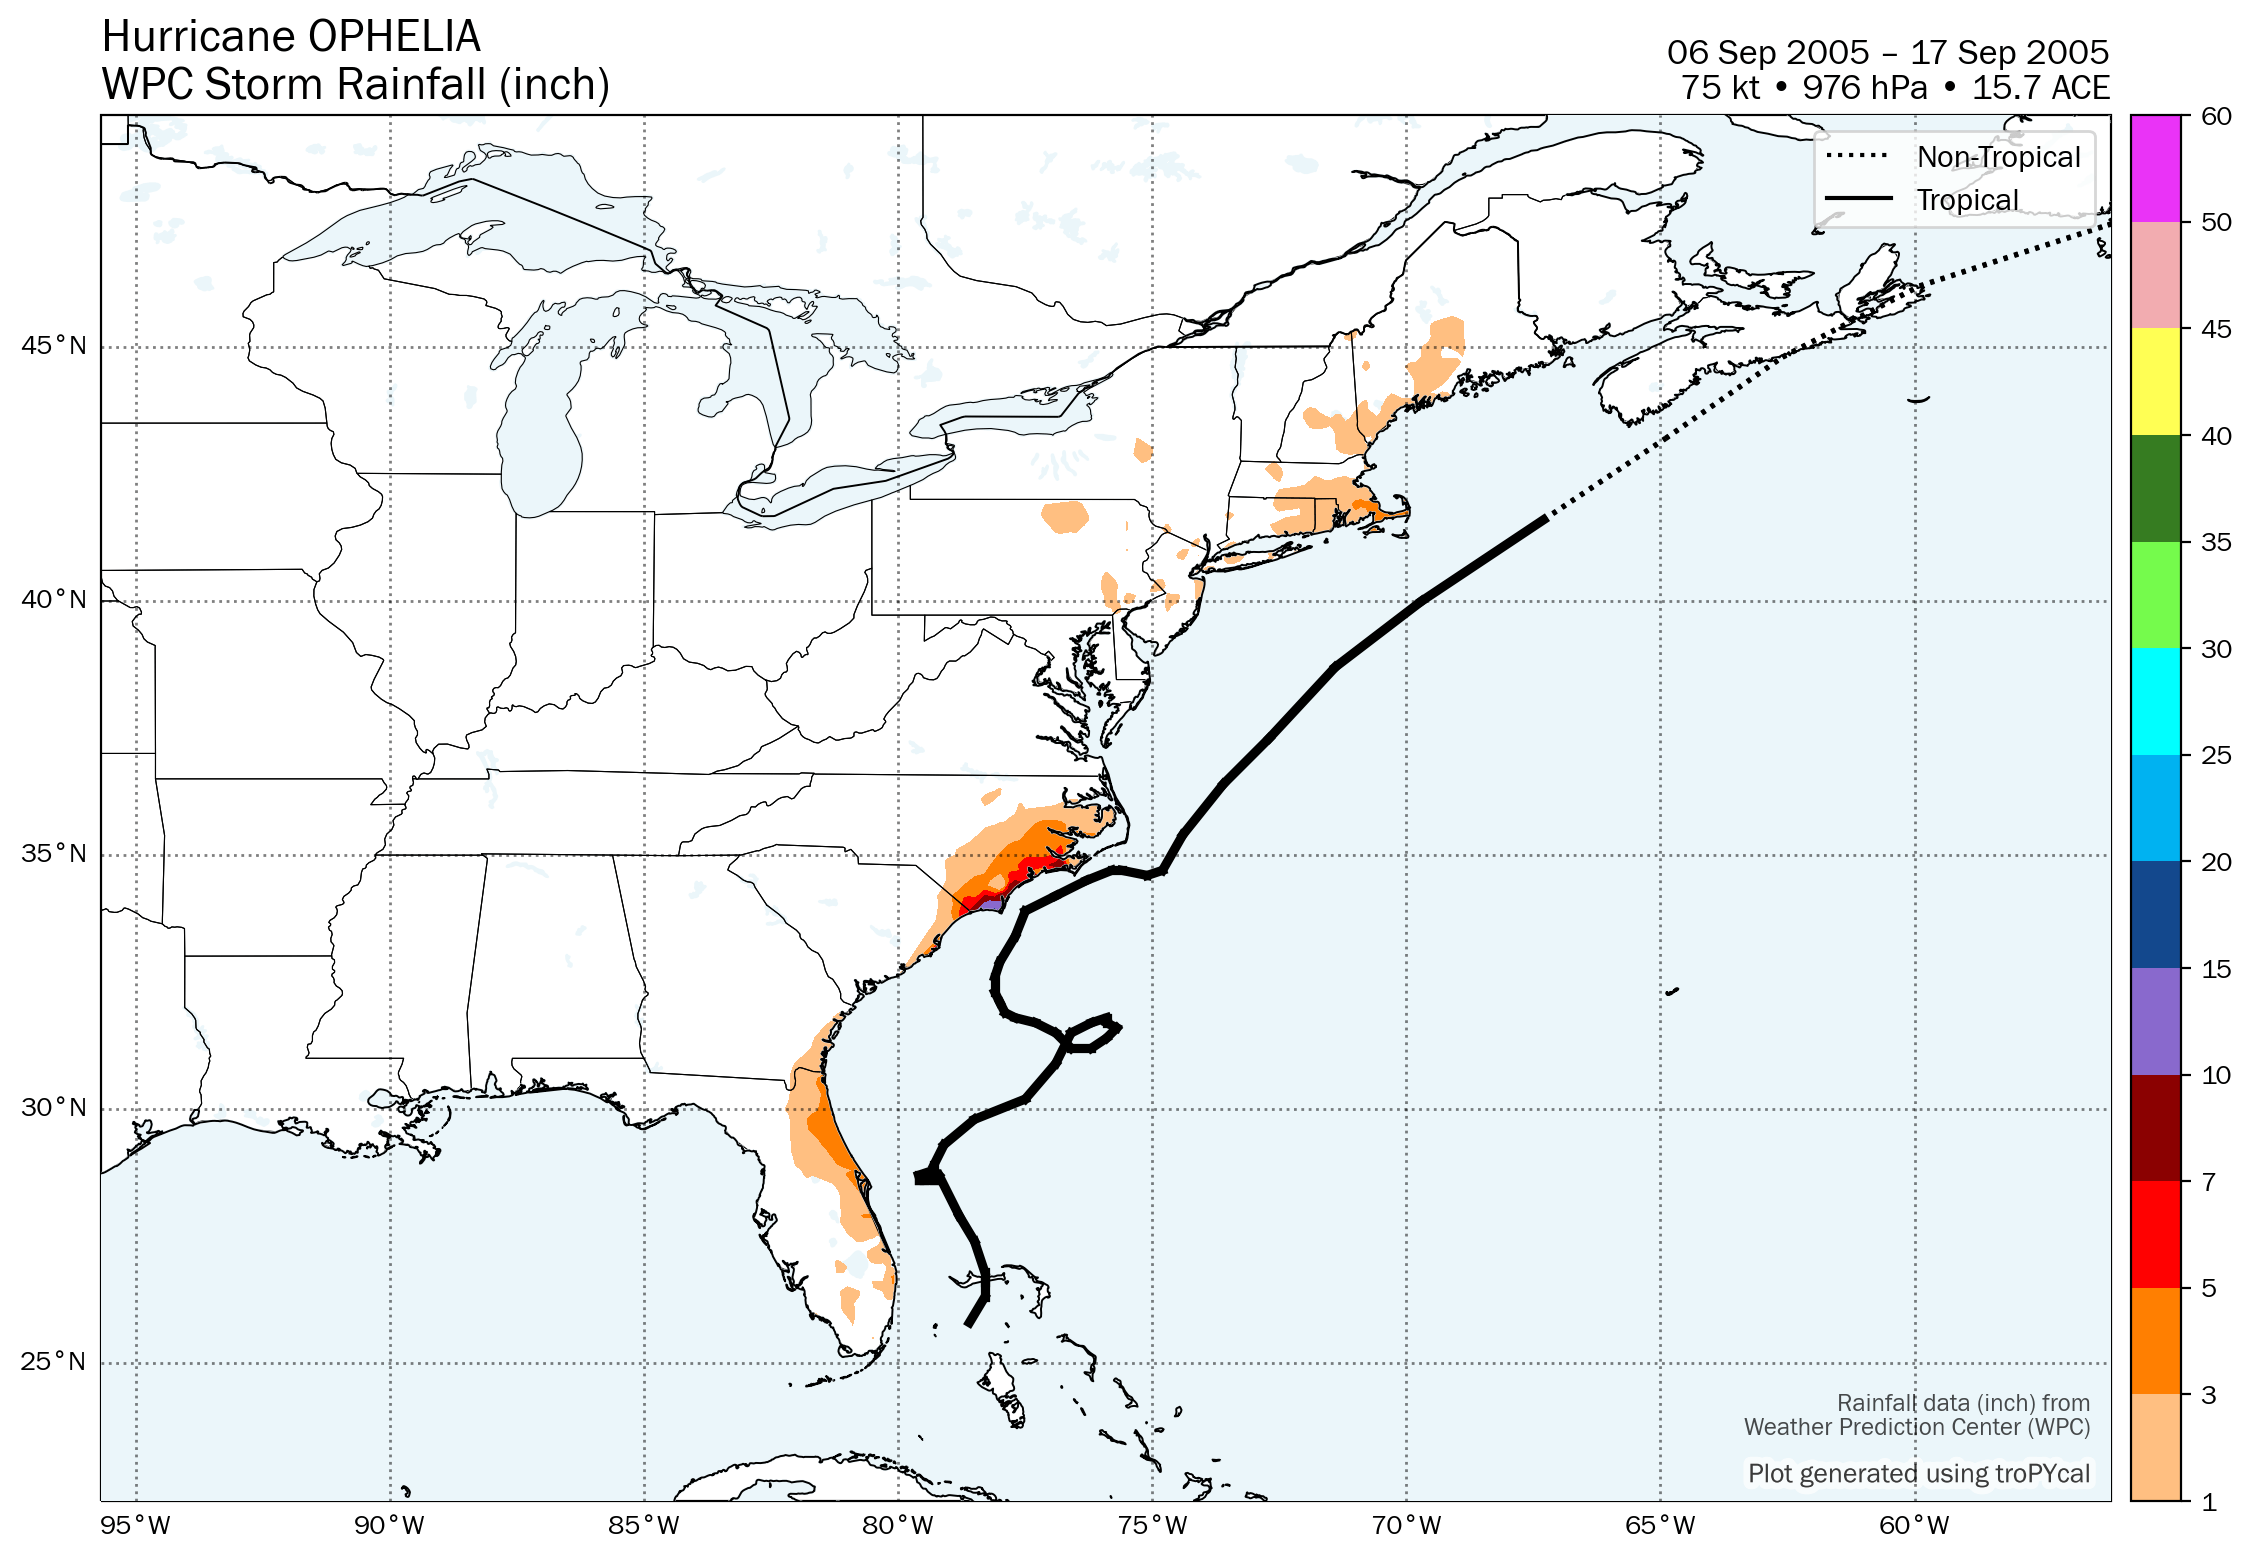
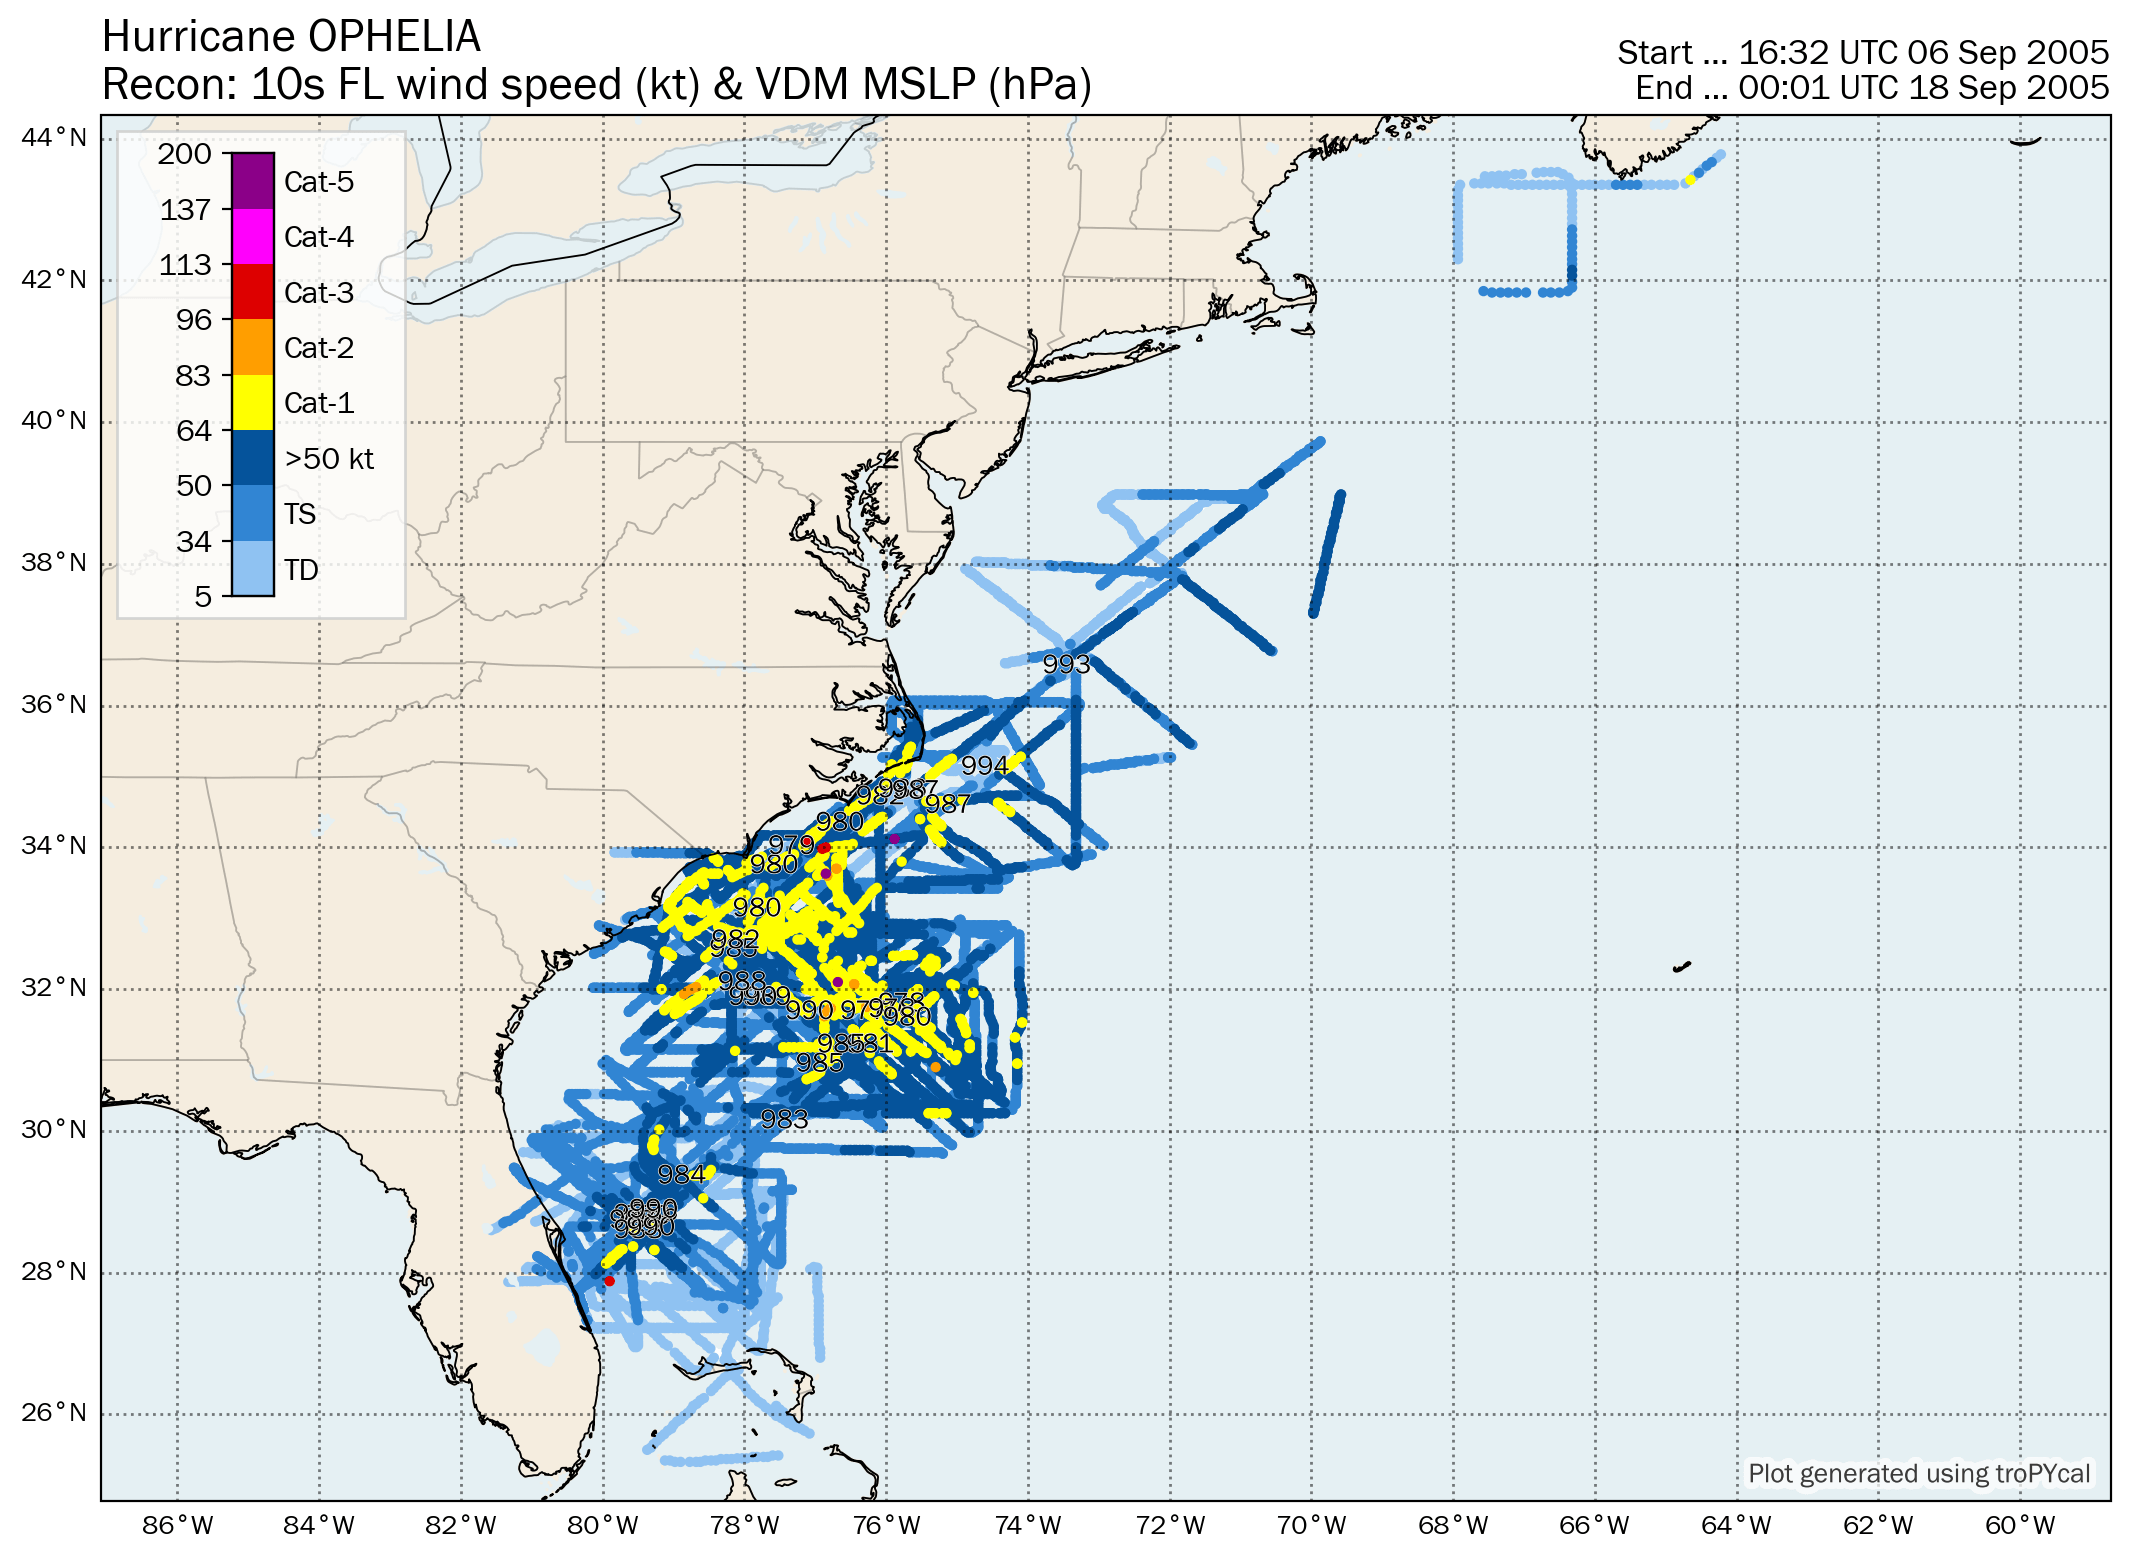
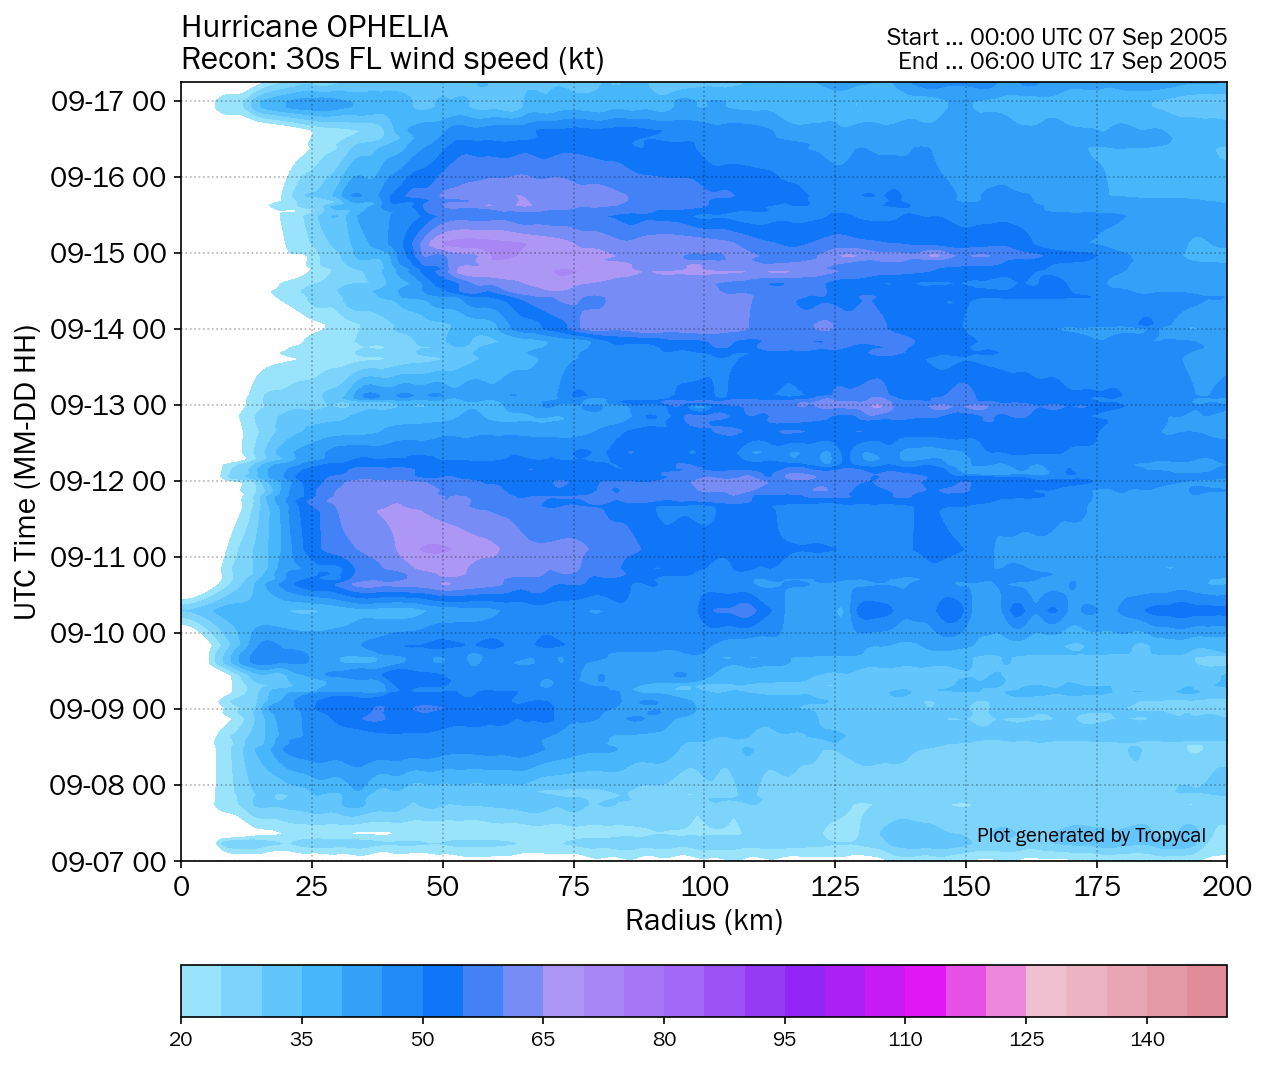
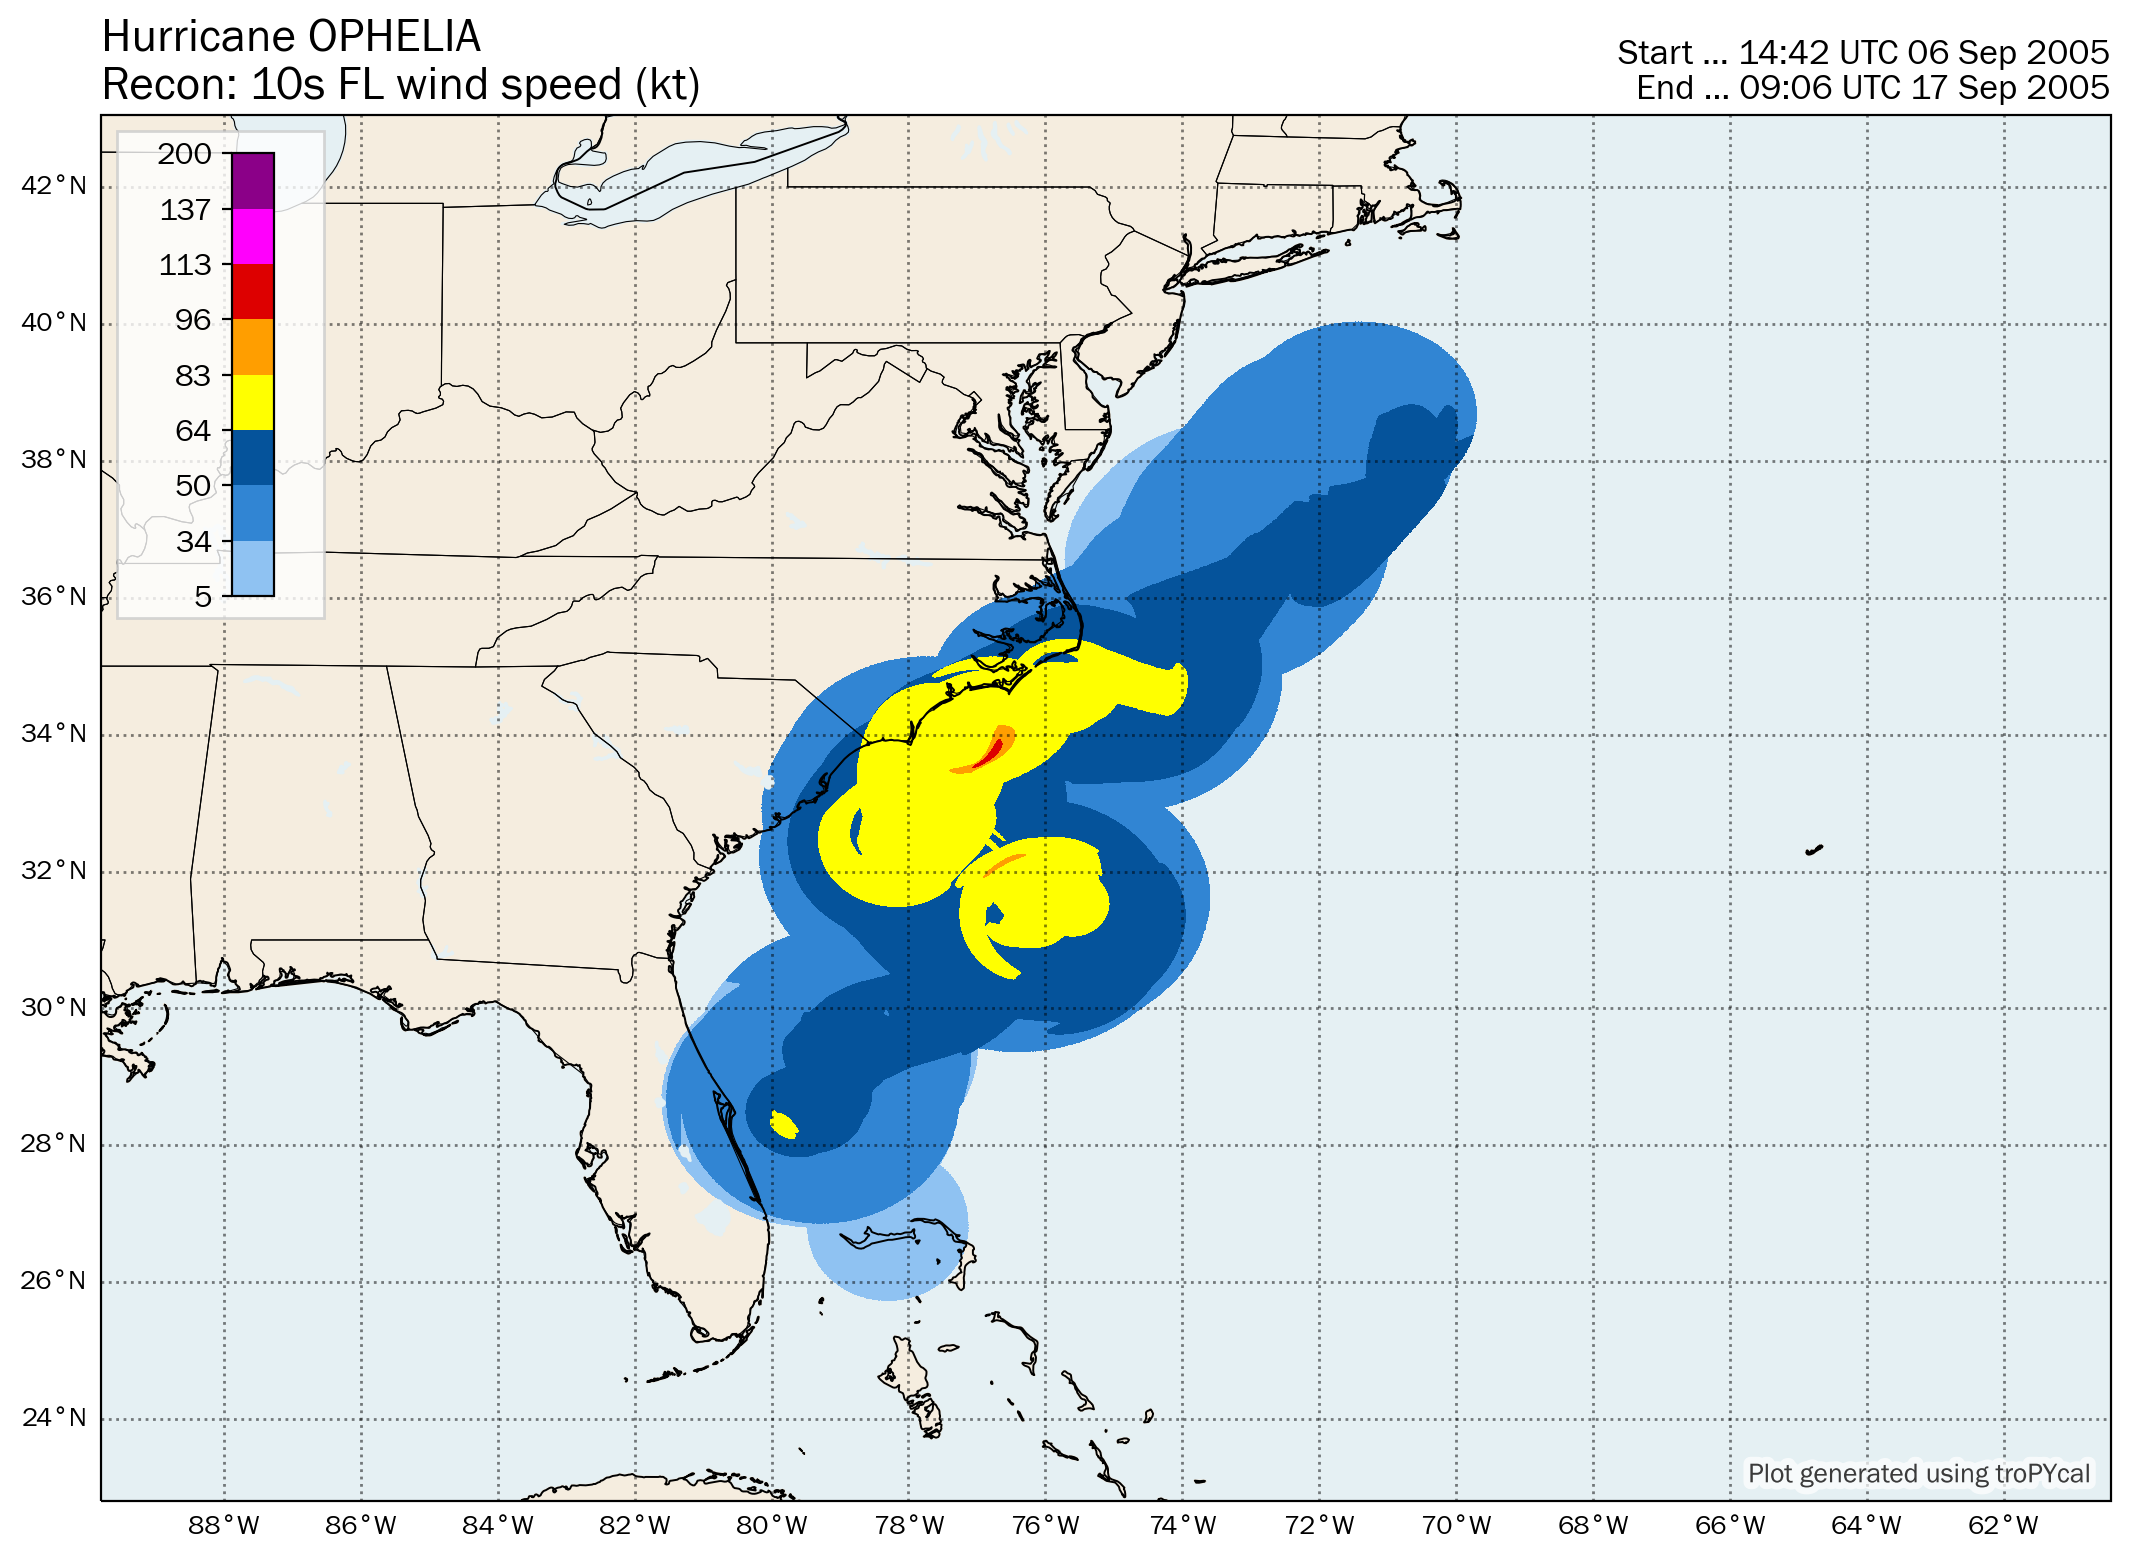
| 1 | Hurricane Ophelia | 75 kt | 976 hPa | 06z 09/06 | 18z 09/17 | 15.7 |
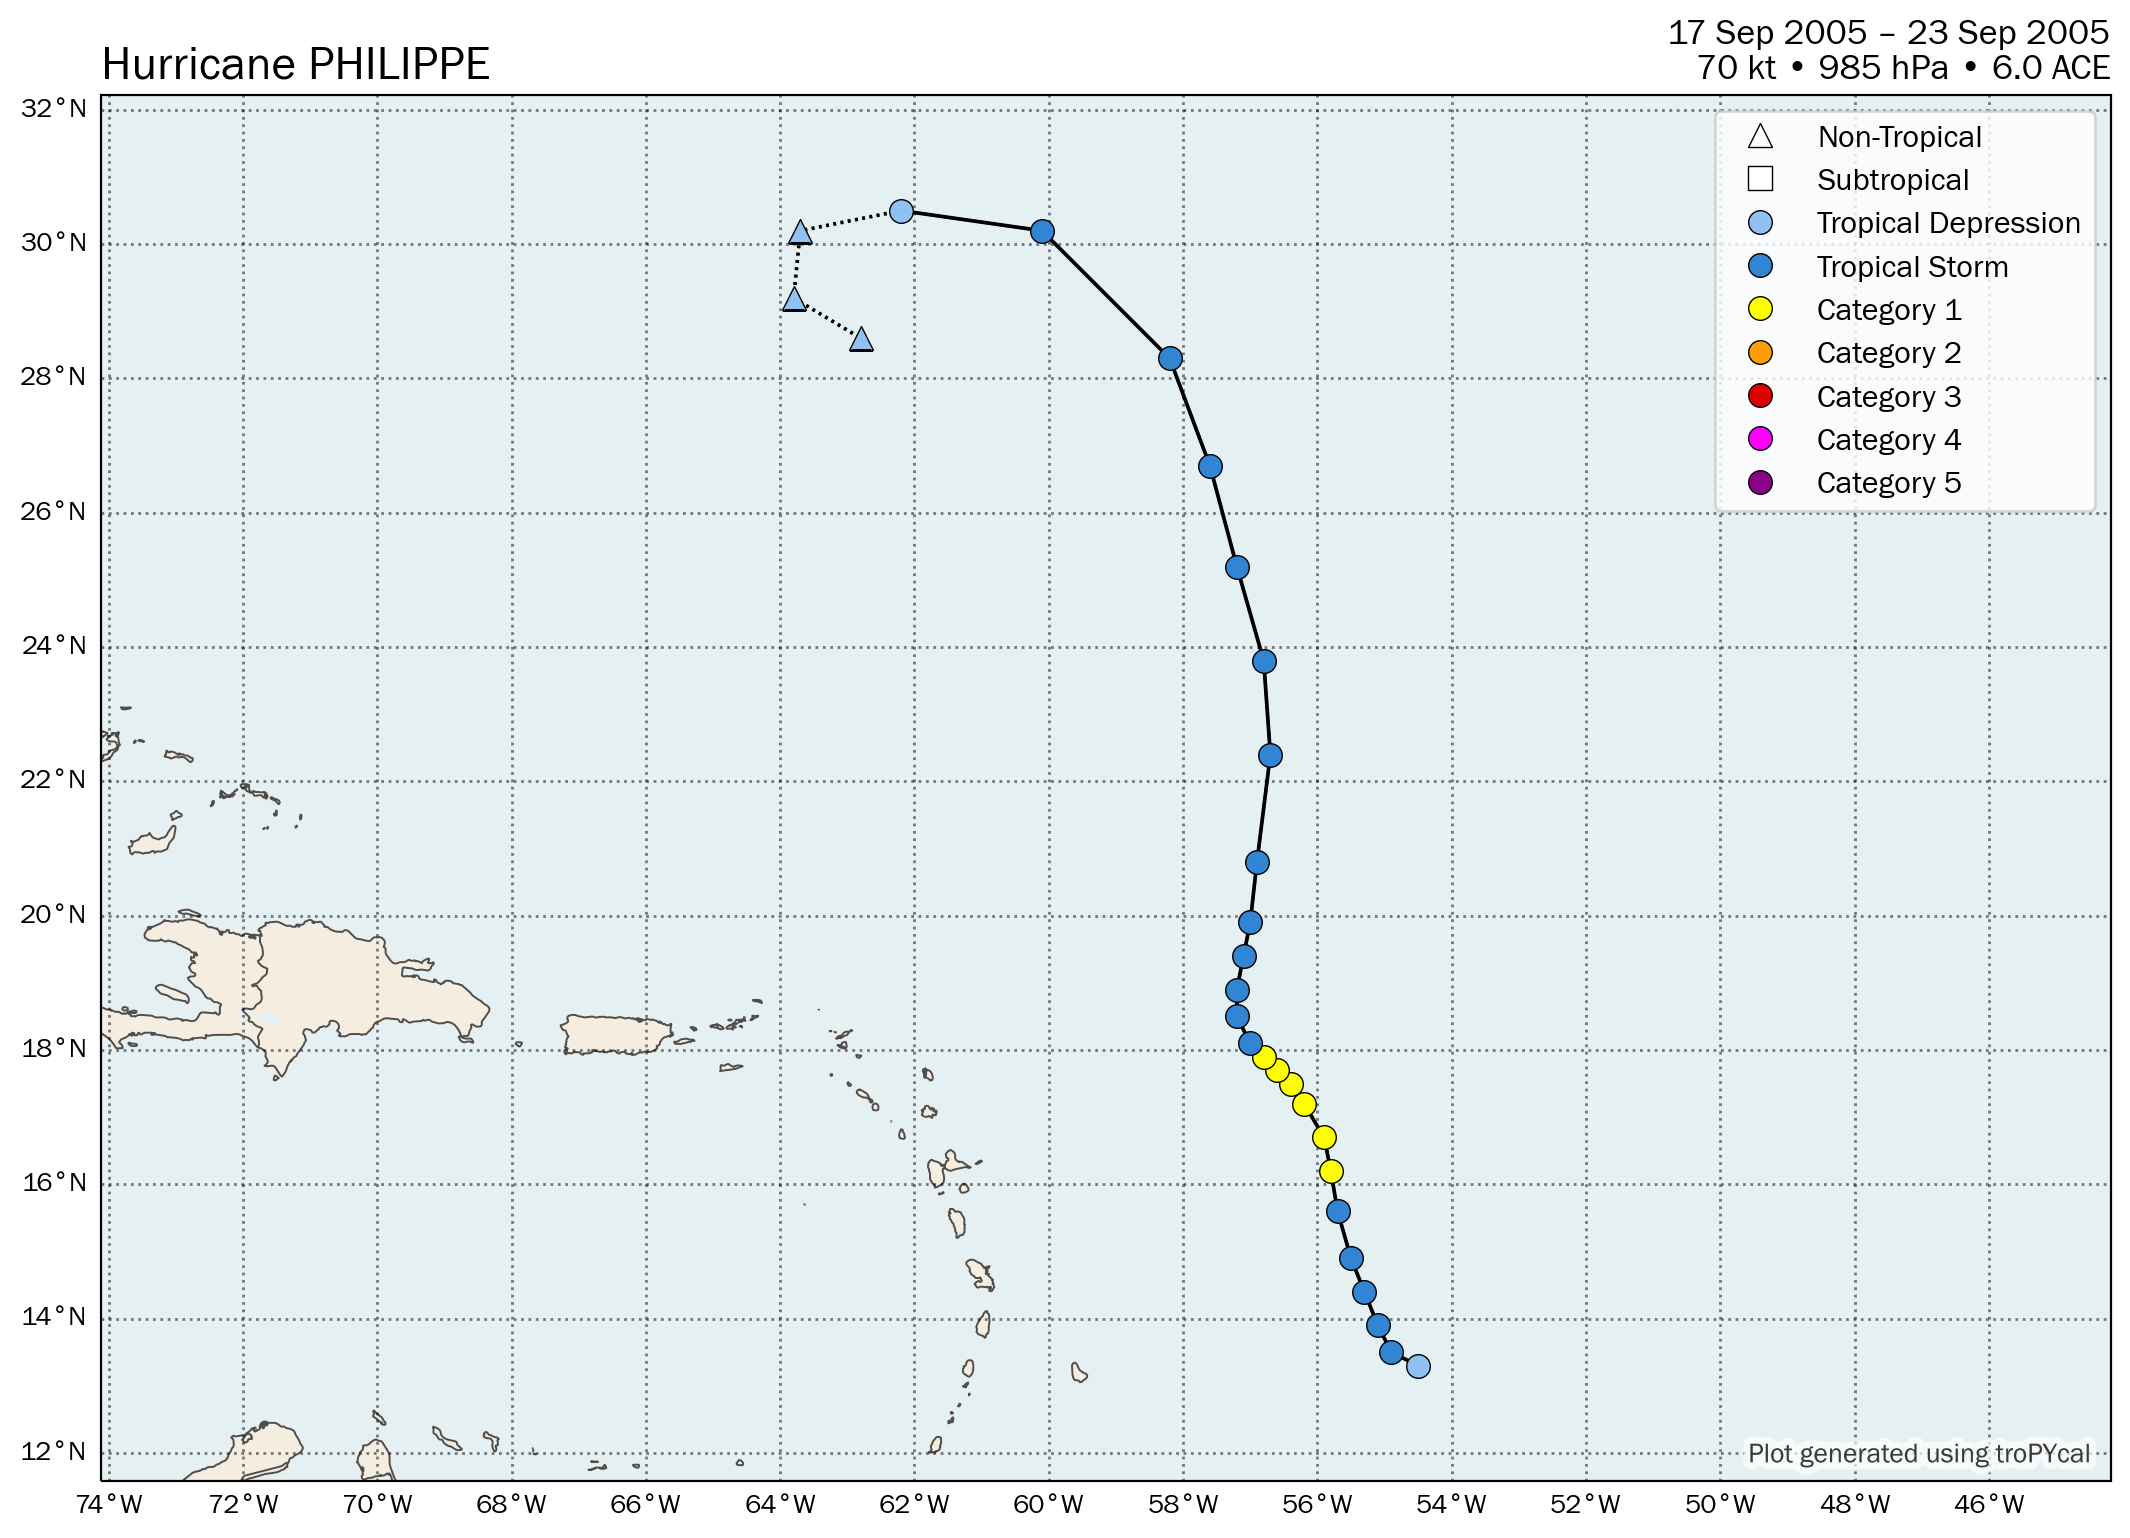
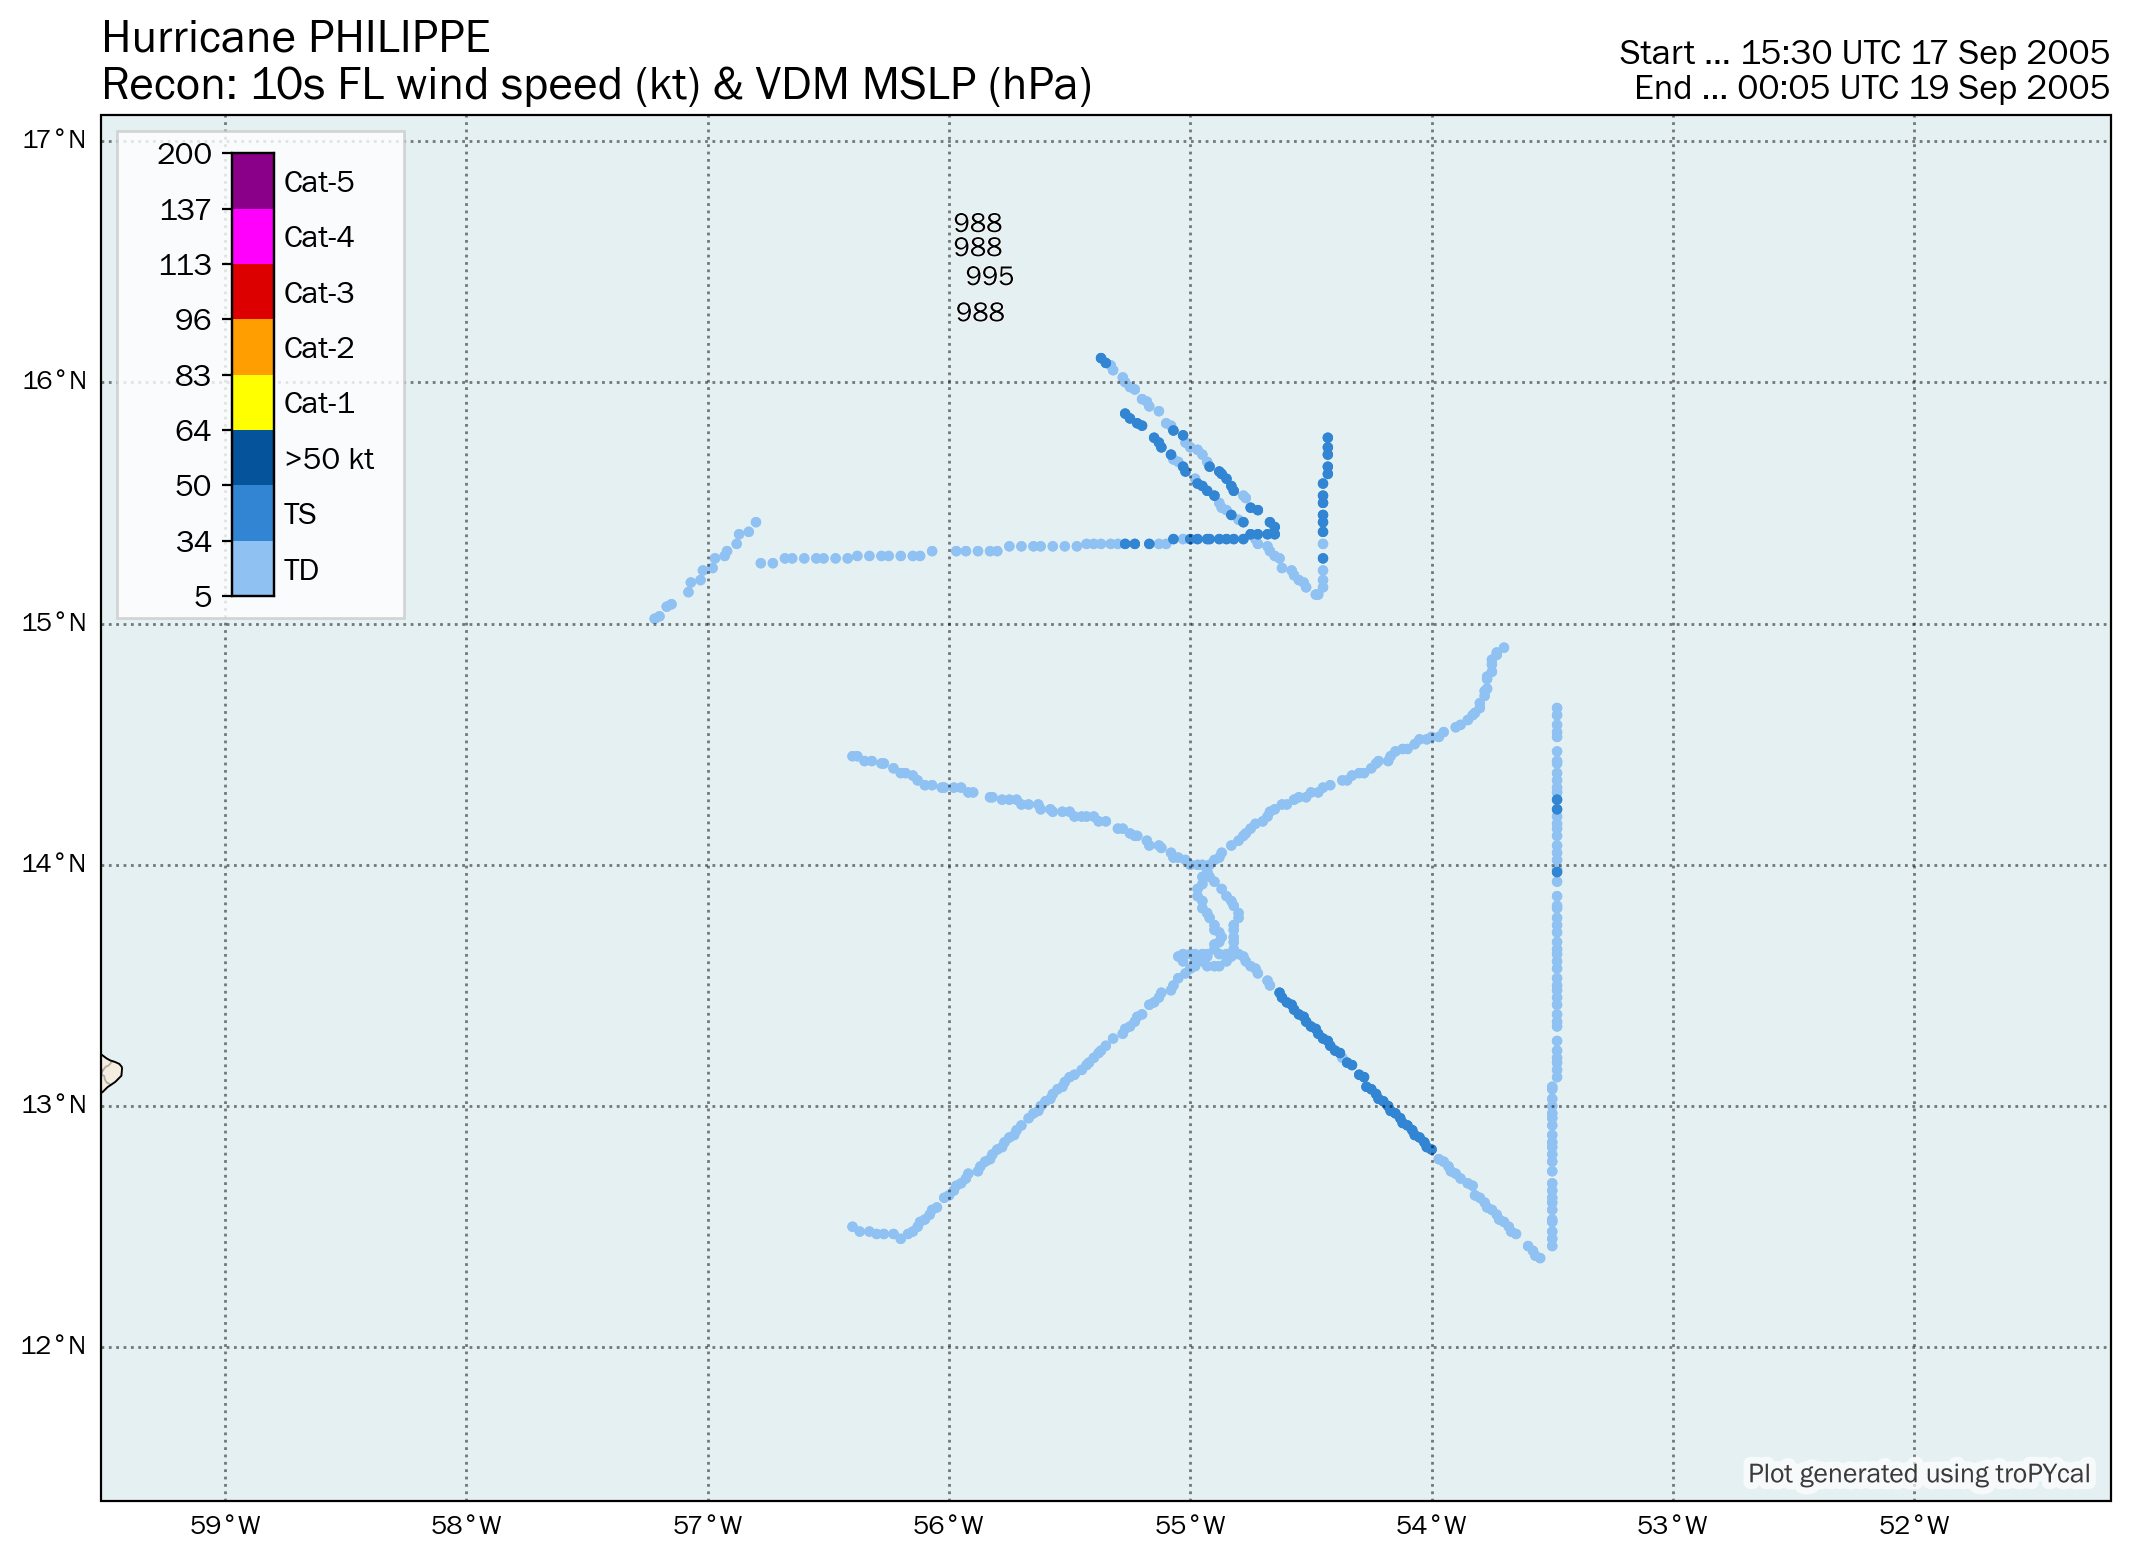
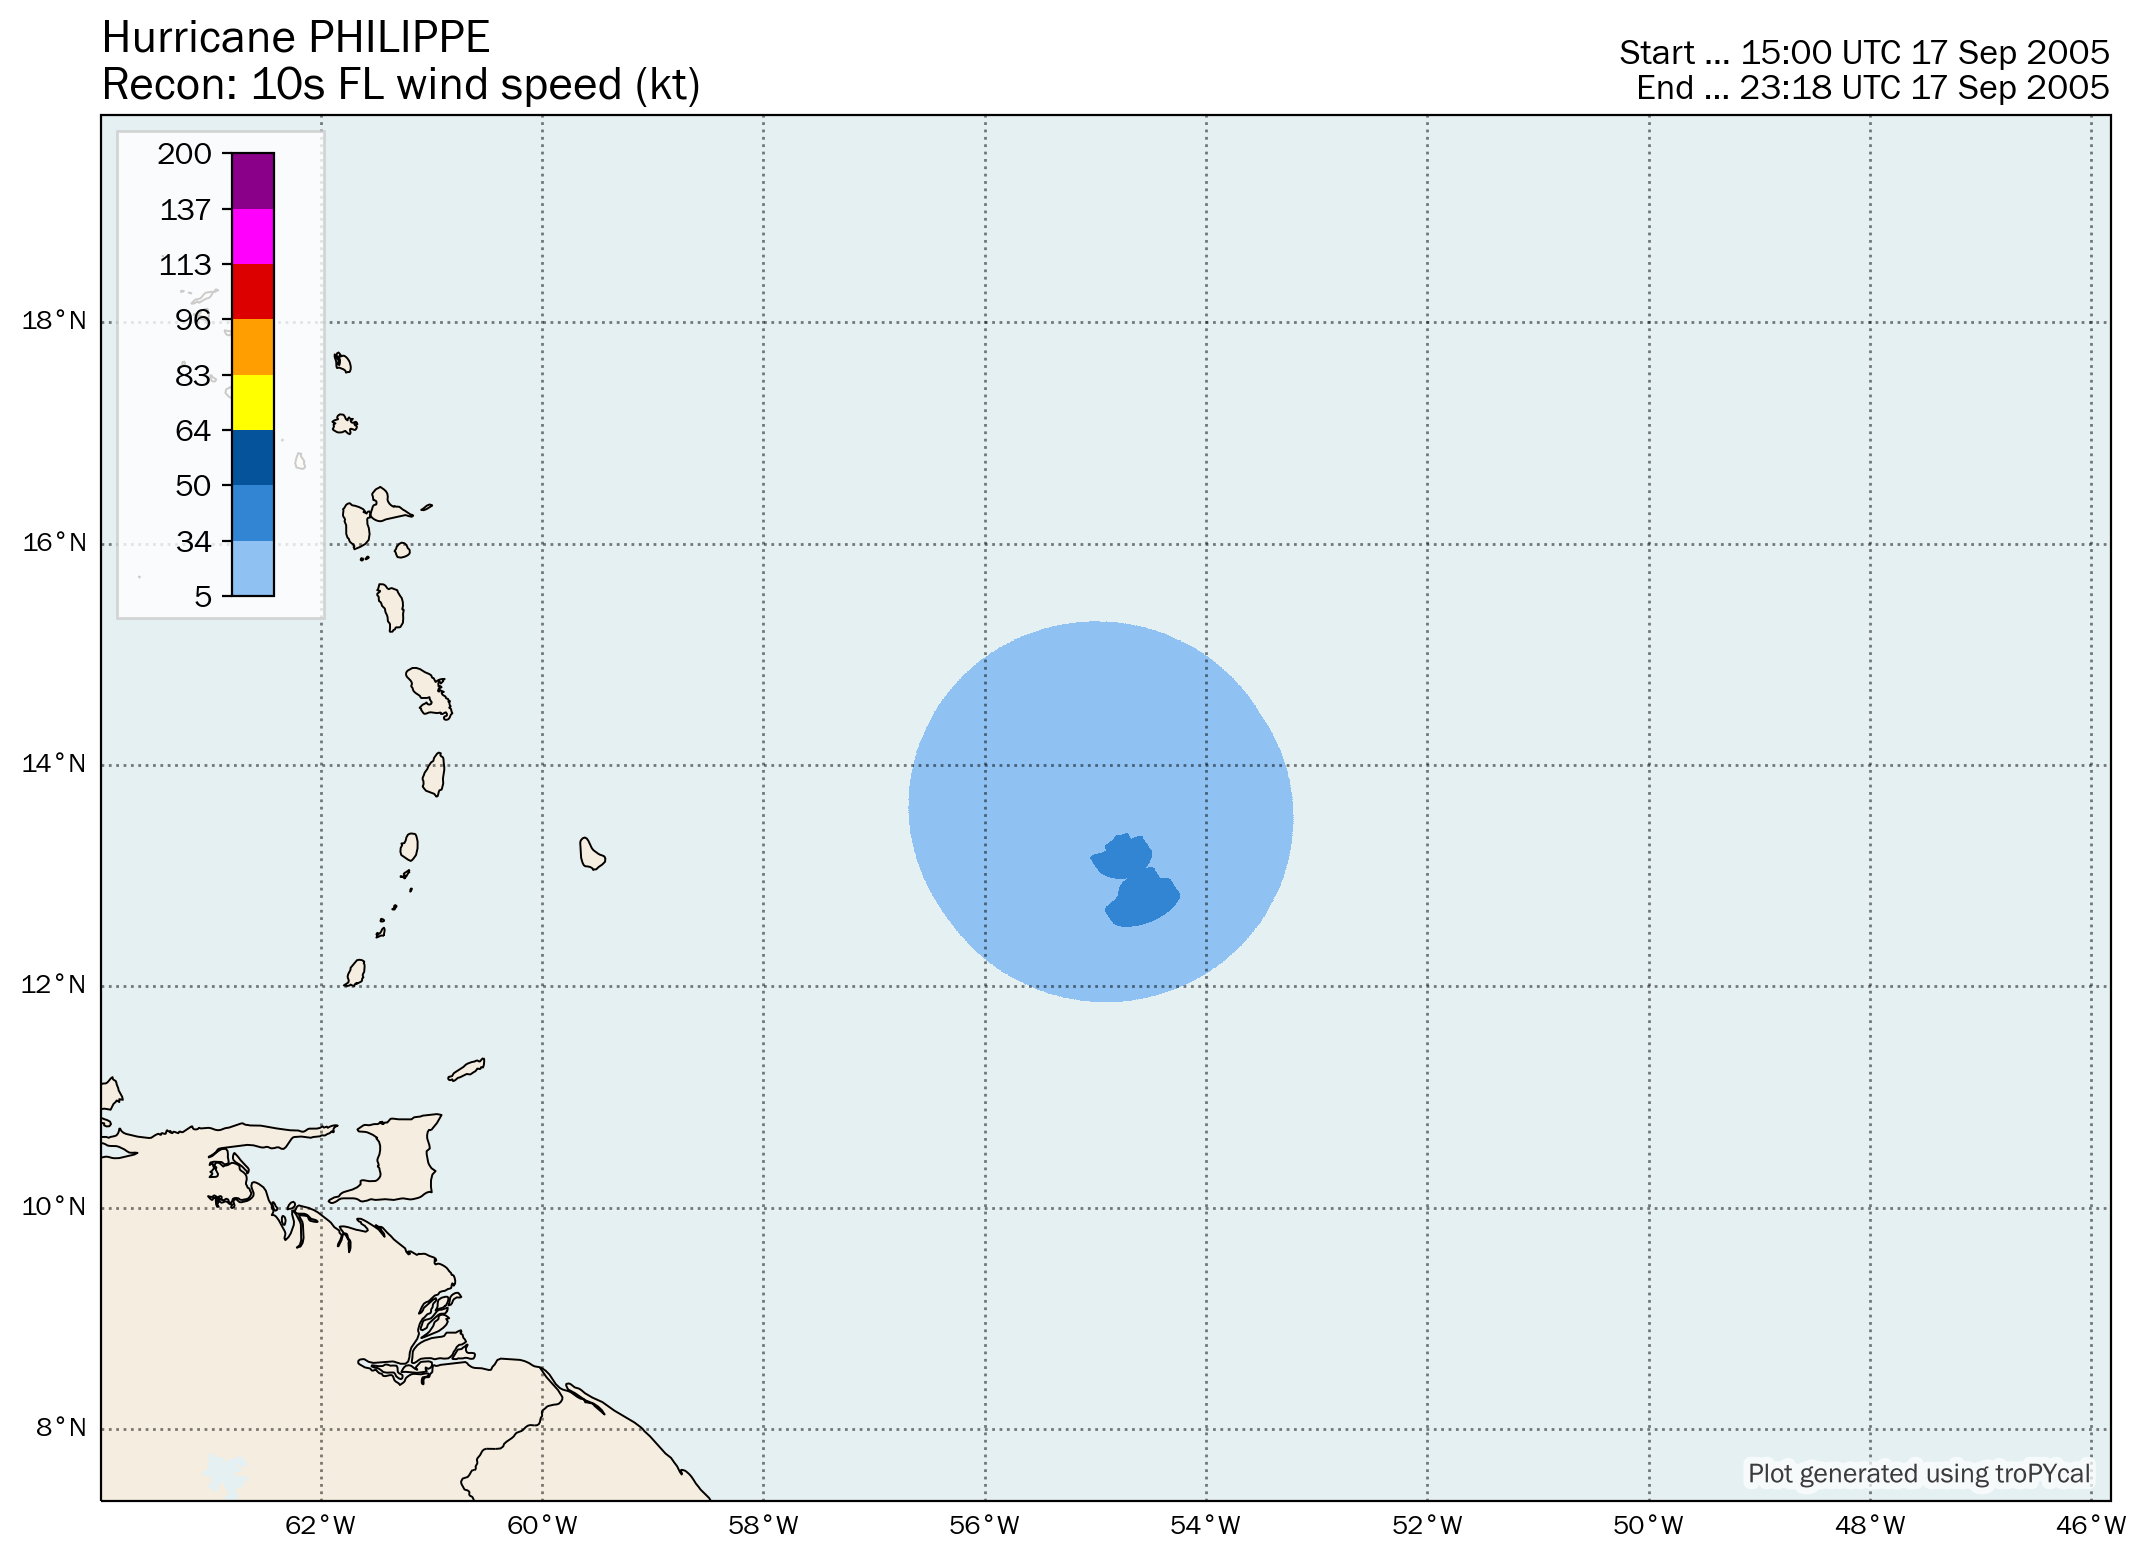
| 1 | Hurricane Philippe | 70 kt | 985 hPa | 12z 09/17 | 12z 09/23 | 6.0 |
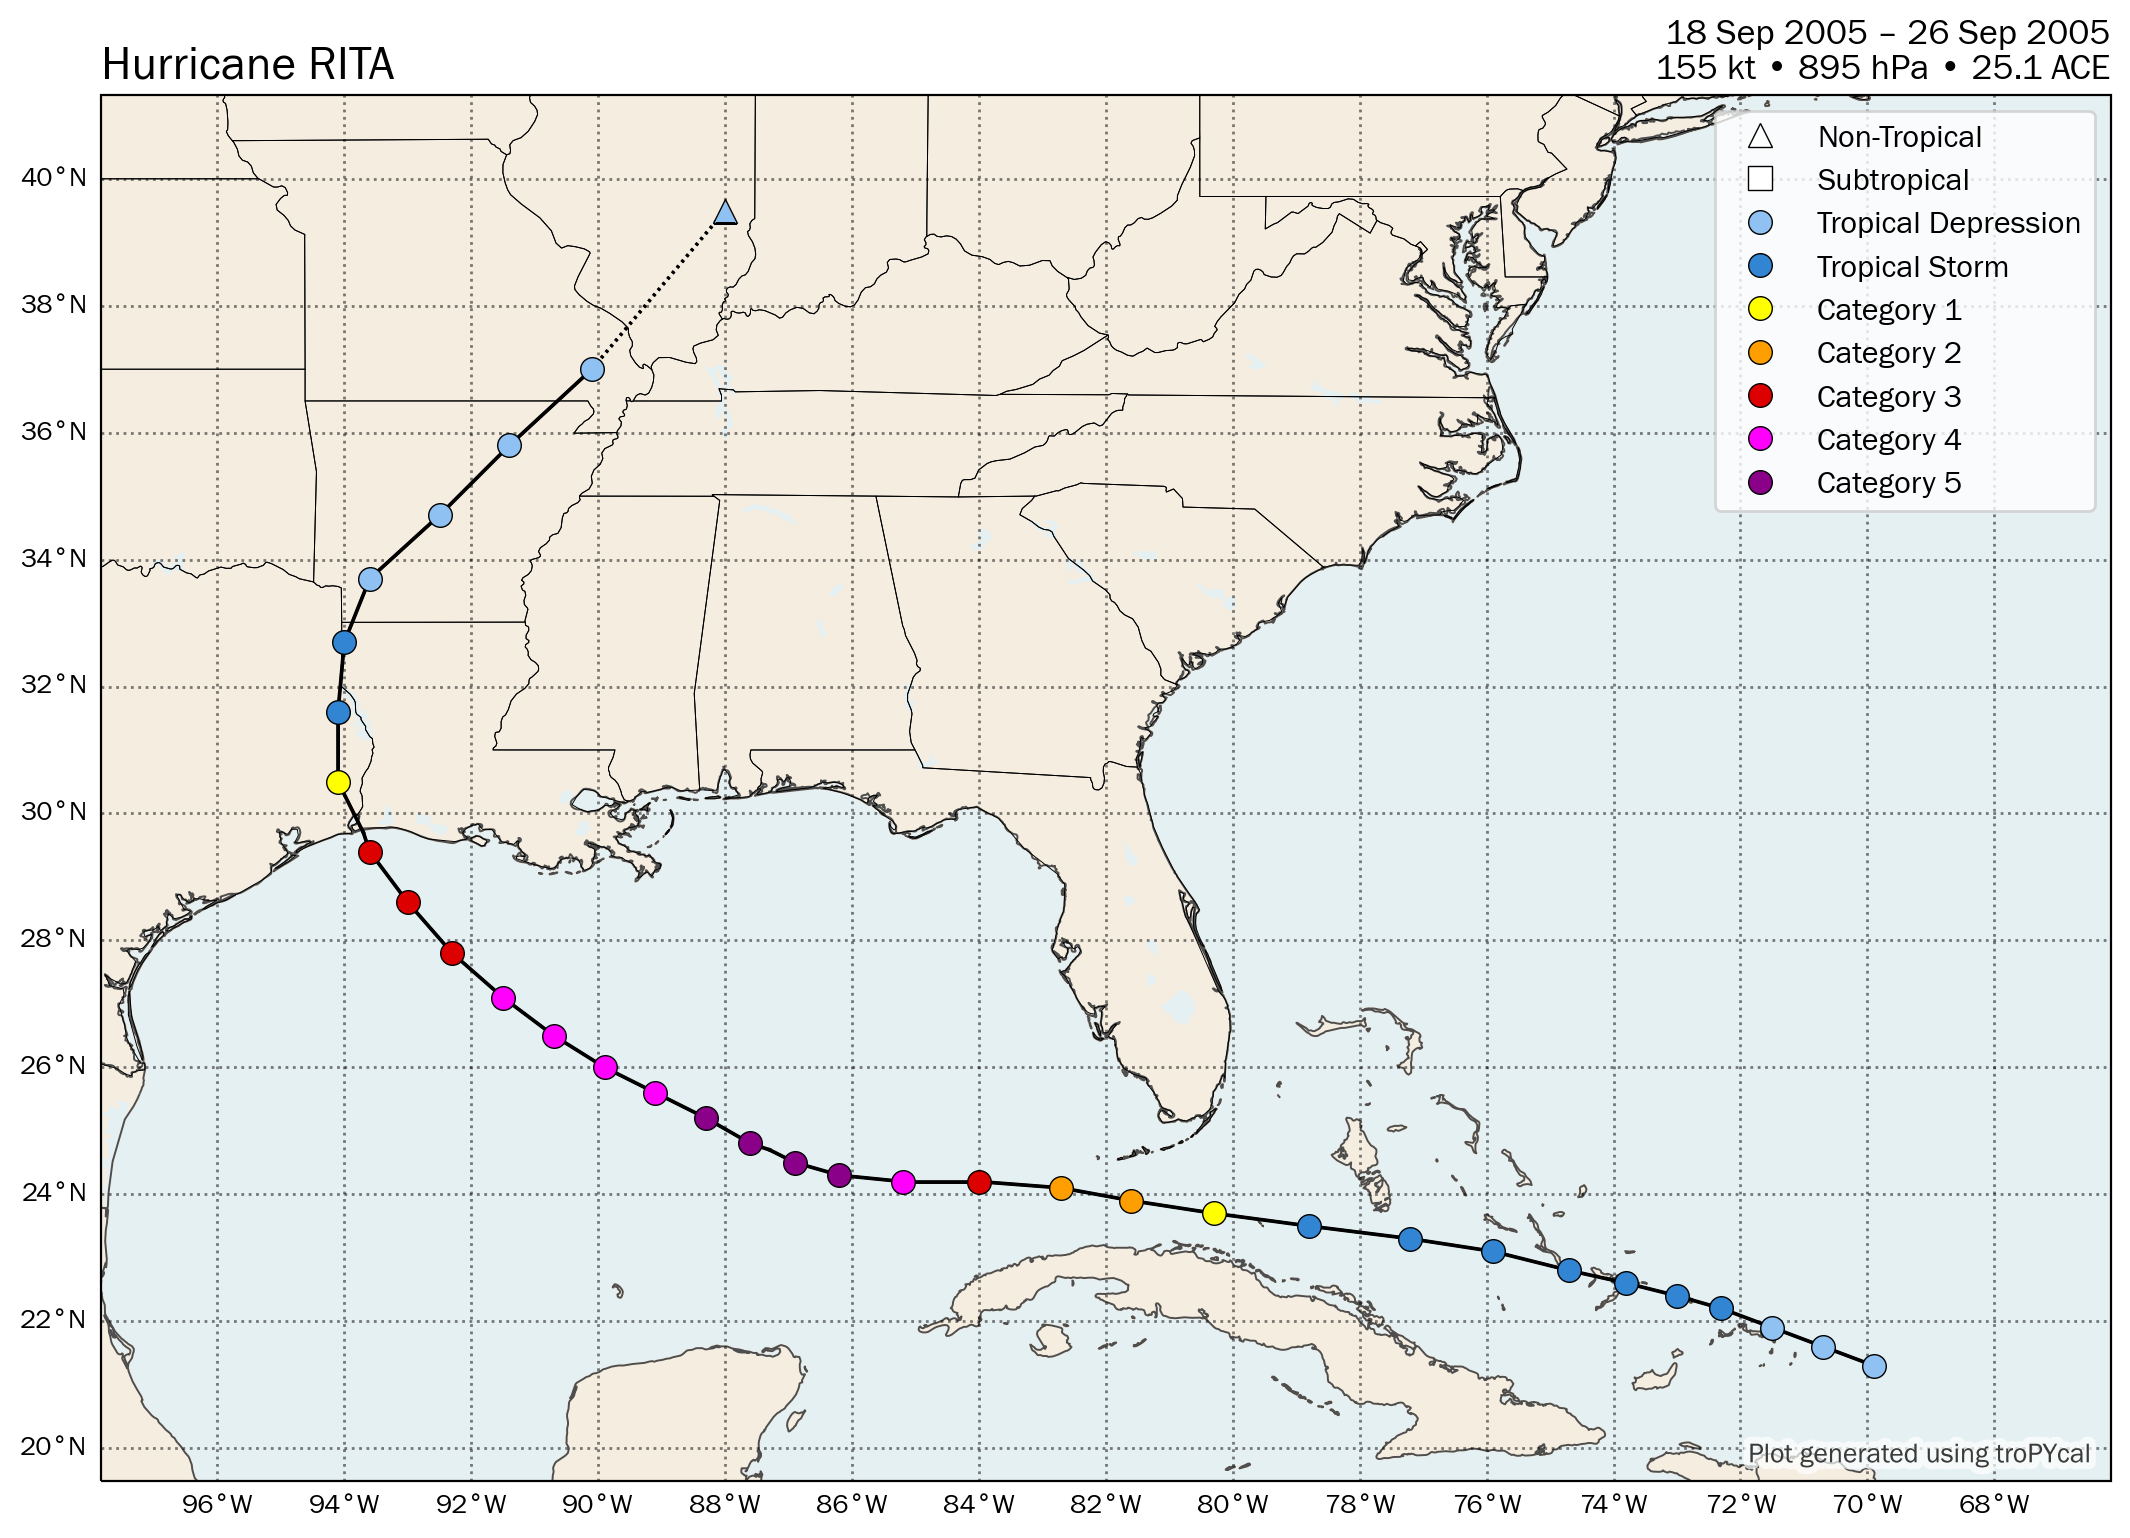
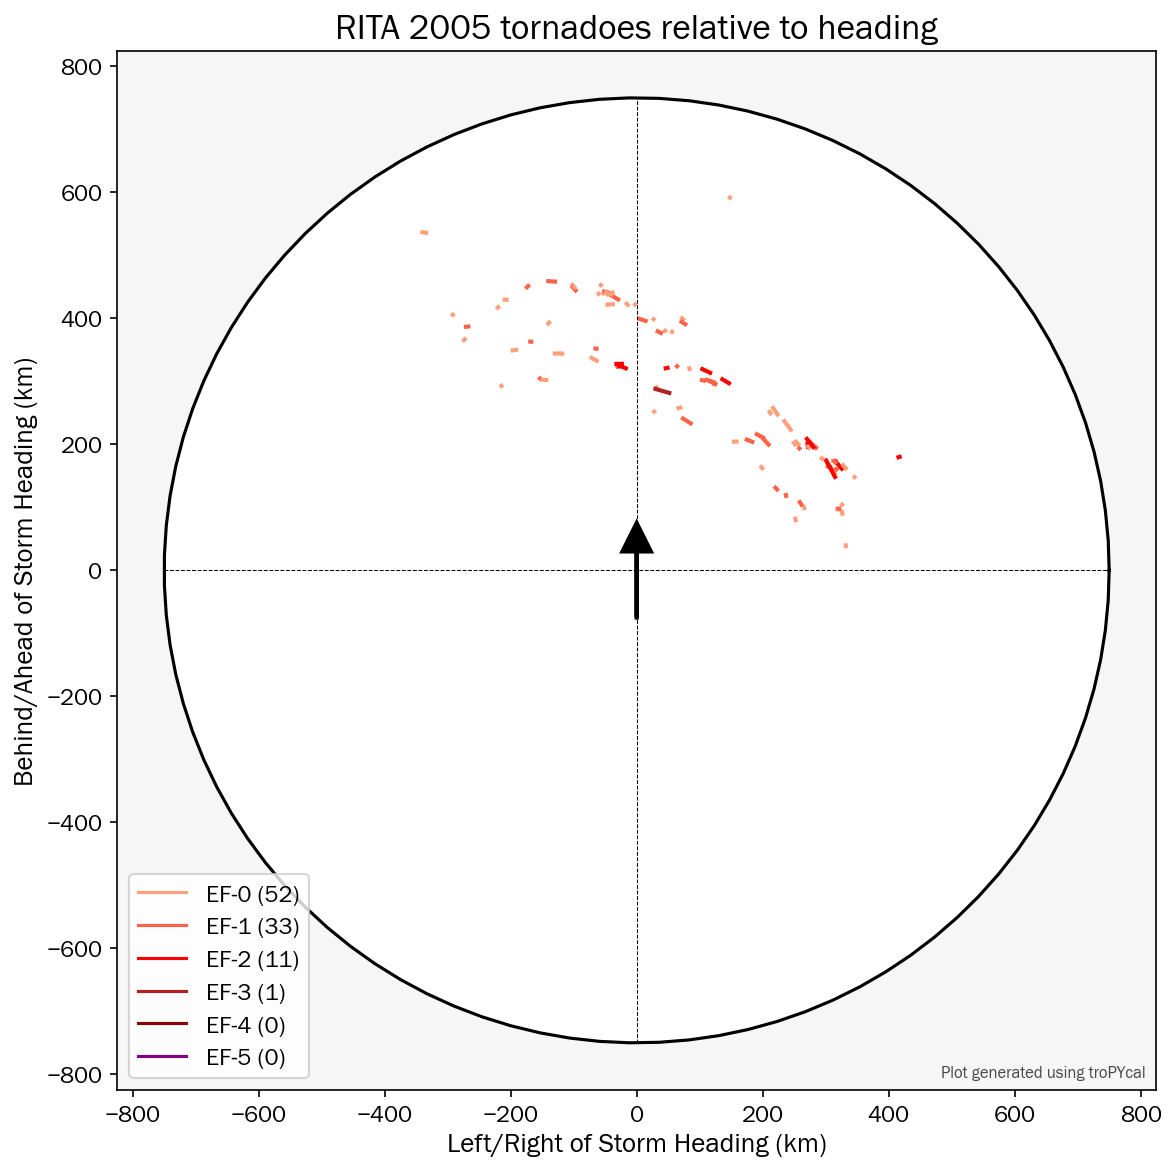
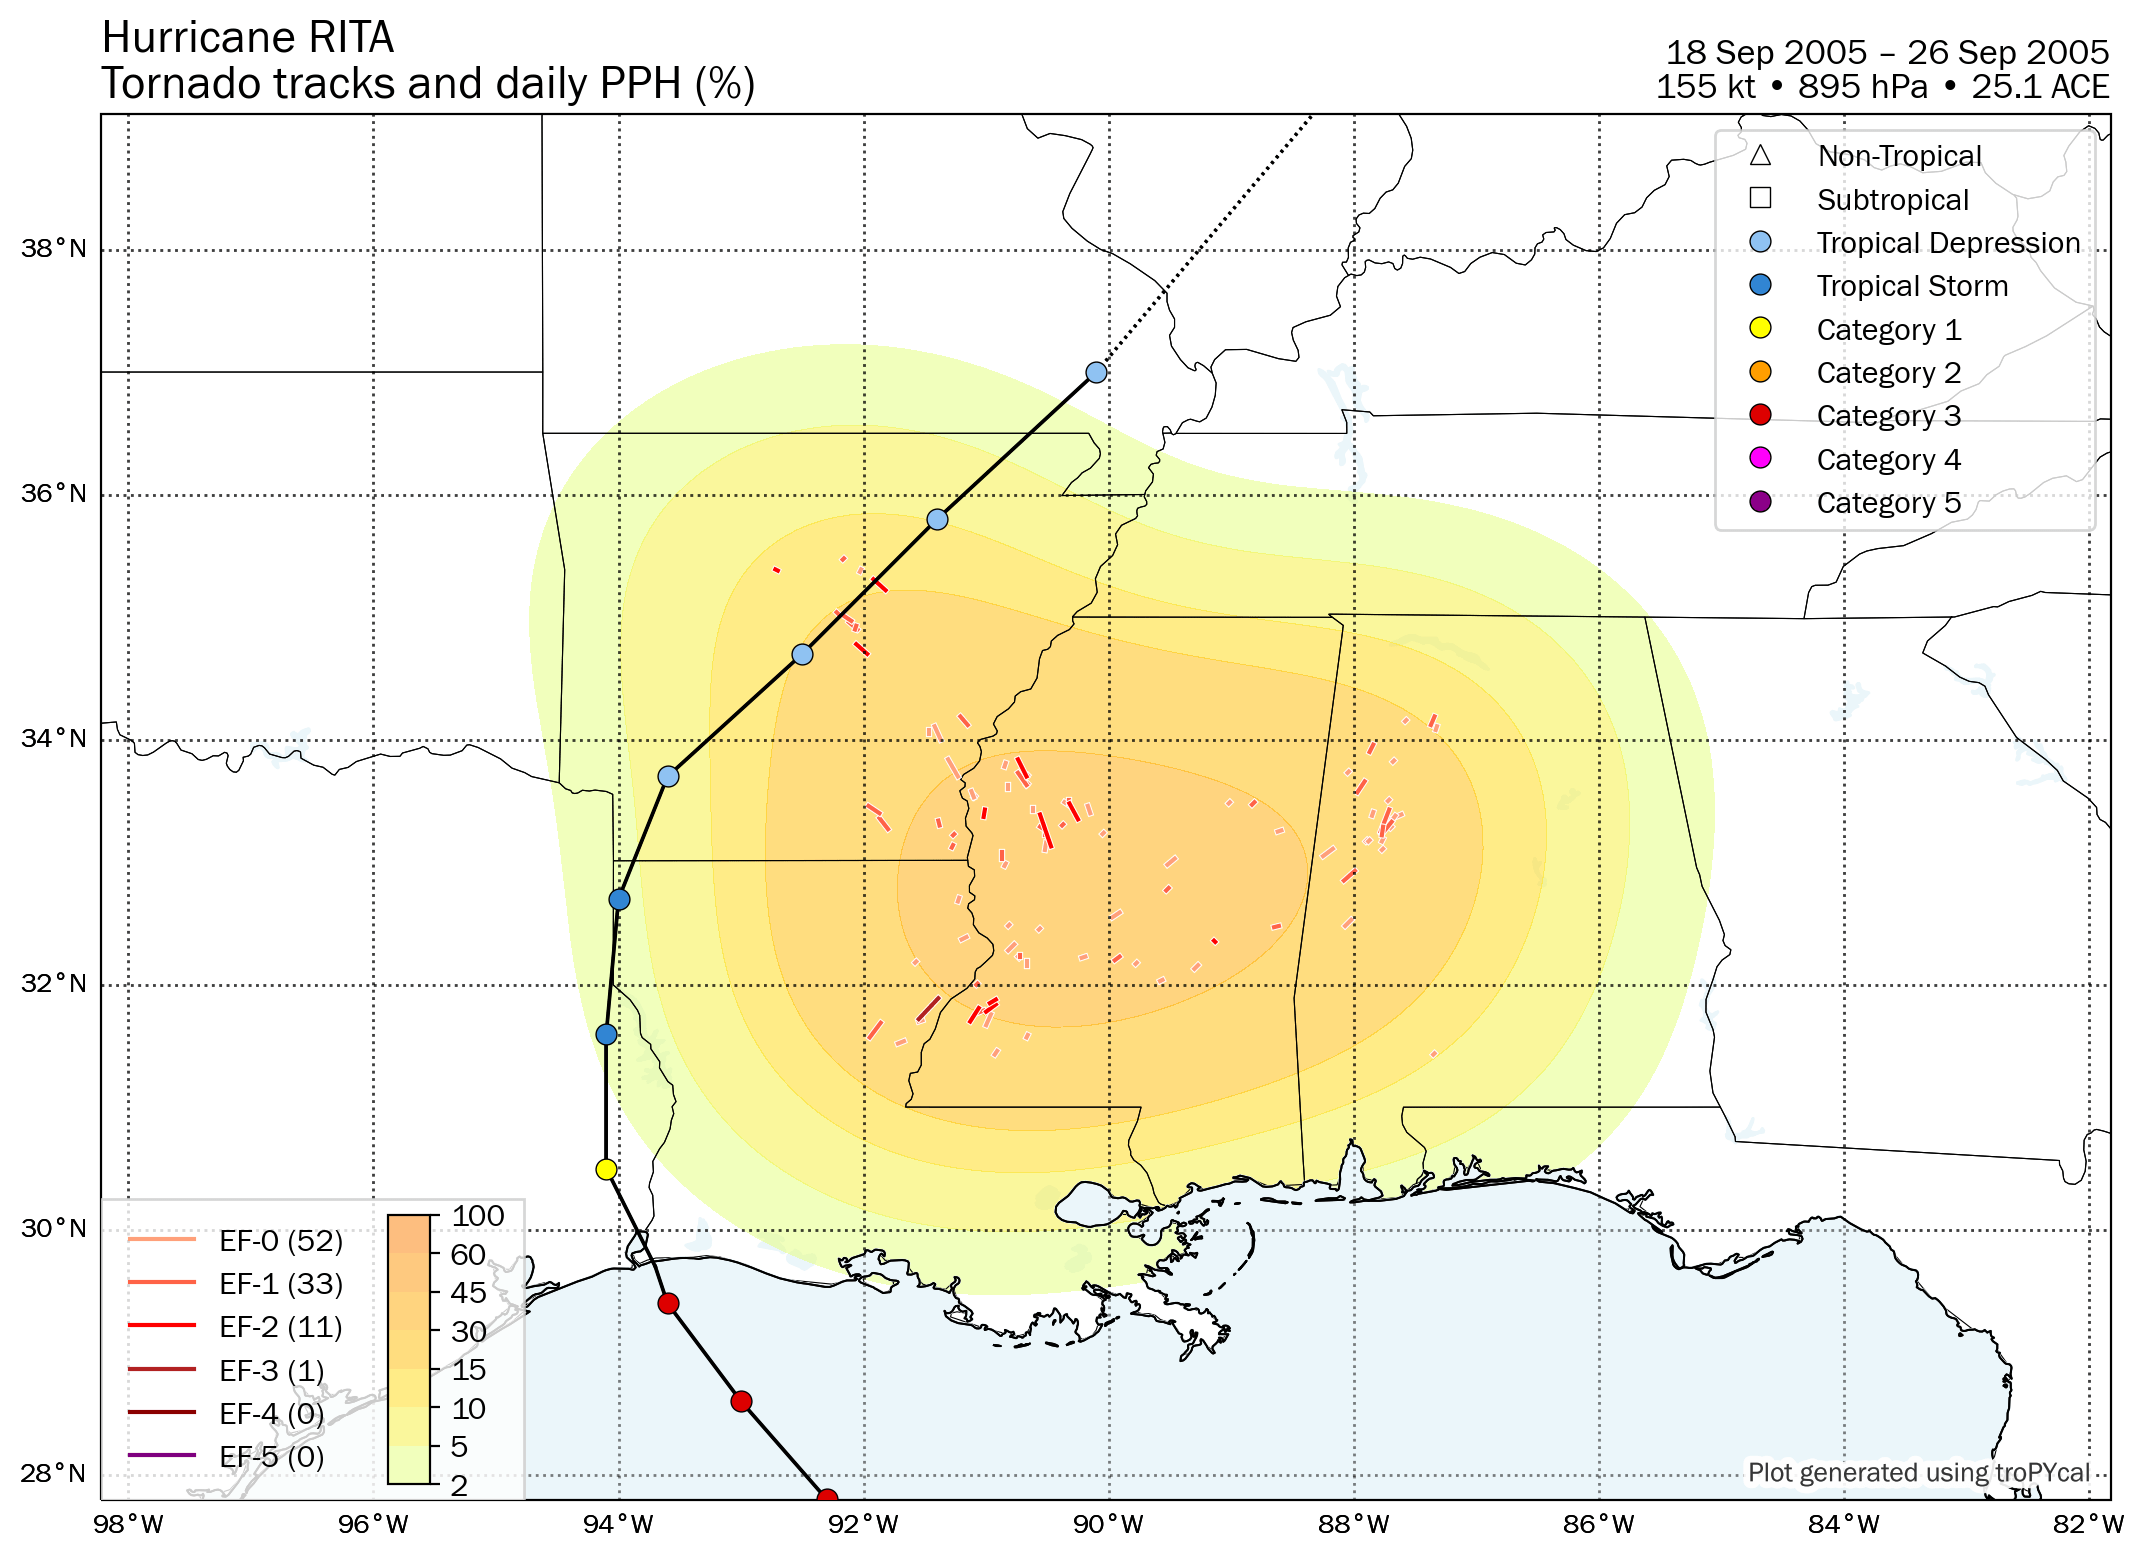
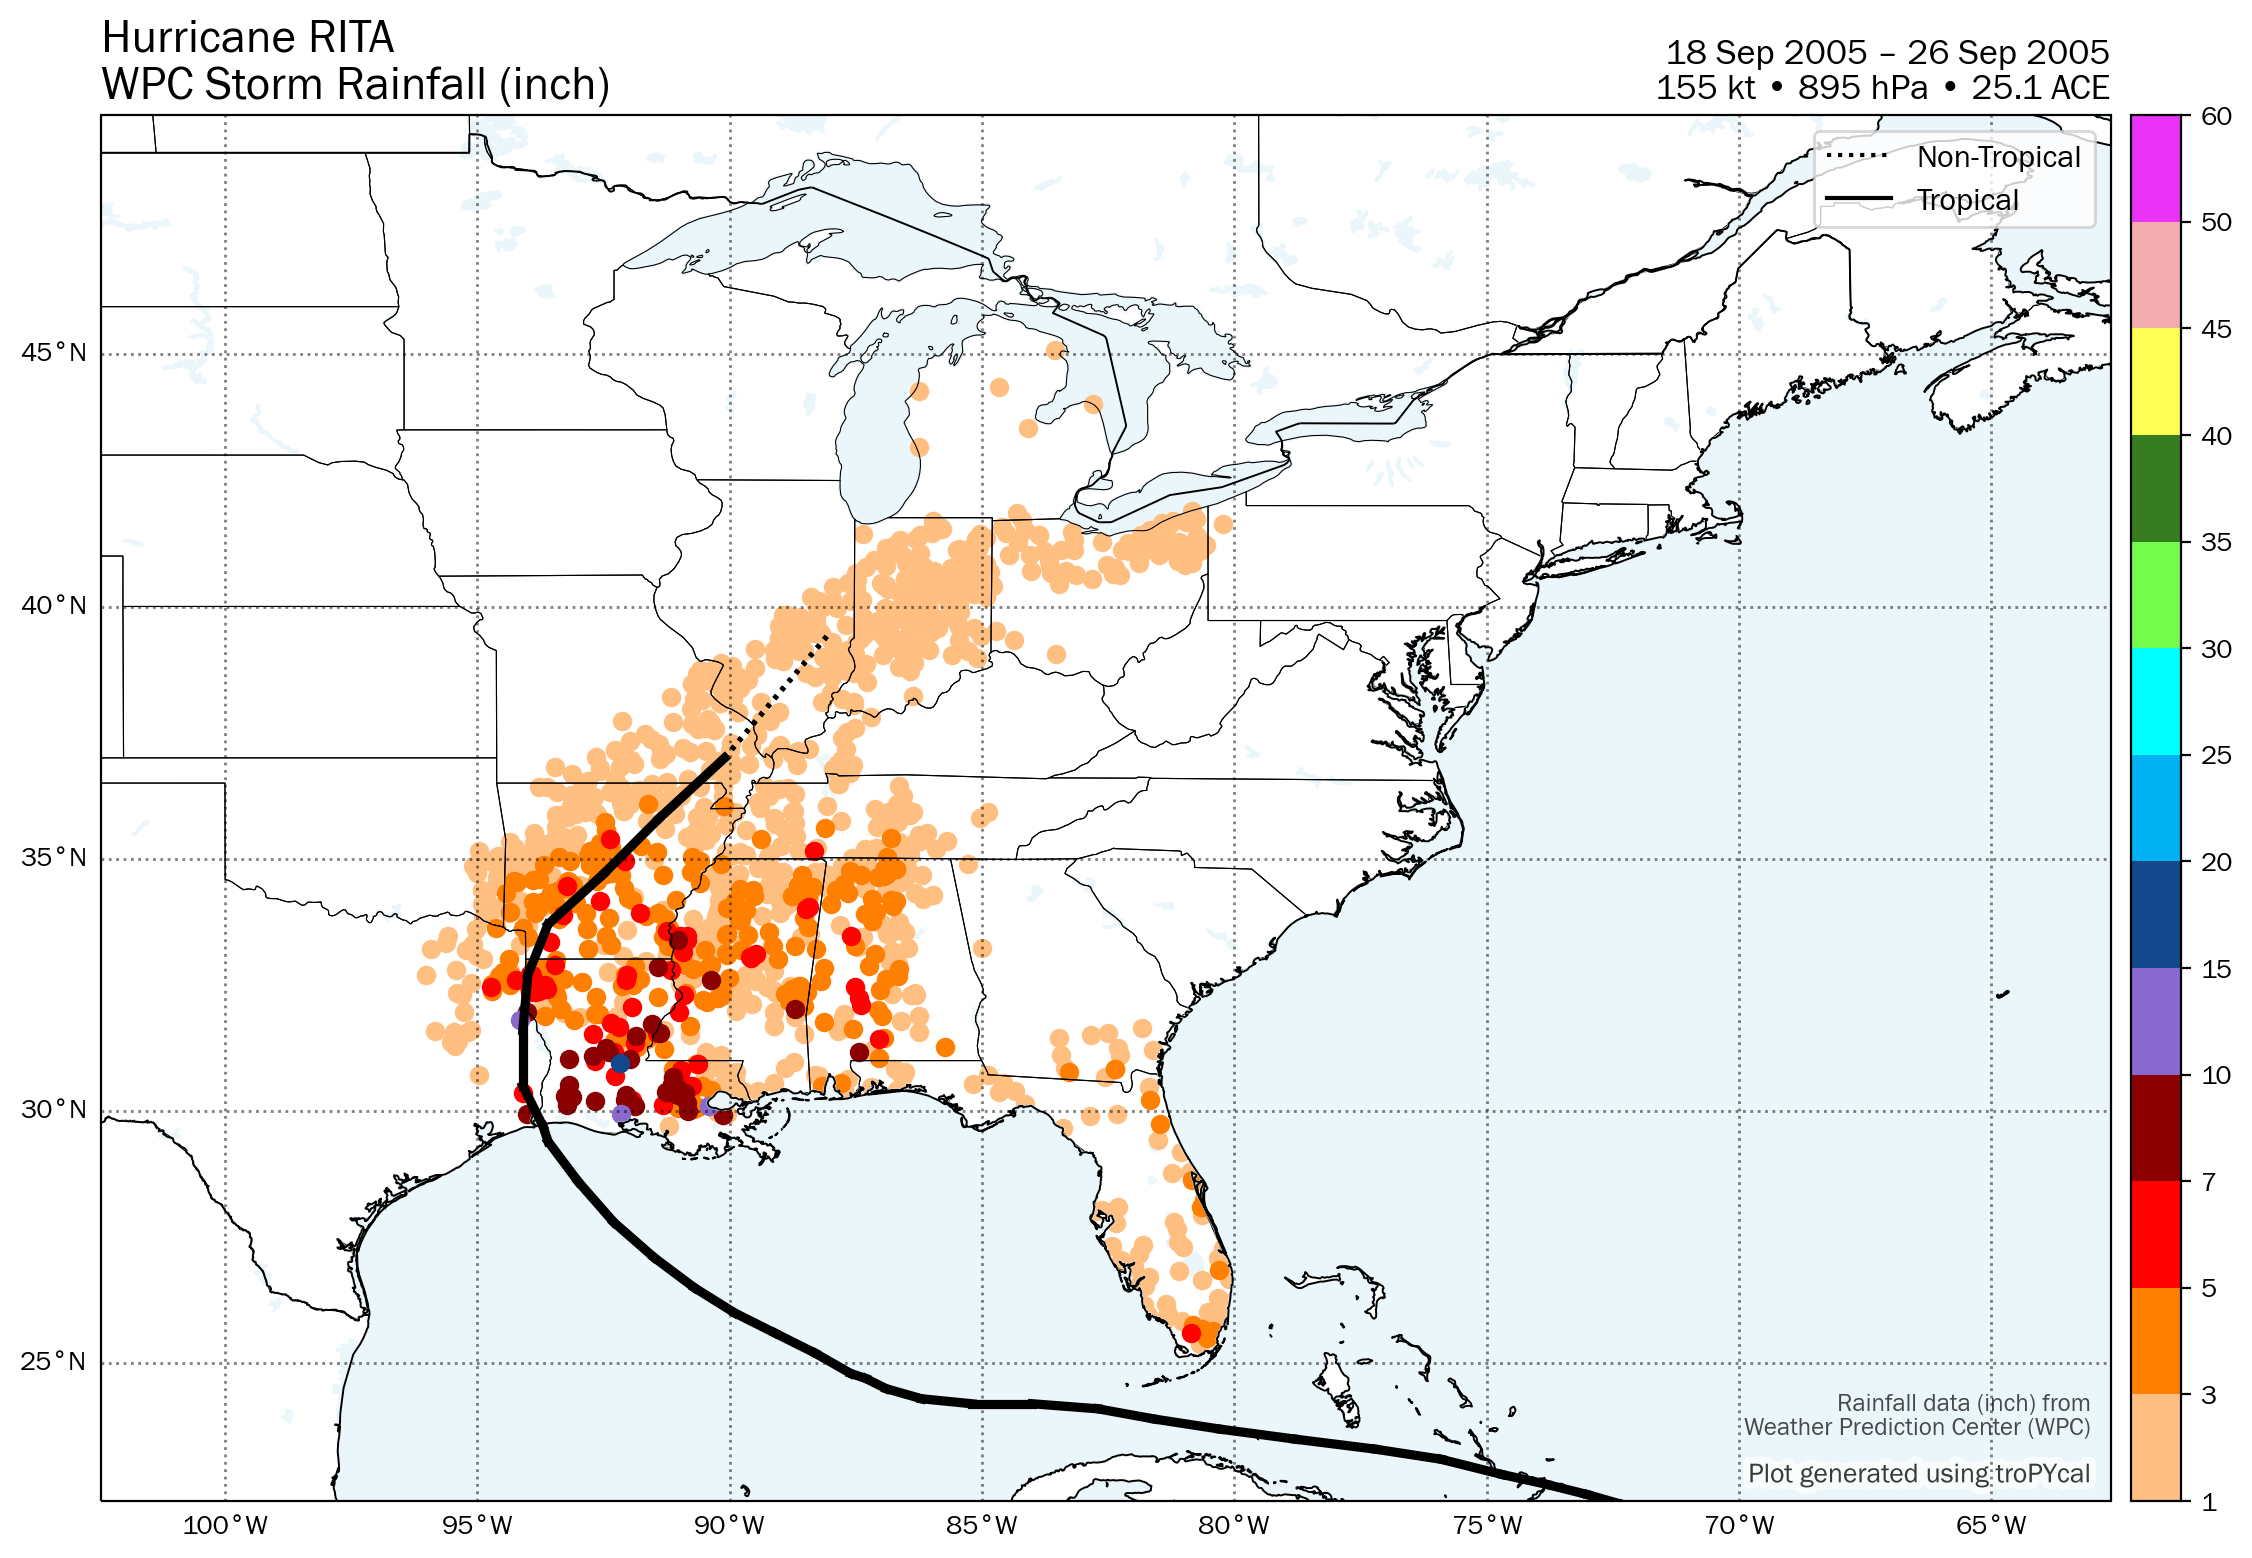
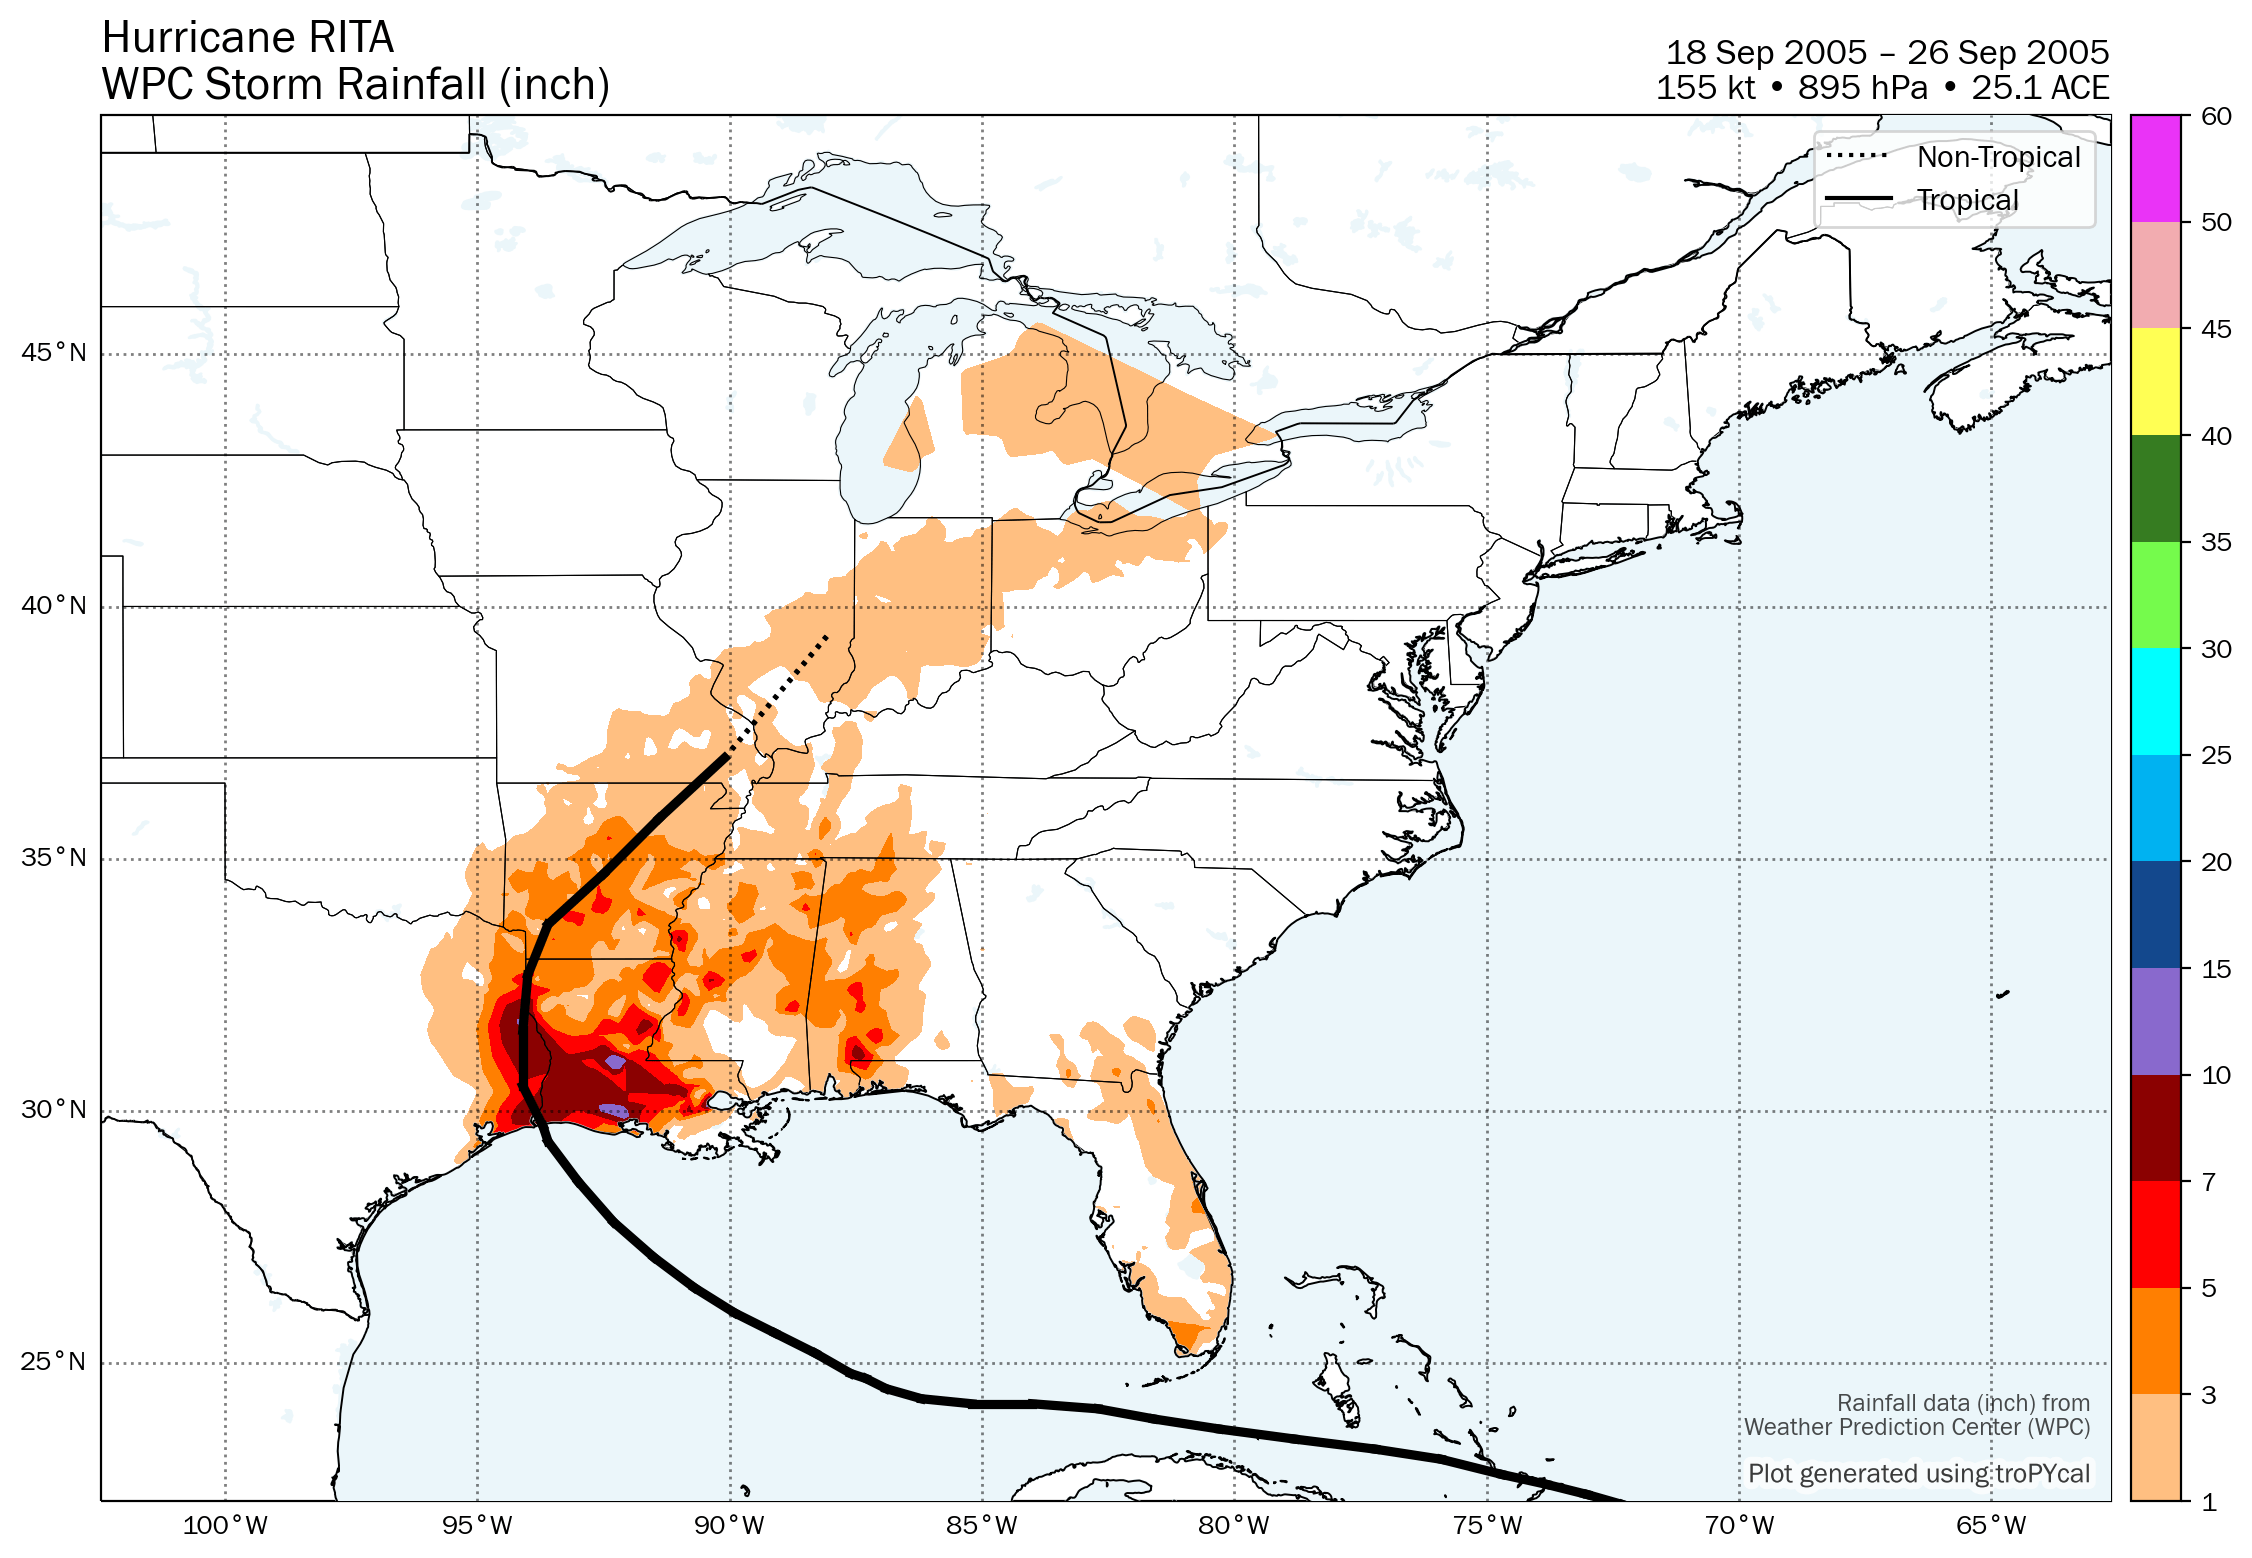
| 5 | Hurricane Rita | 155 kt | 895 hPa | 00z 09/18 | 00z 09/26 | 25.1 |
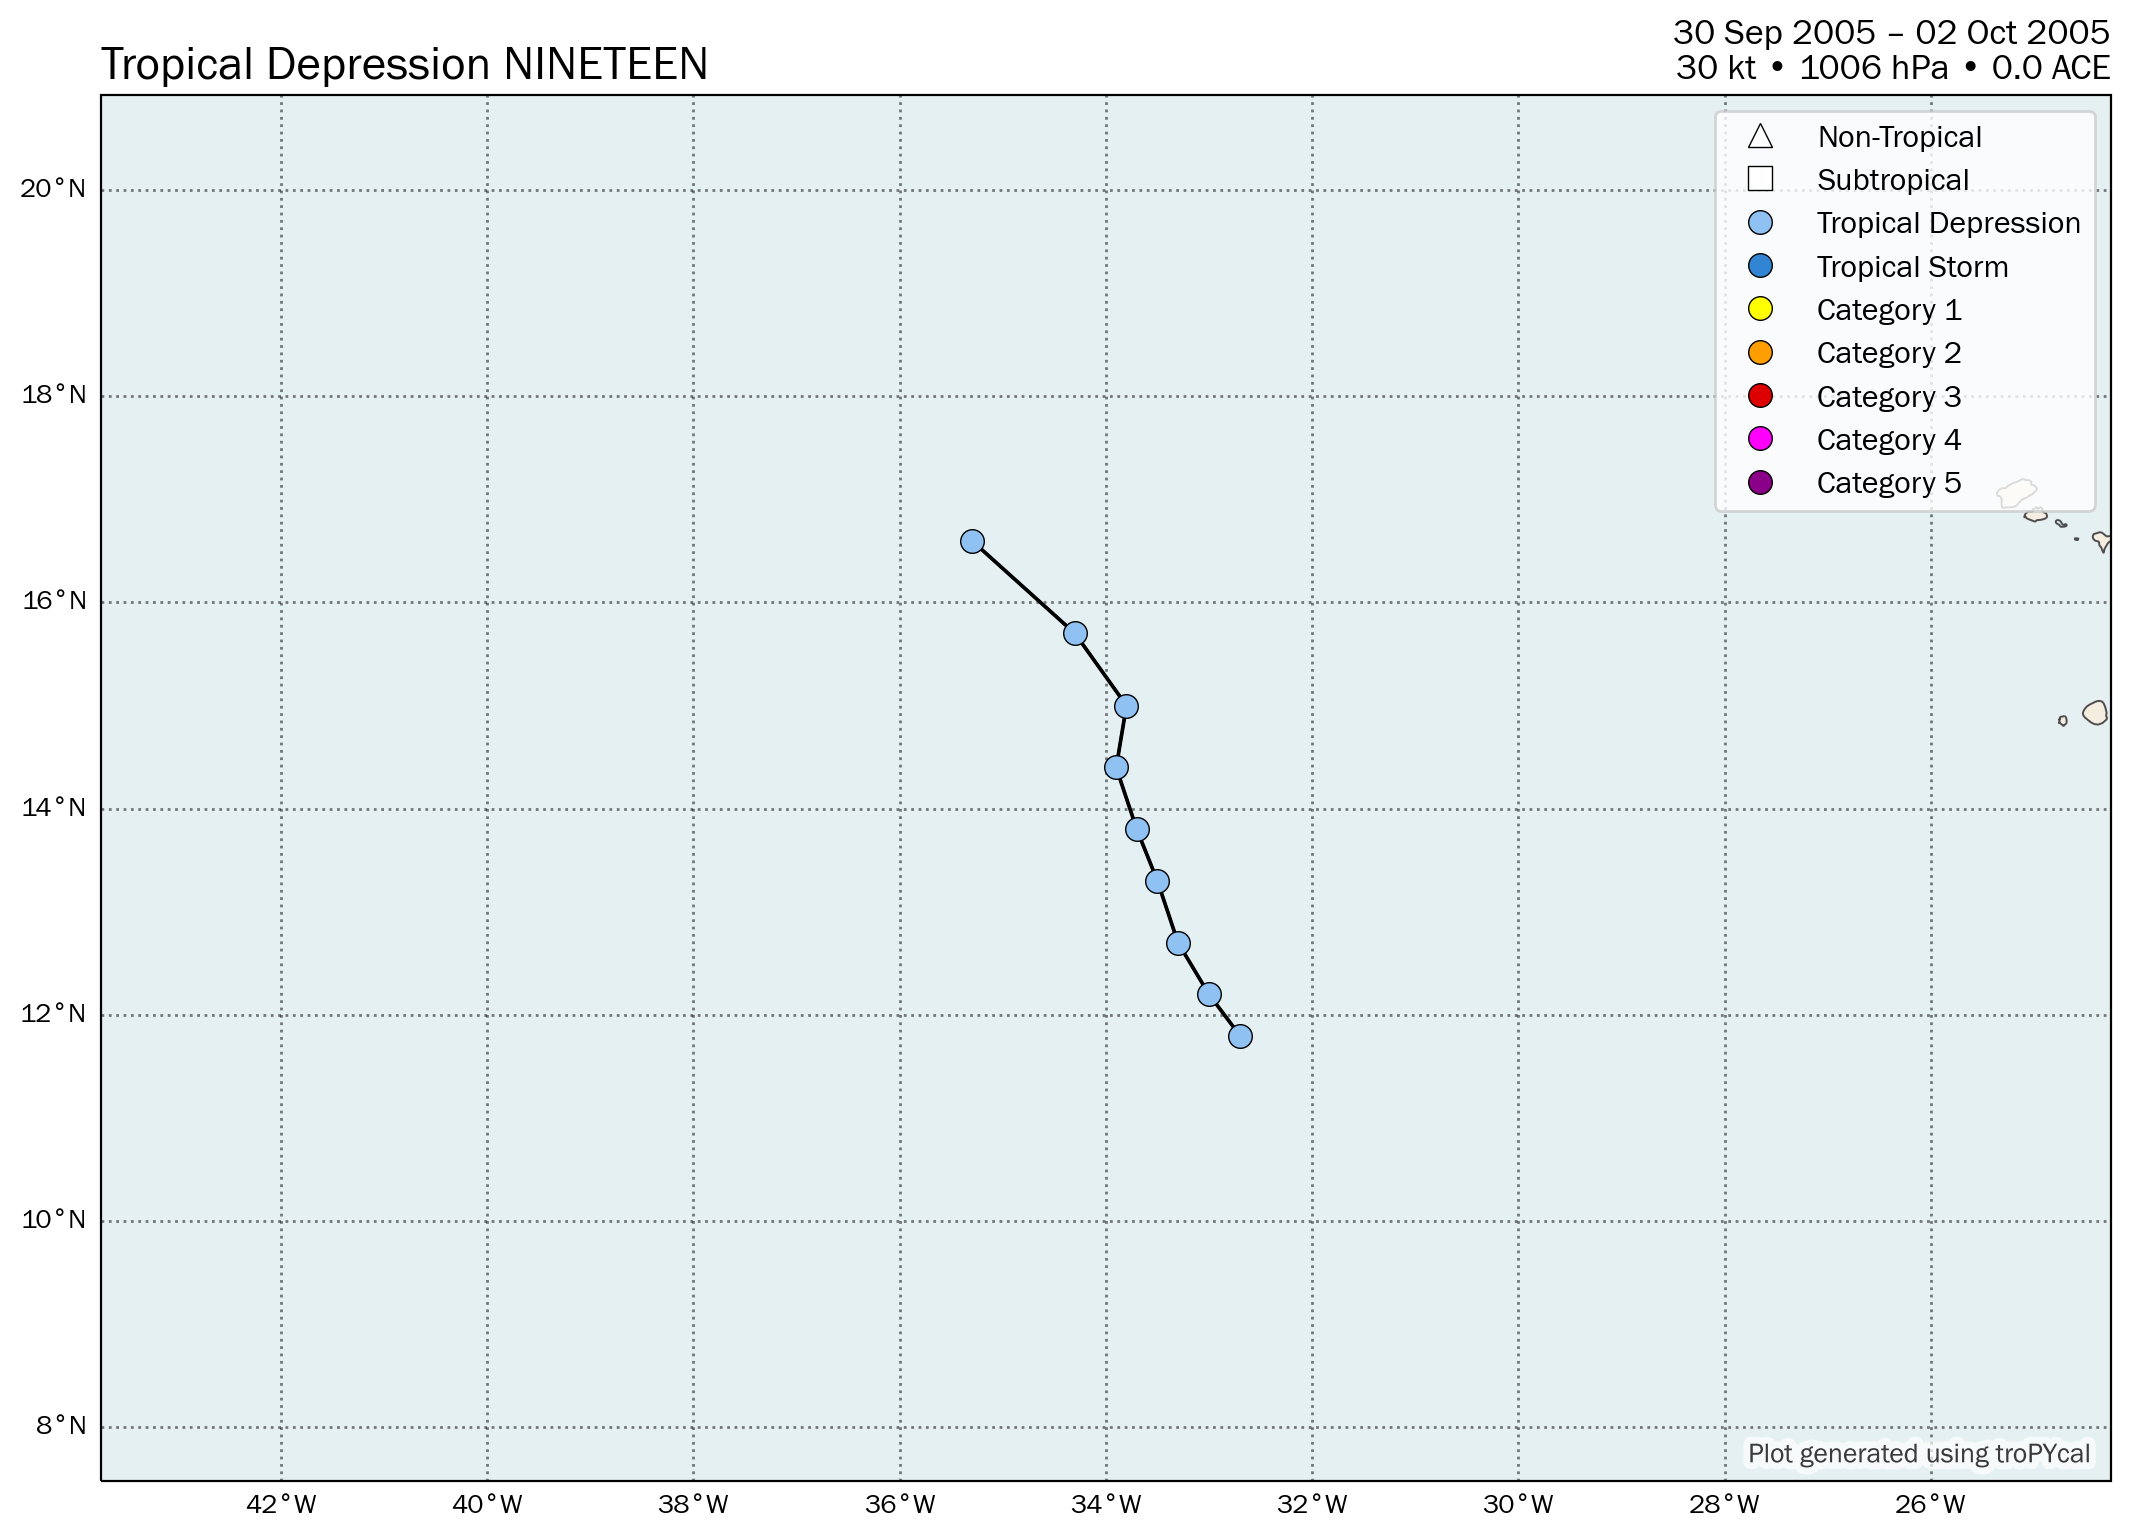
| D | Tropical Depression Nineteen | 30 kt | 1006 hPa | 12z 09/30 | 12z 10/02 | 0.0 |
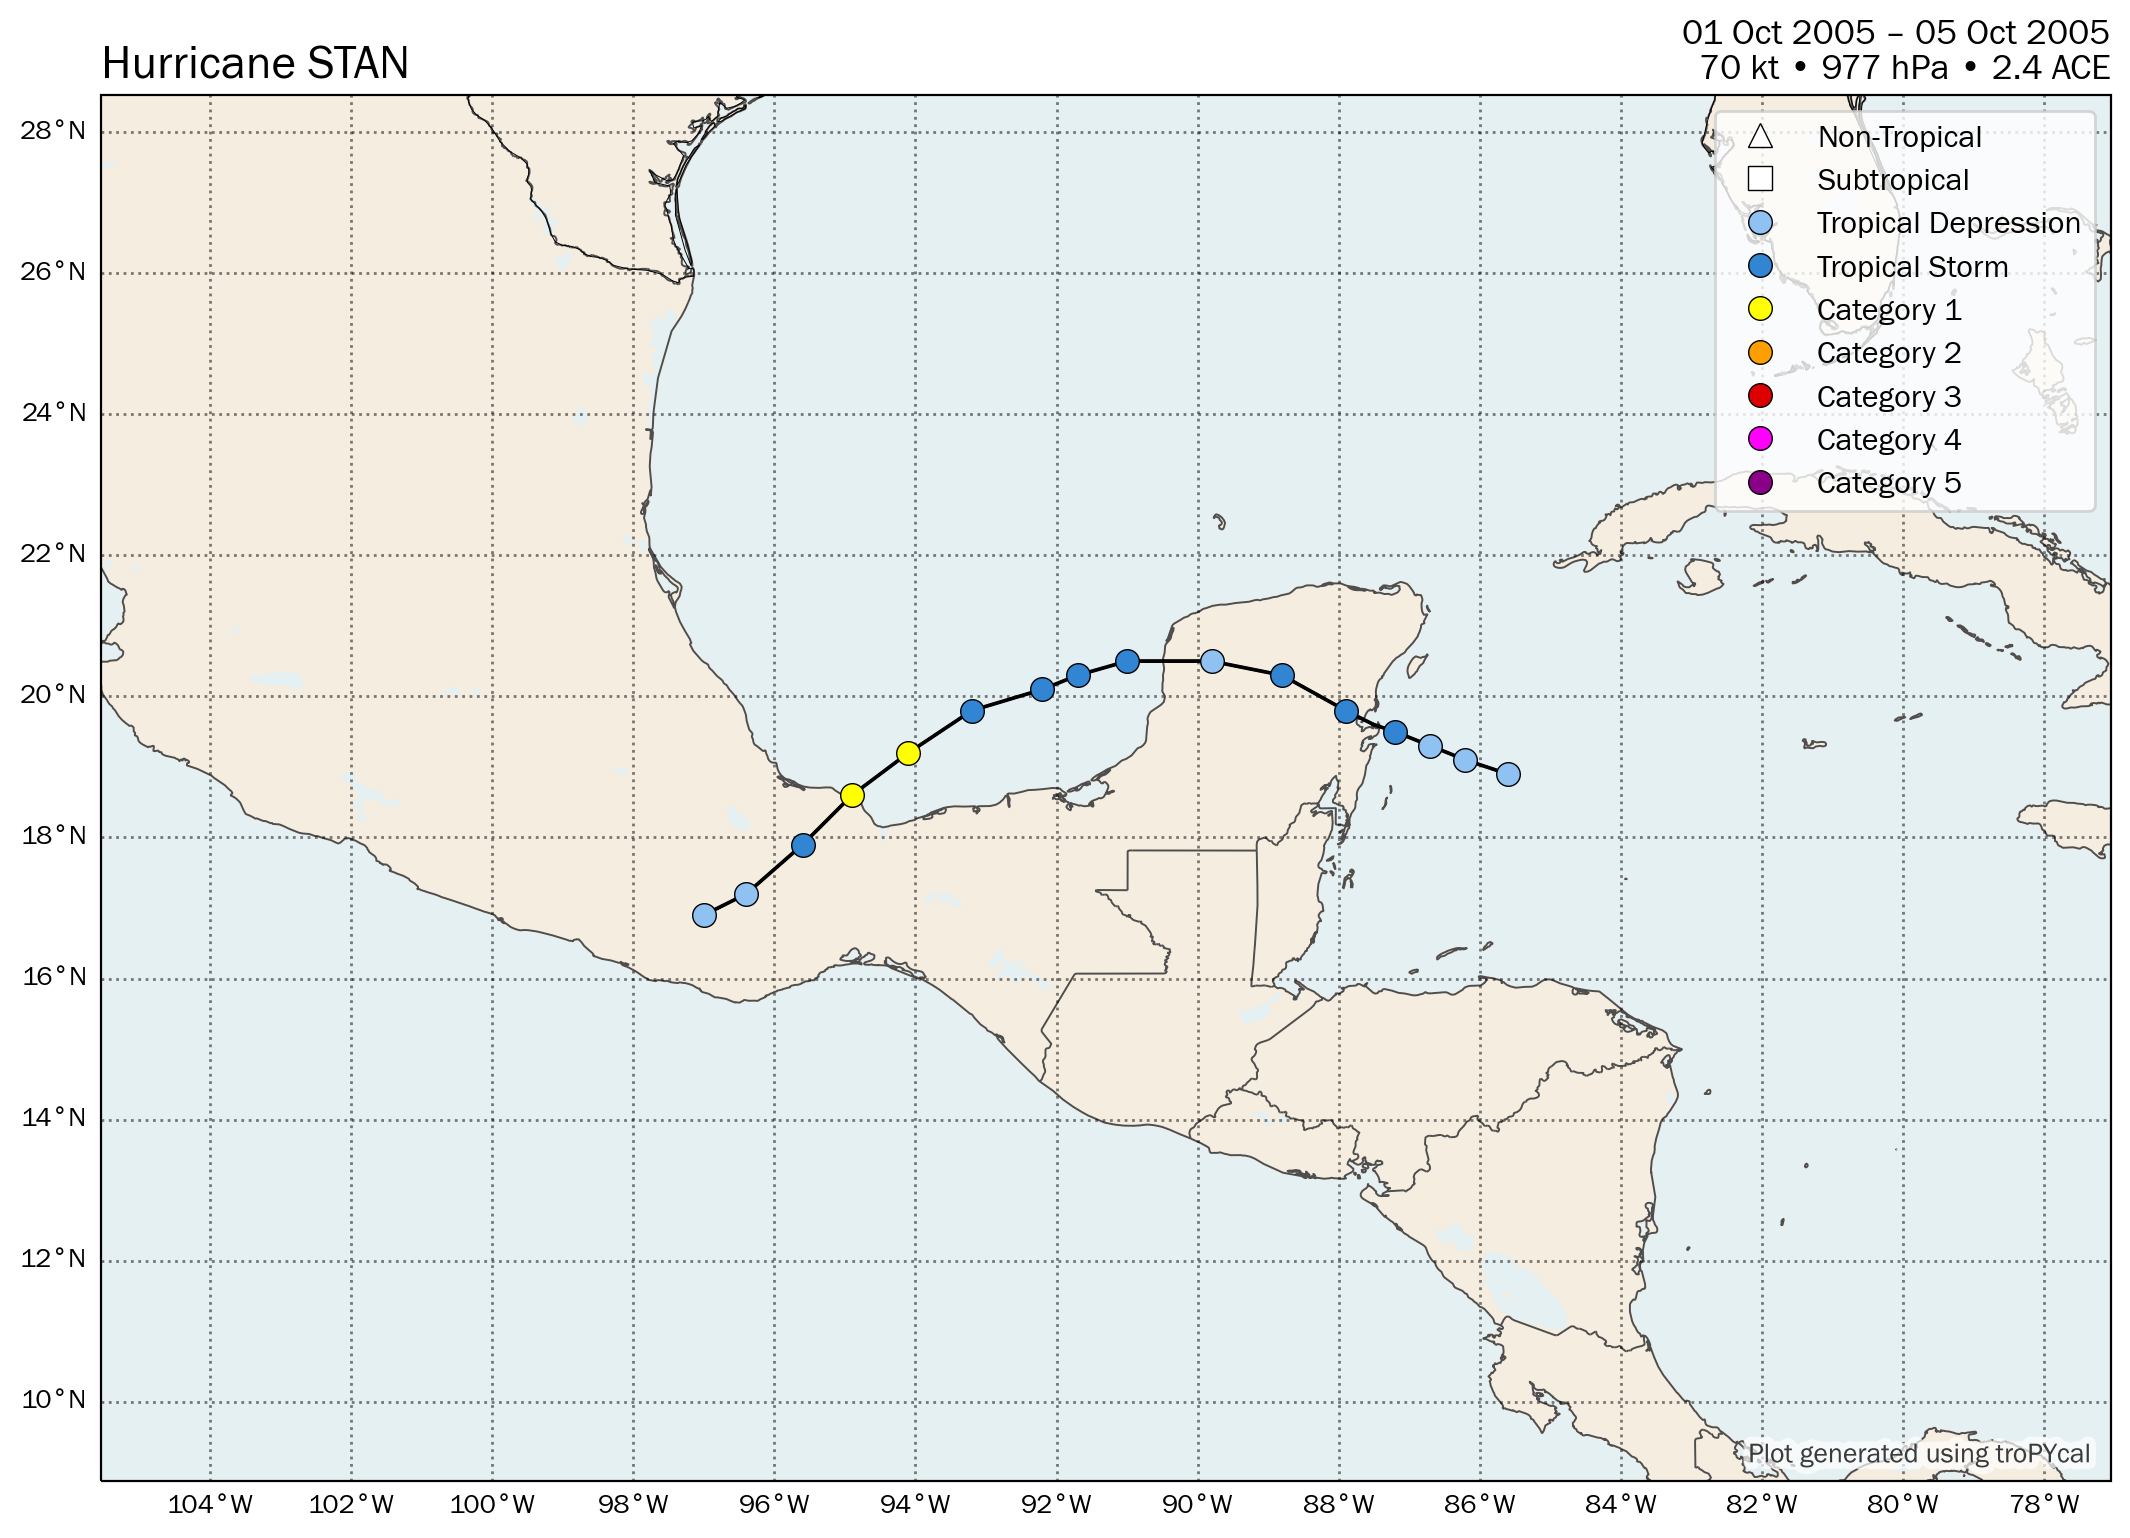
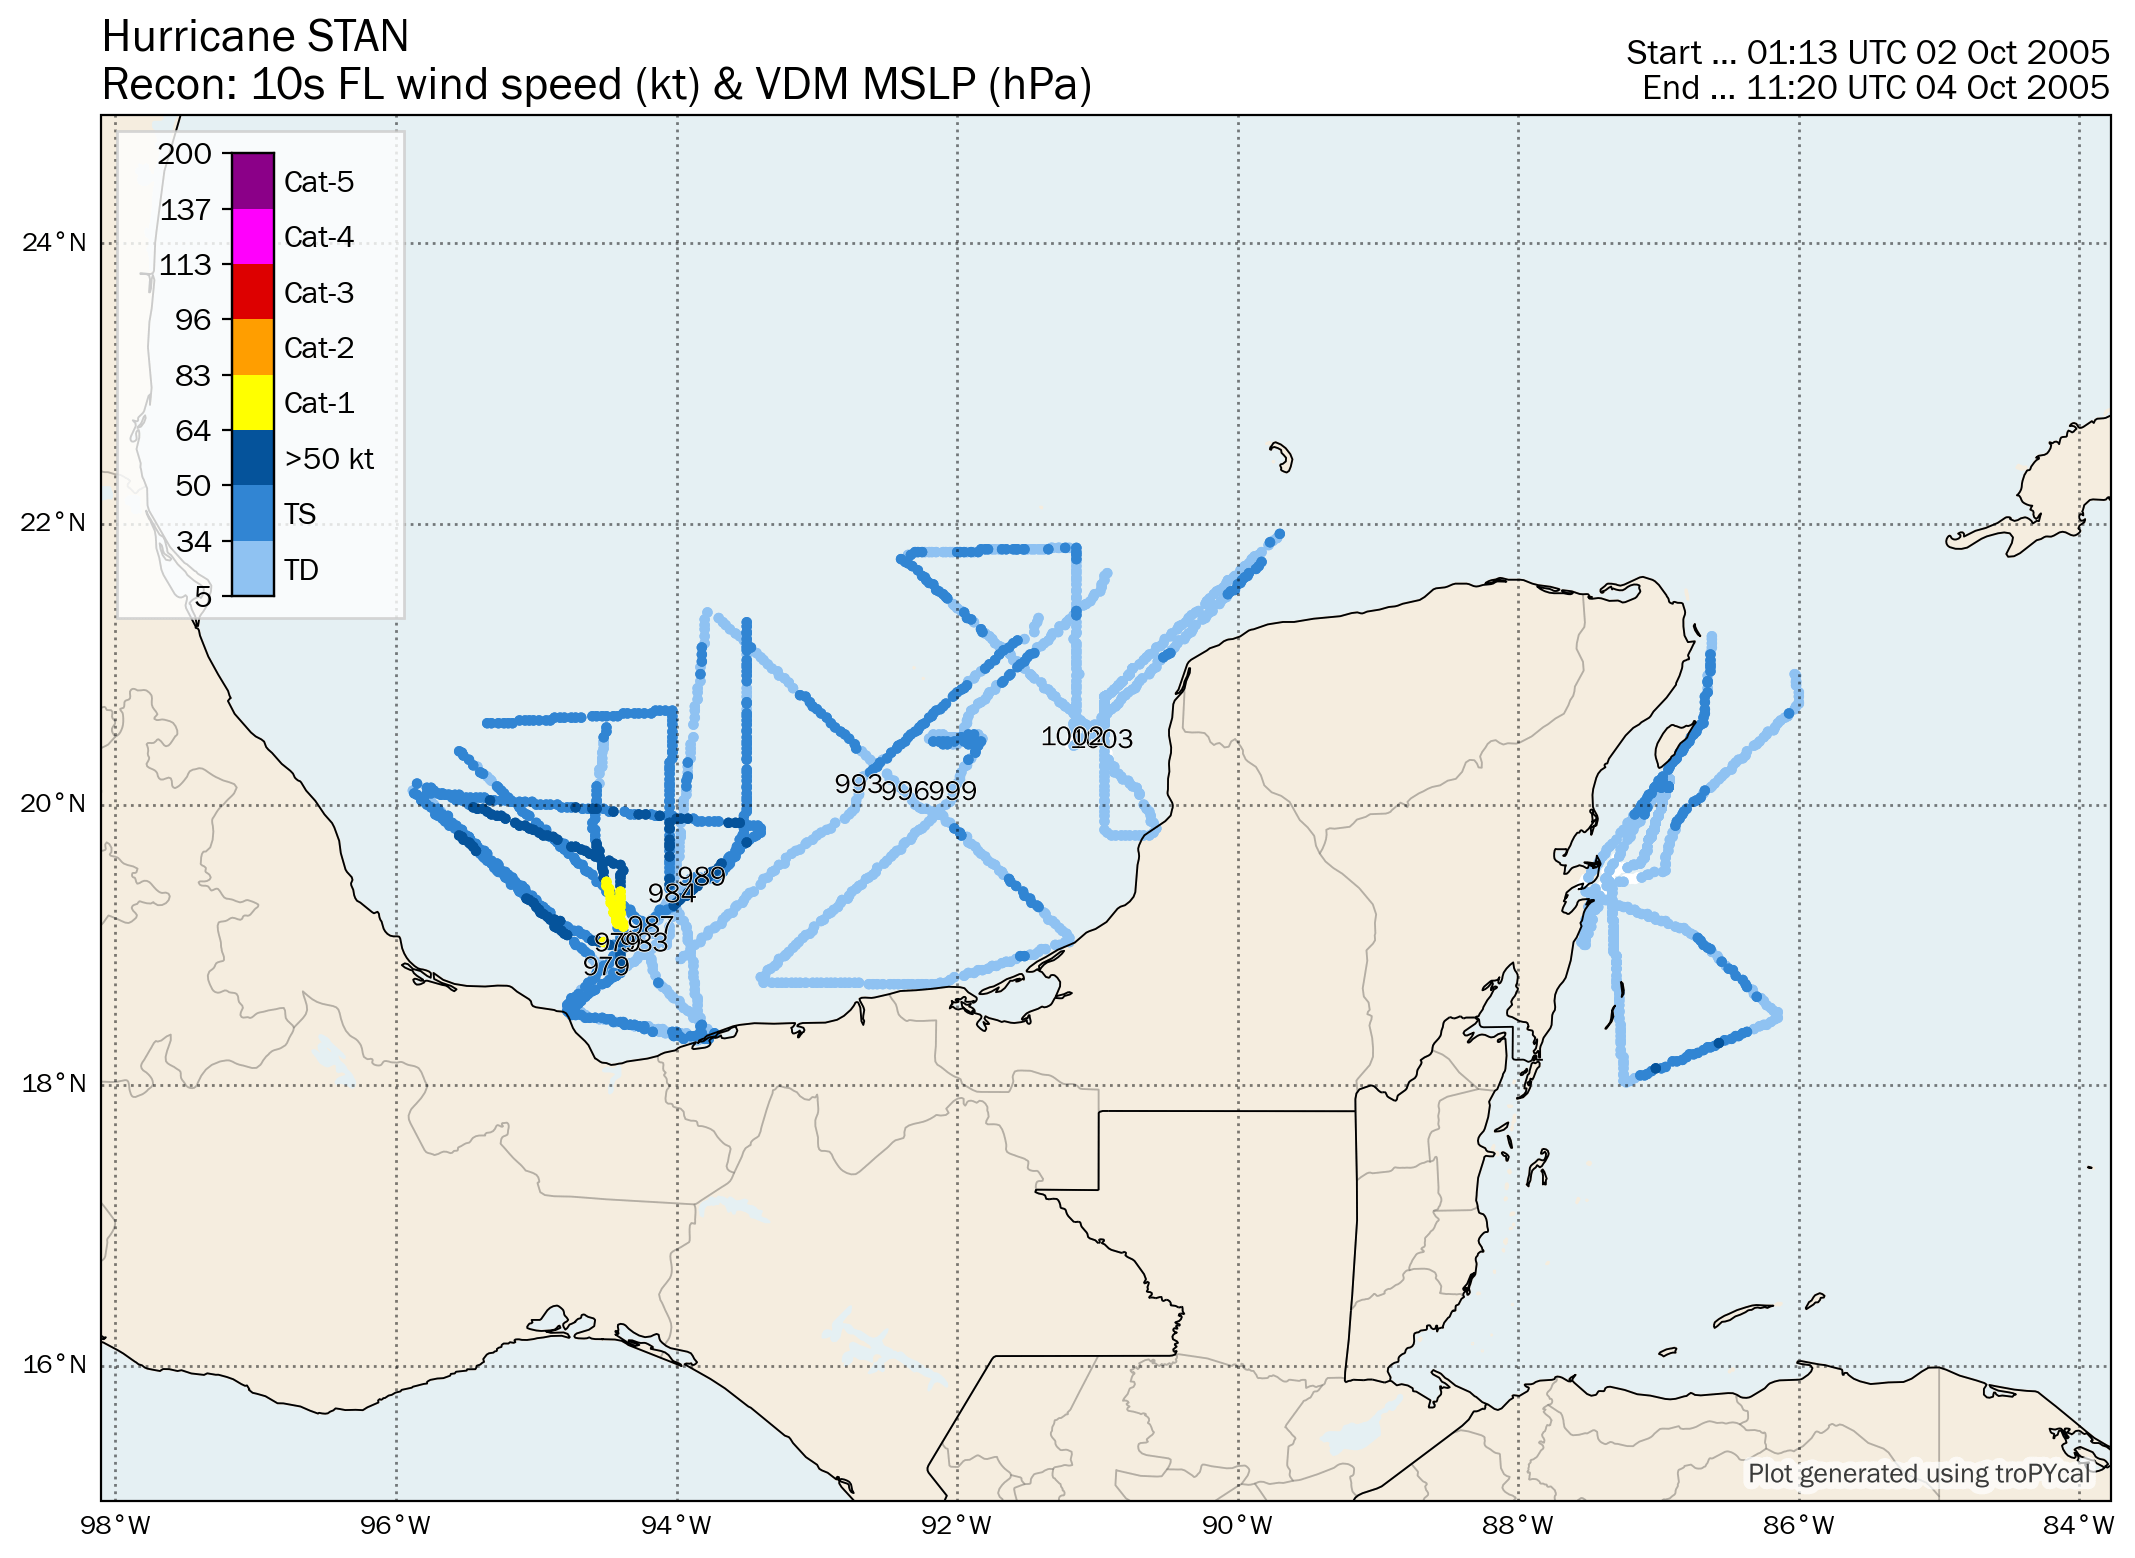
| 1 | Hurricane Stan | 70 kt | 977 hPa | 12z 10/01 | 06z 10/05 | 2.4 |
| S | Unnamed Subtropical Storm | 45 kt | 997 hPa | 06z 10/04 | 00z 10/05 | 0.5 |
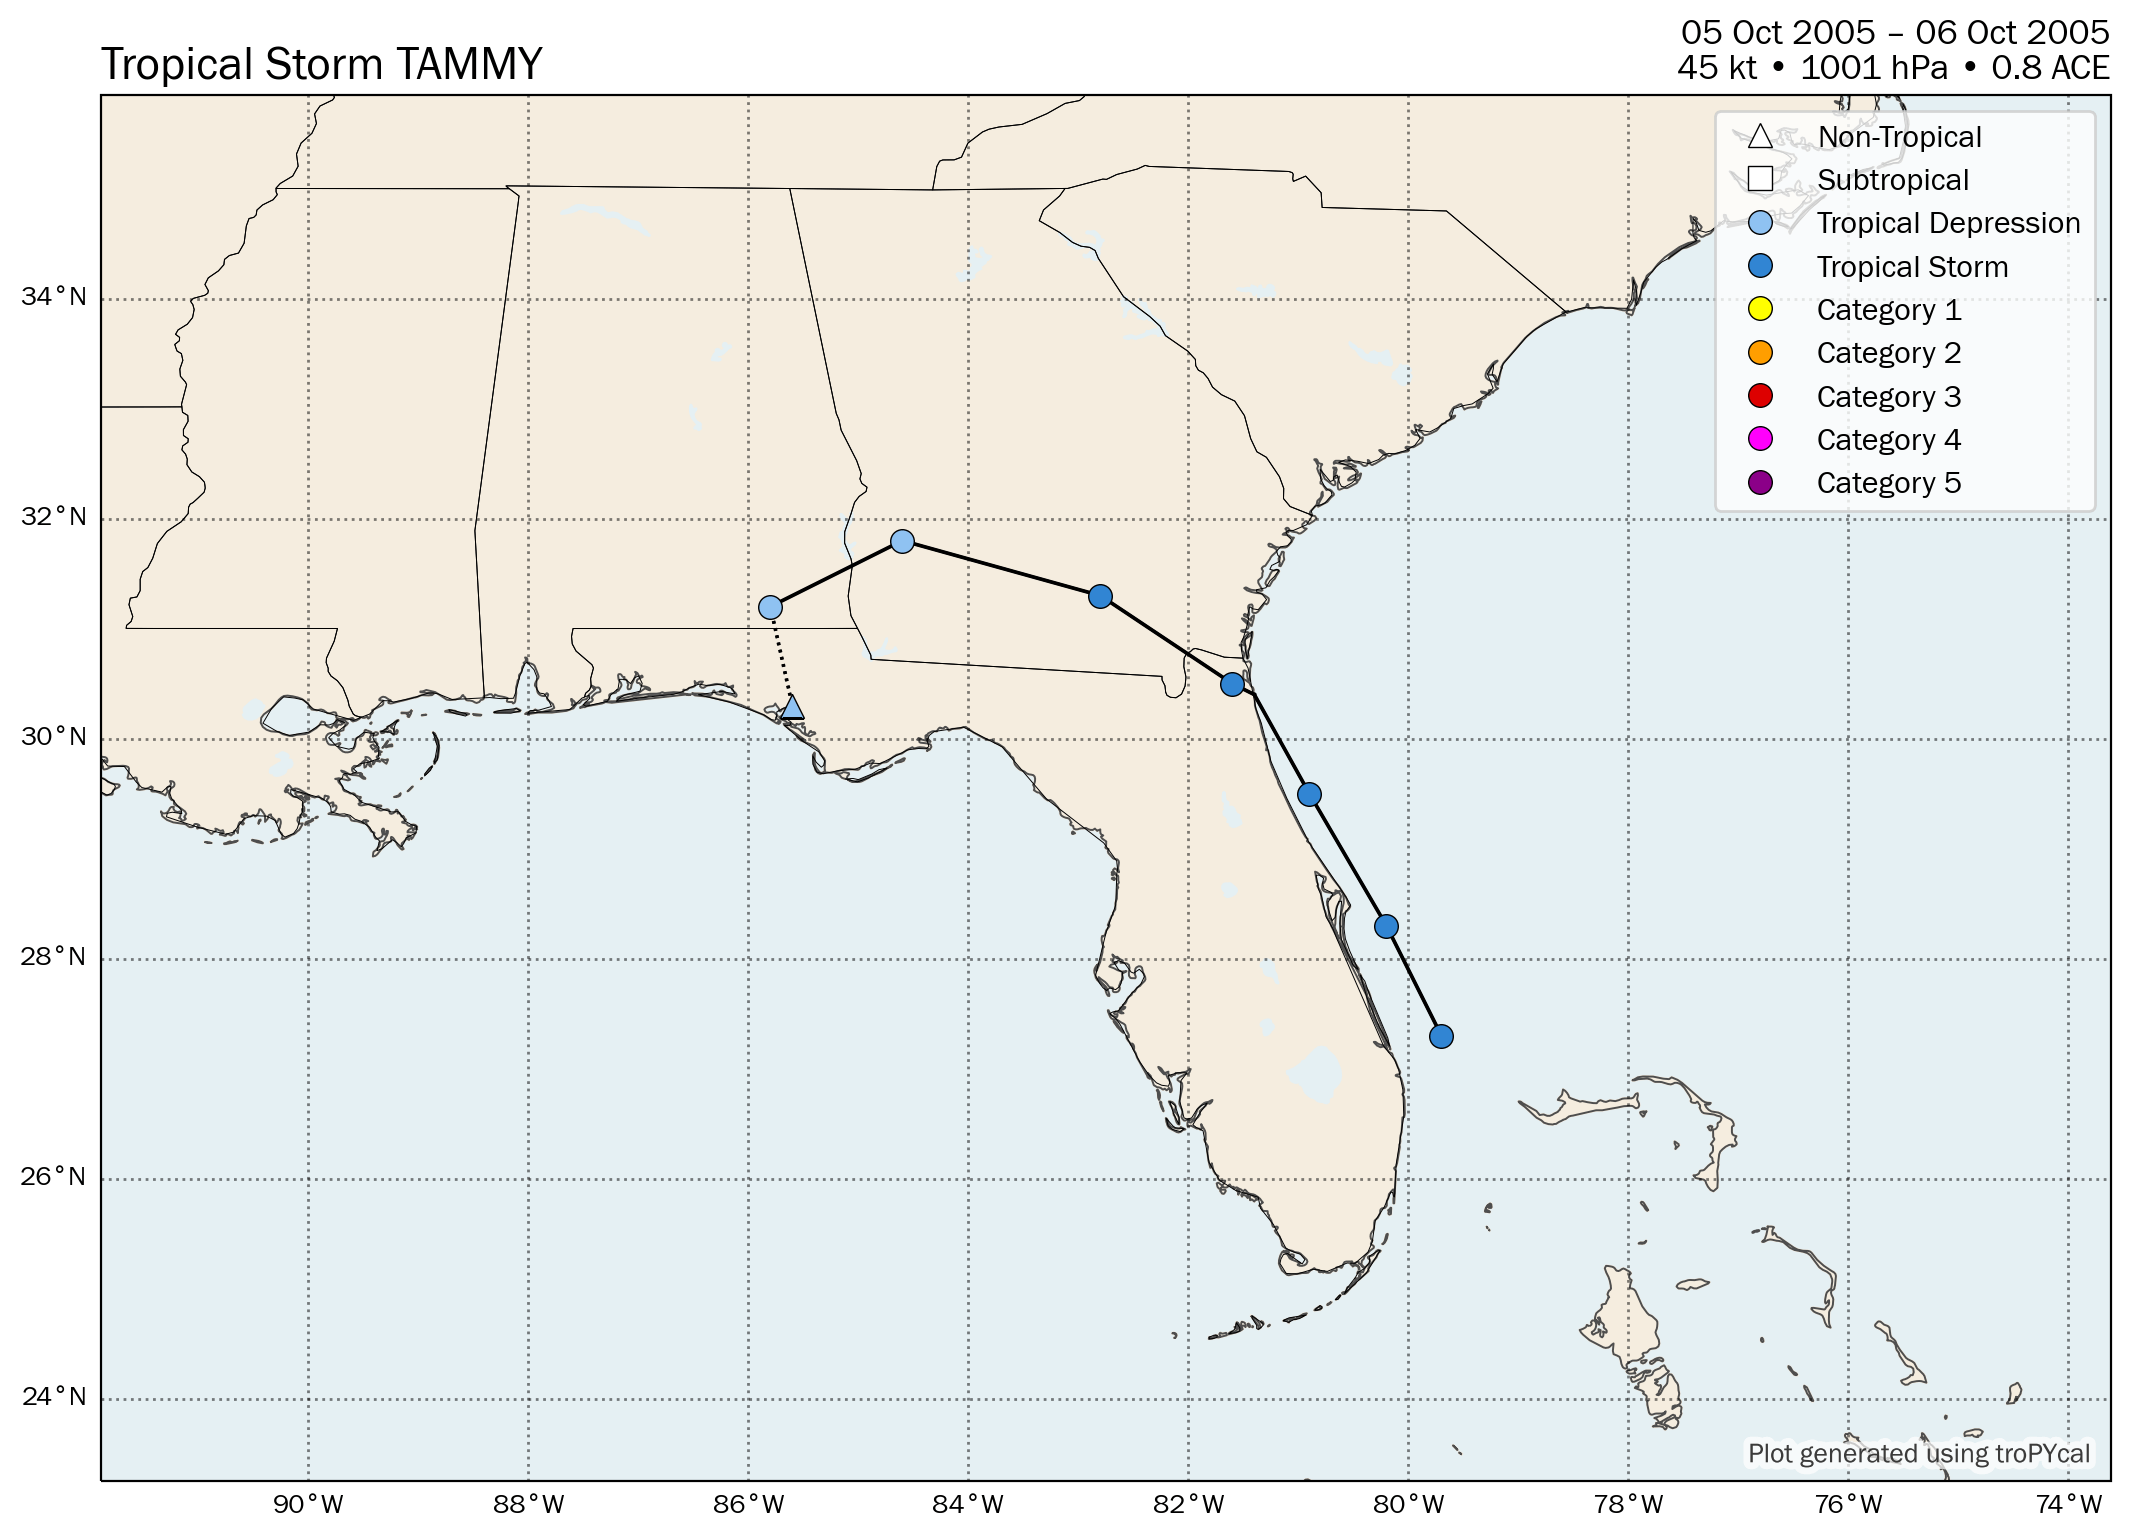
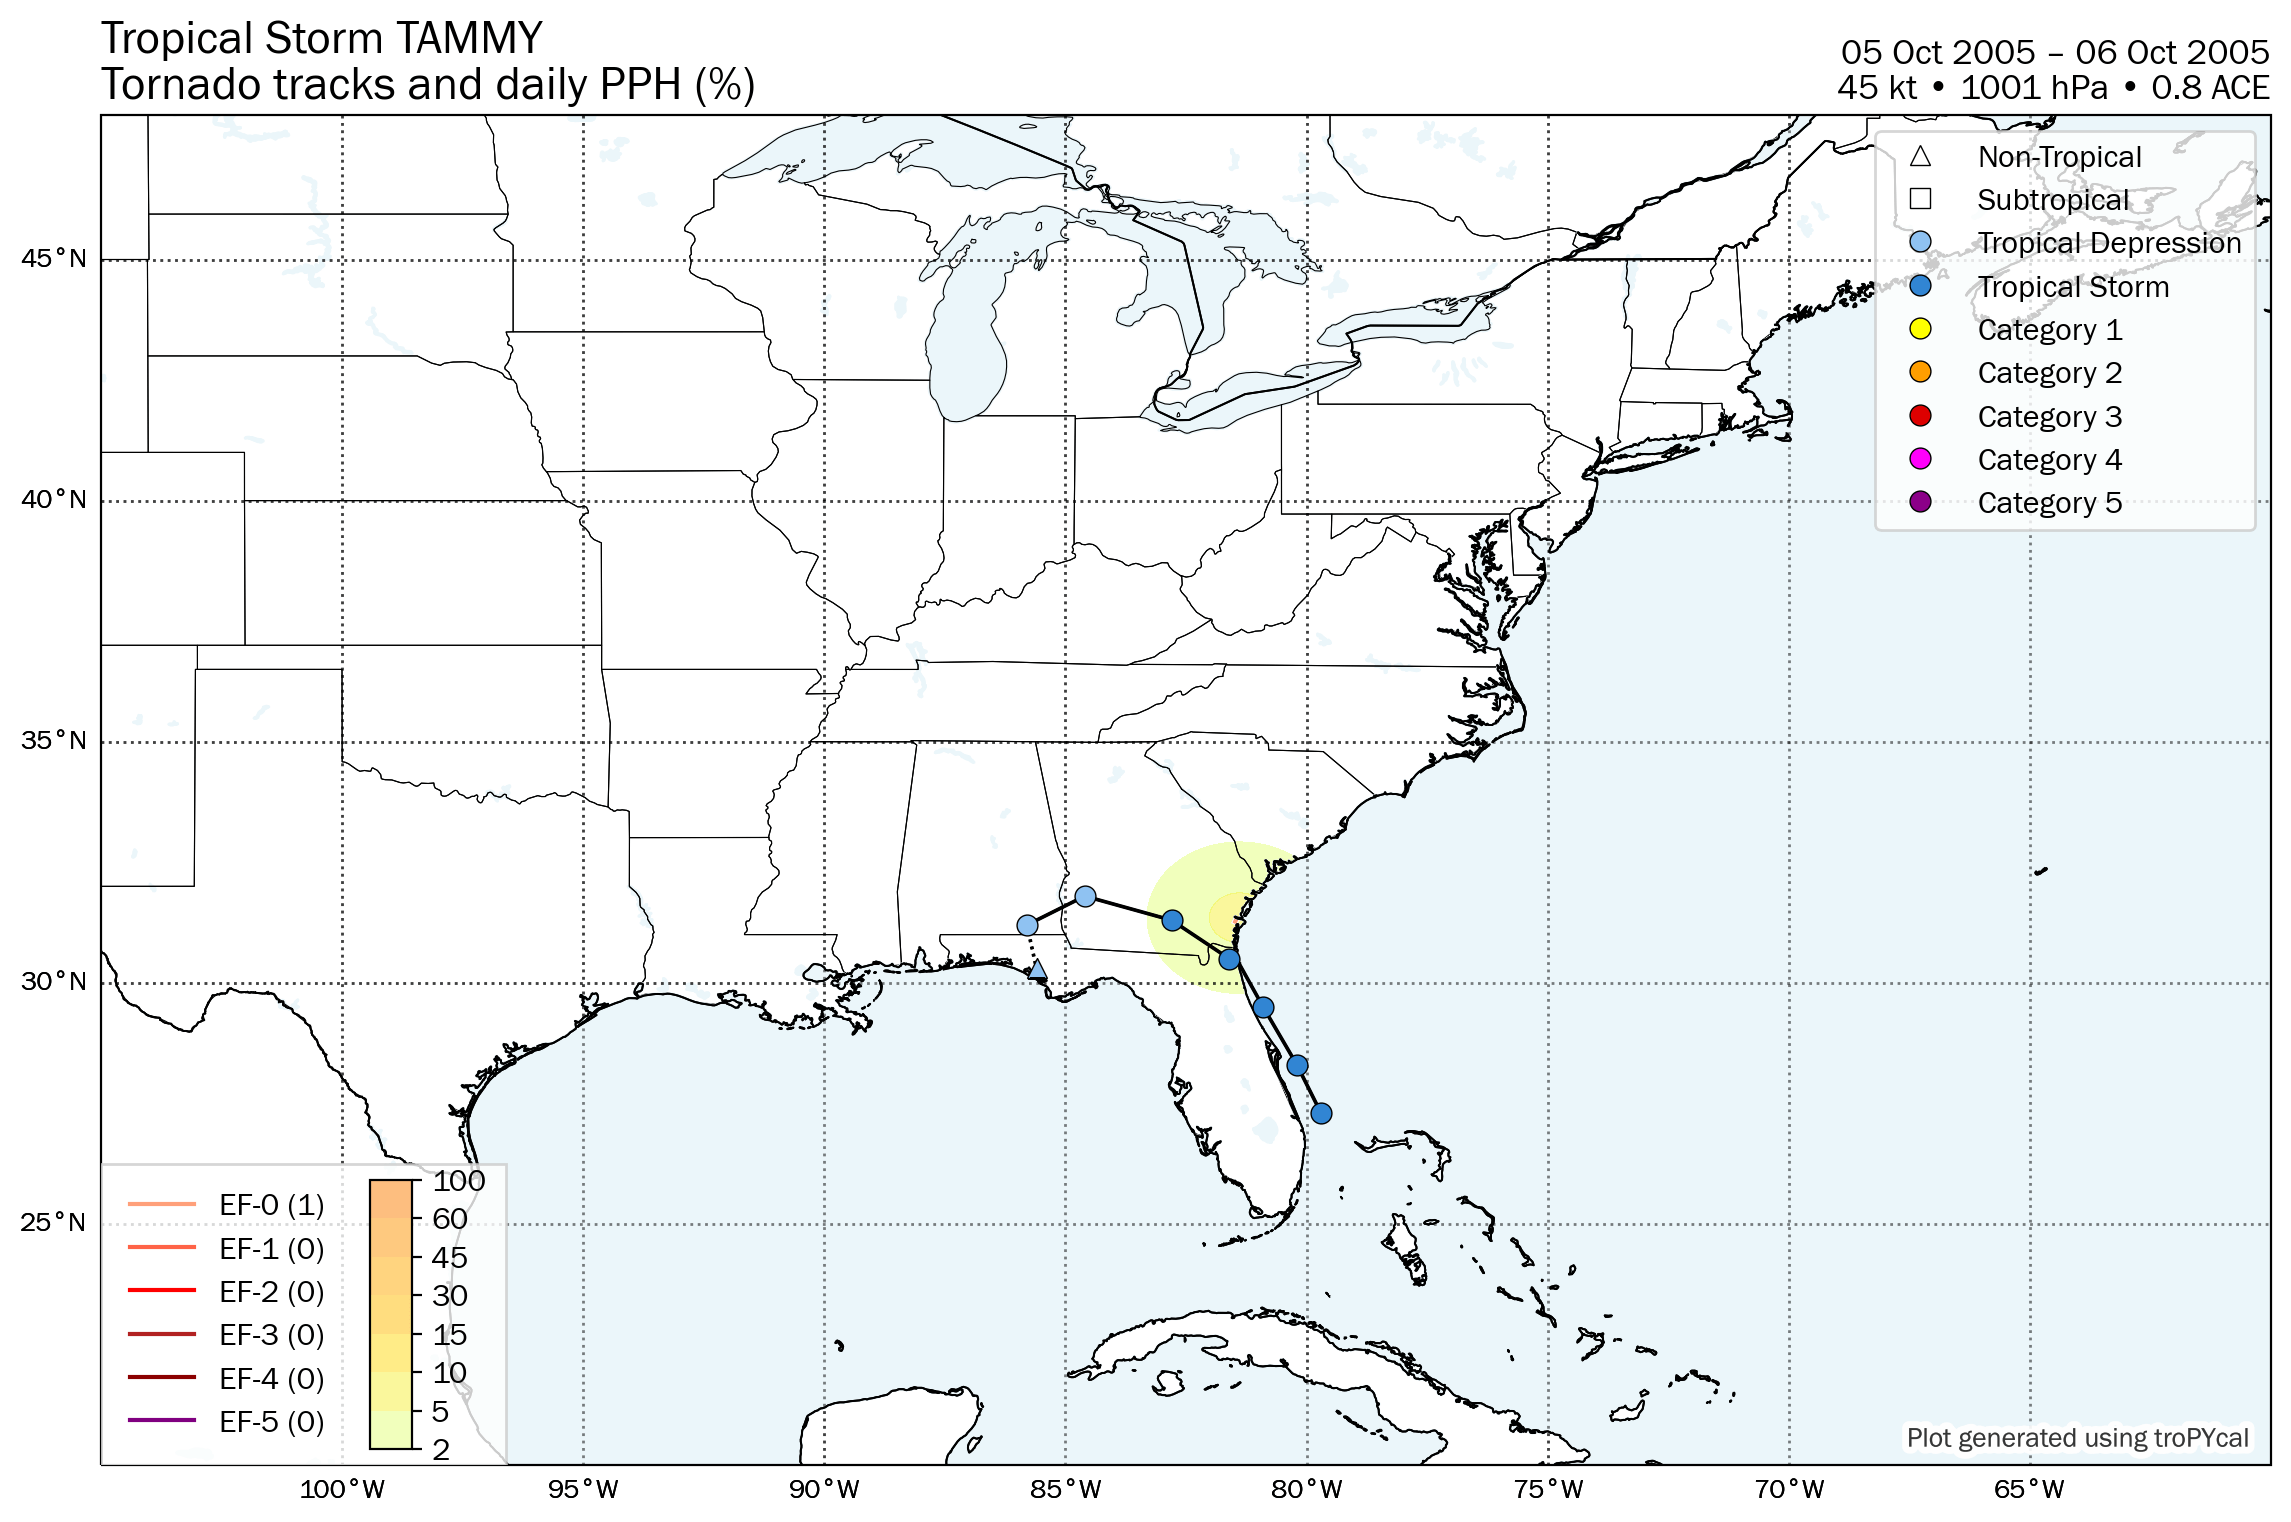
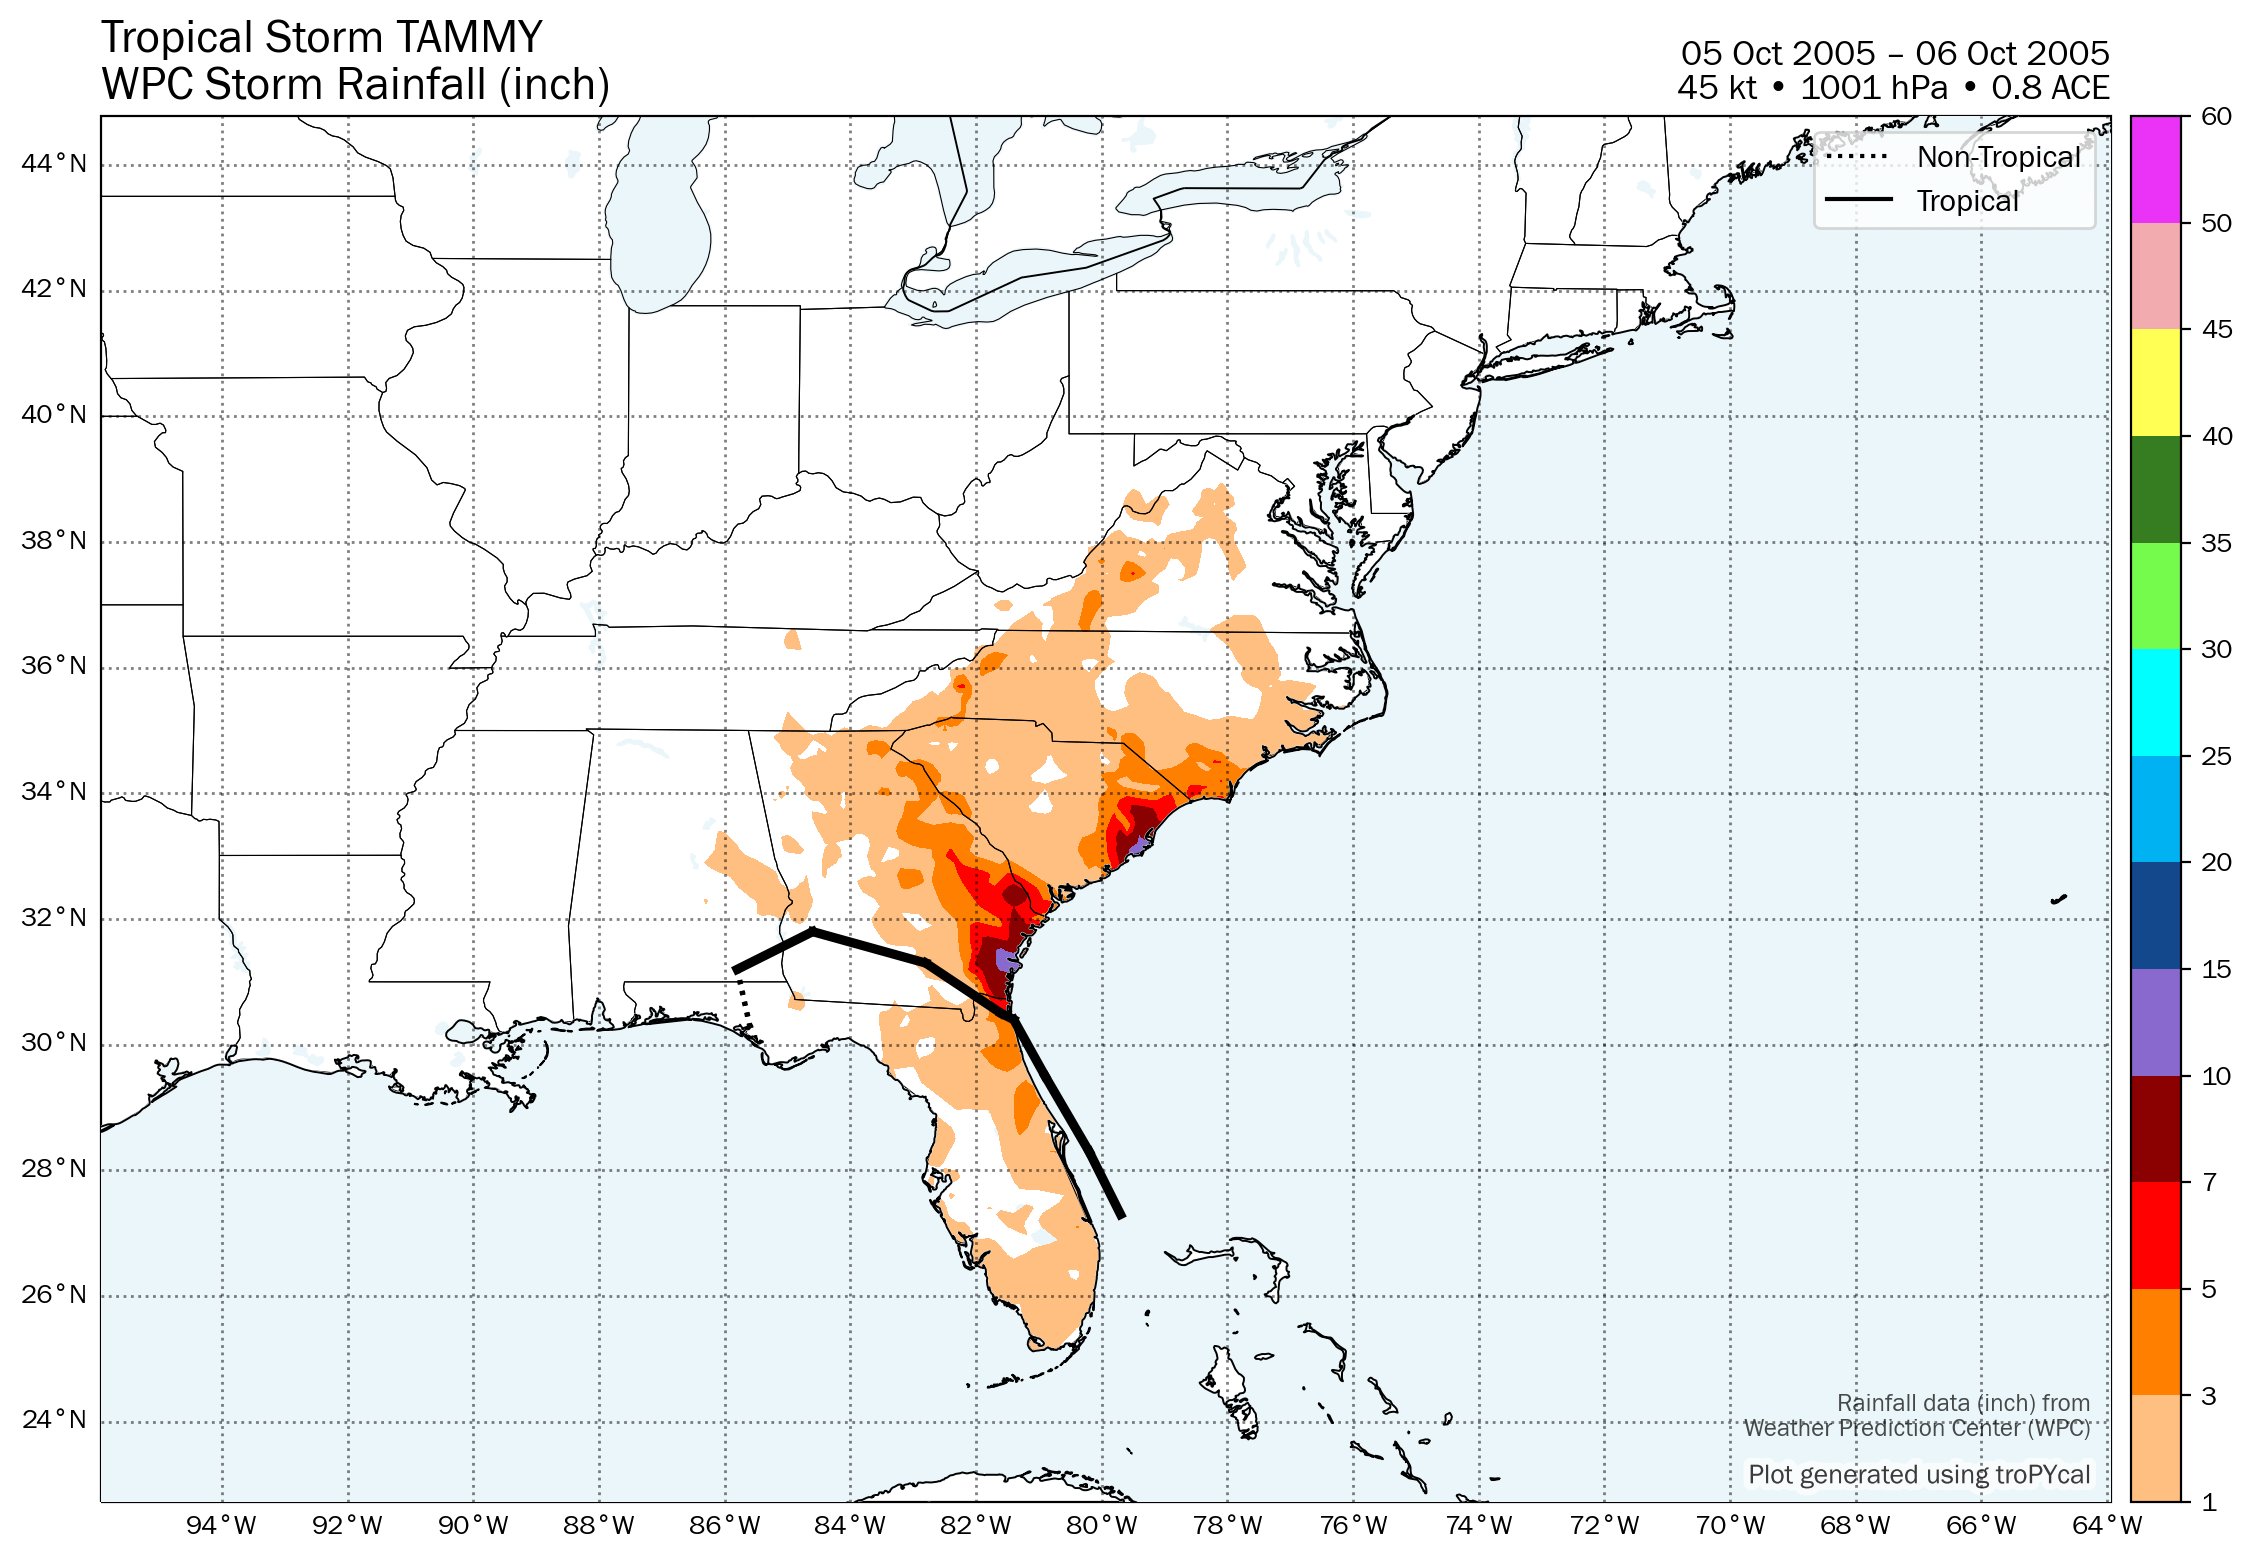
| S | Tropical Storm Tammy | 45 kt | 1001 hPa | 06z 10/05 | 18z 10/06 | 0.8 |
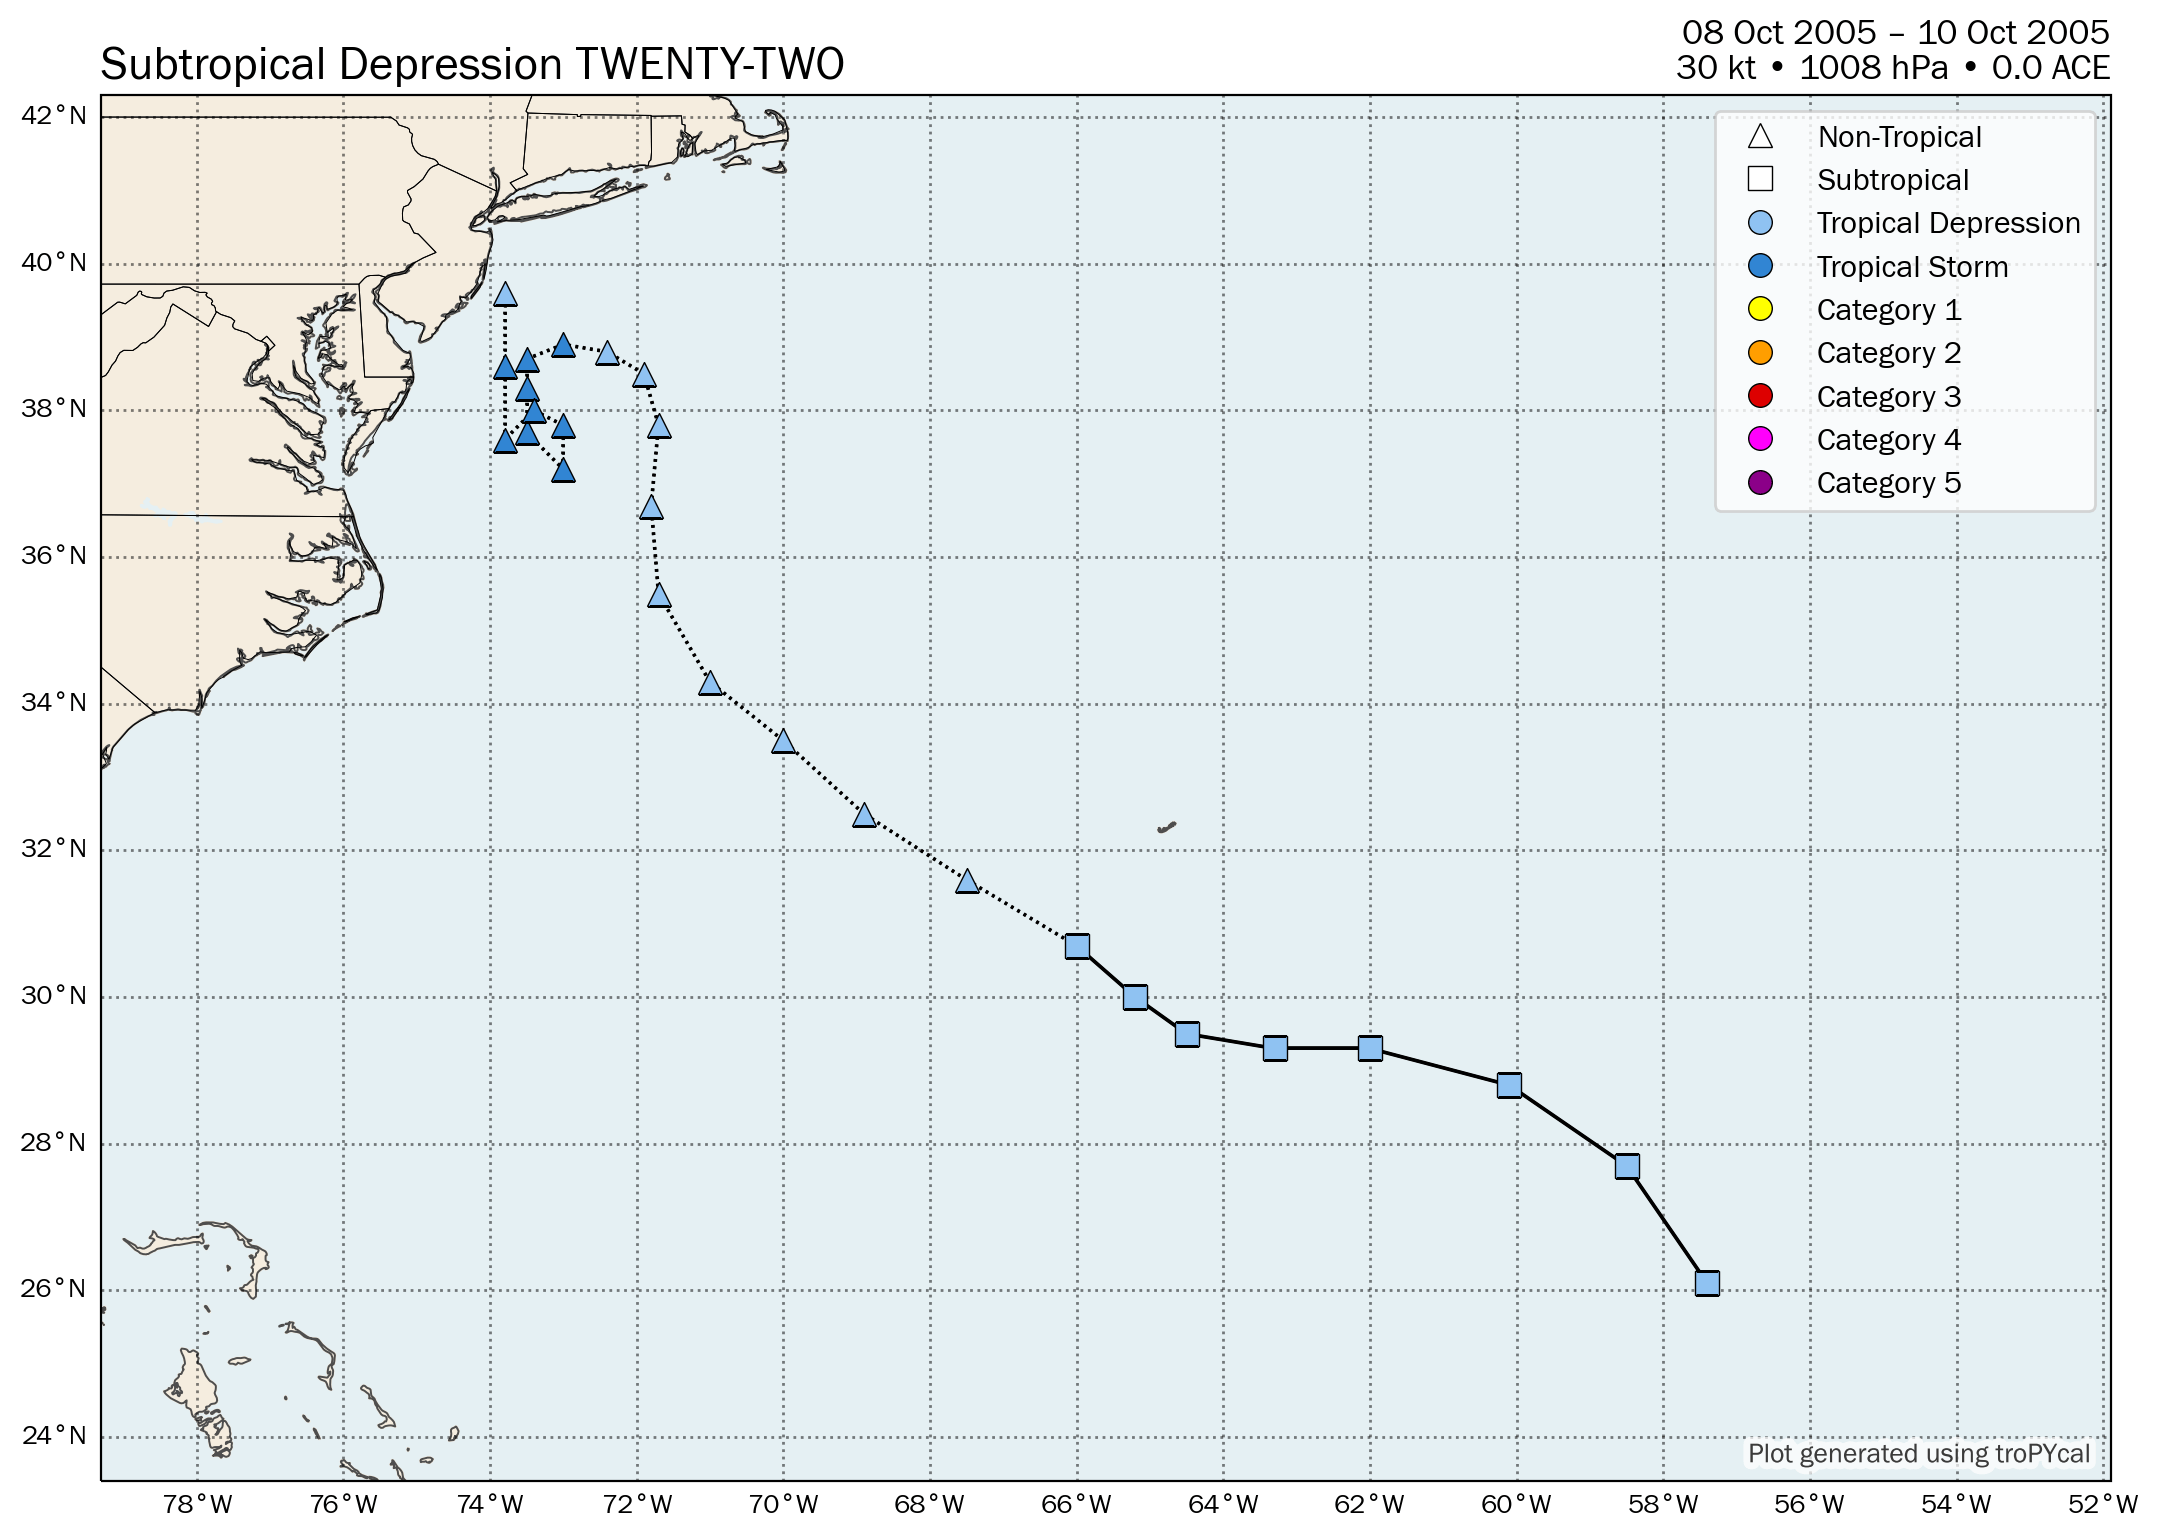
| D | Subtropical Depression Twenty-Two | 30 kt | 1008 hPa | 06z 10/08 | 00z 10/10 | 0.0 |
| 1 | Hurricane Vince | 65 kt | 988 hPa | 06z 10/08 | 12z 10/11 | 2.7 |
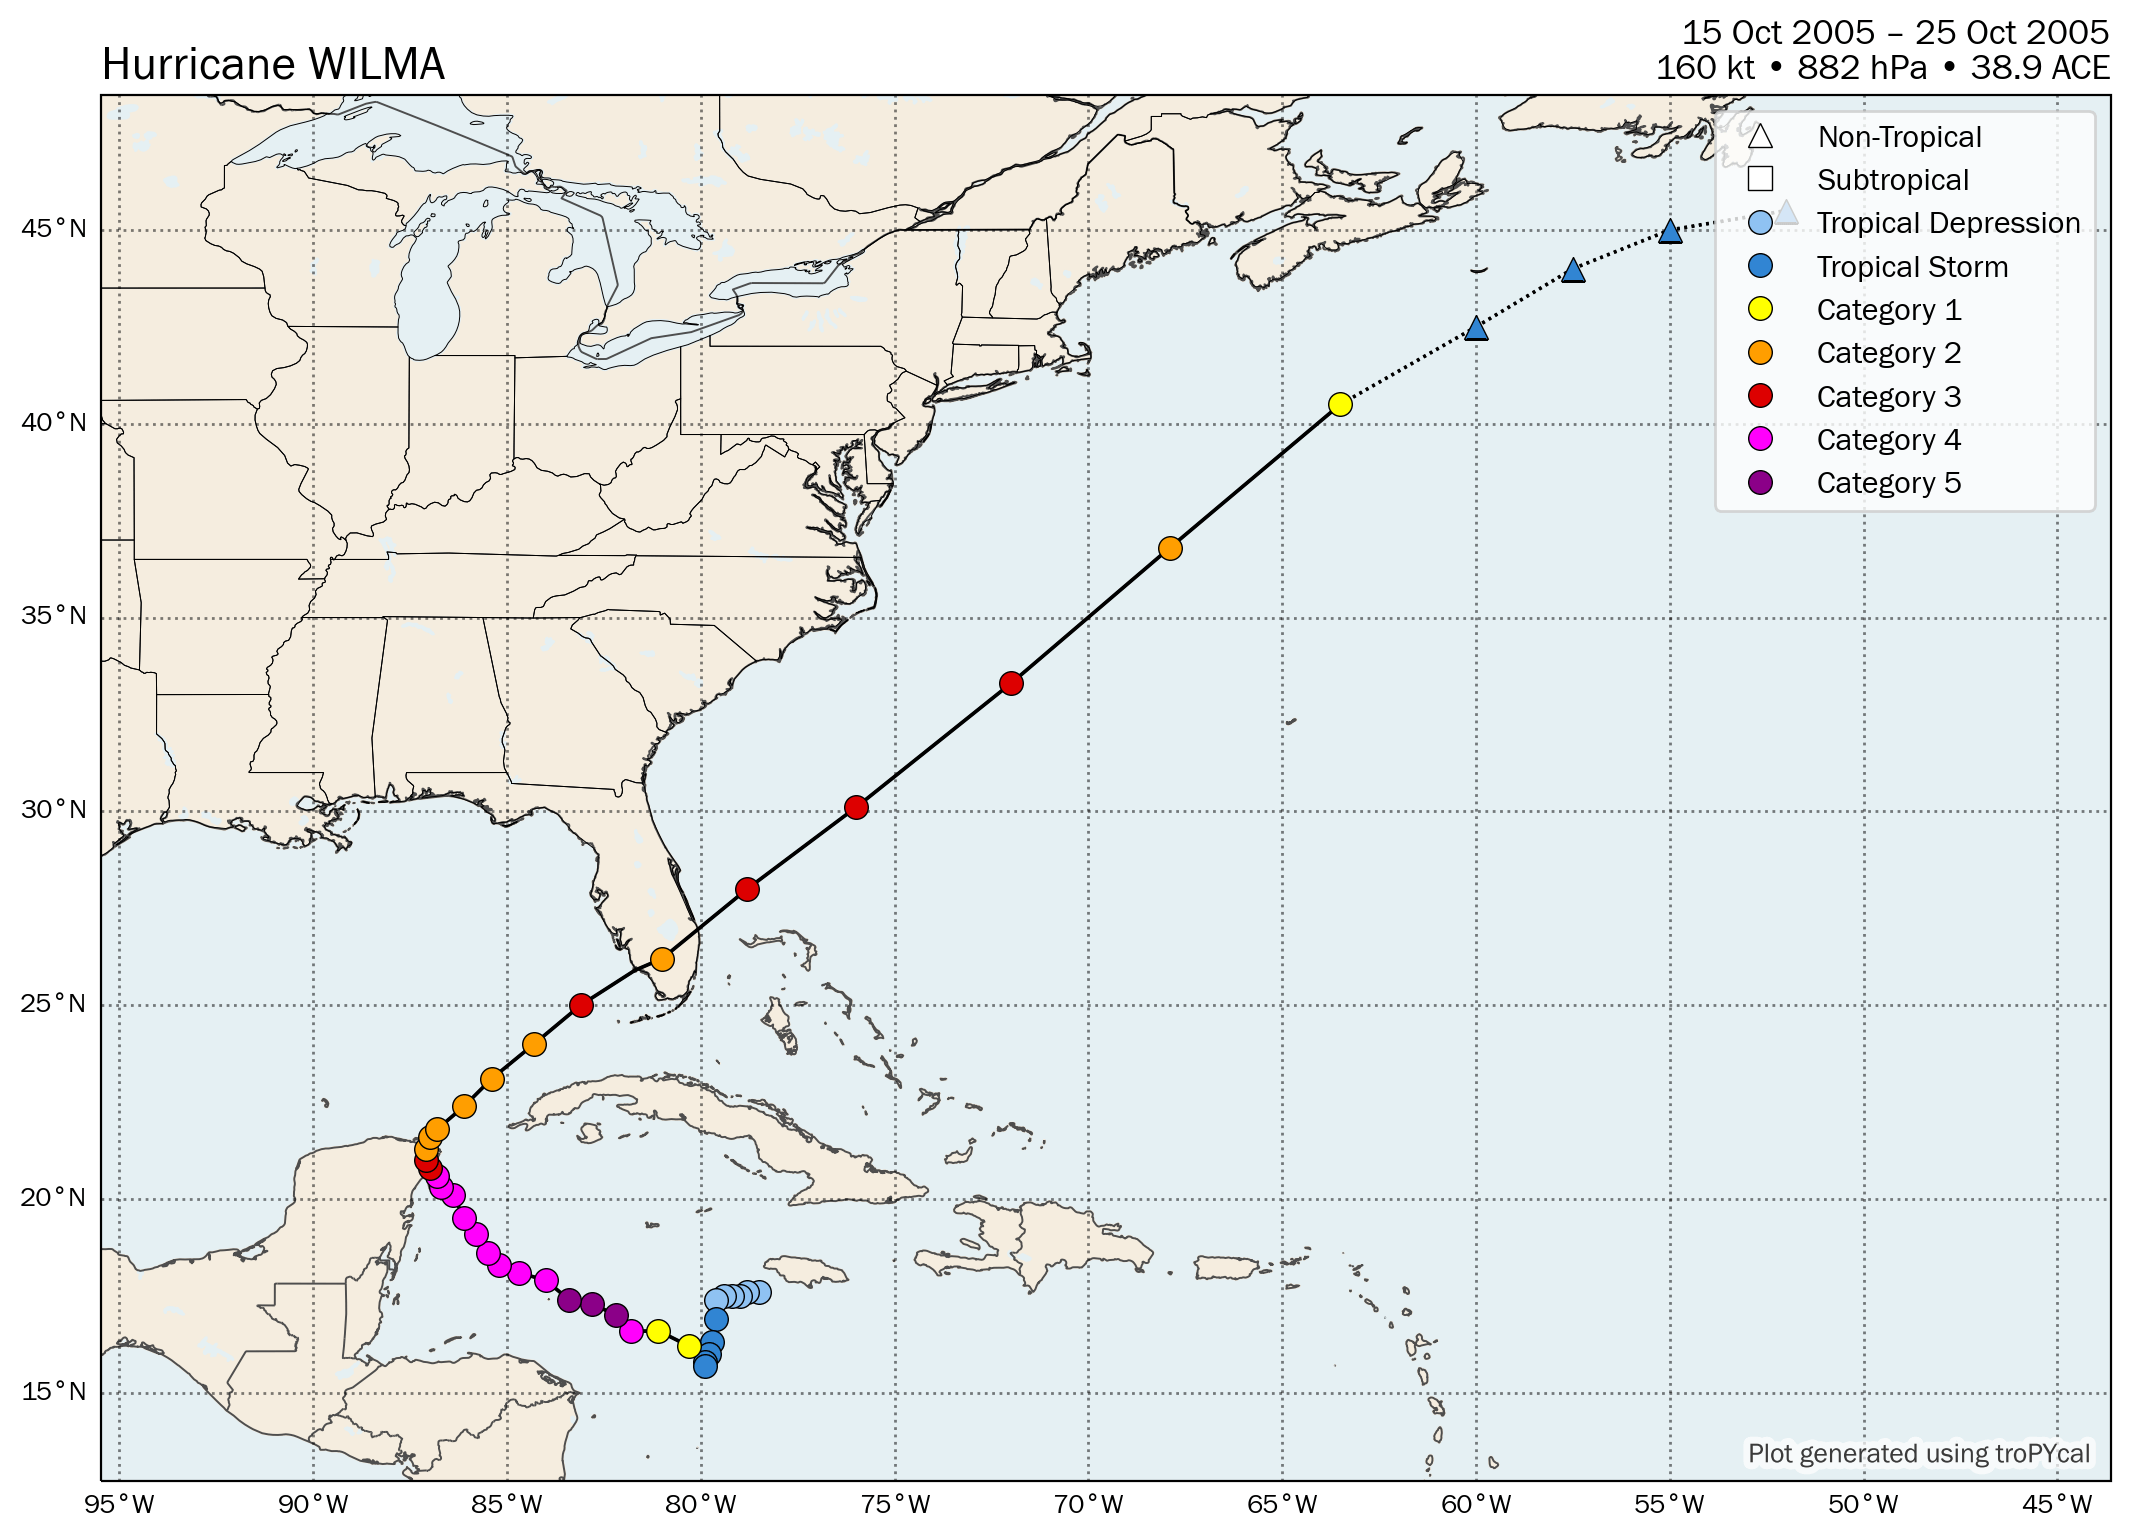
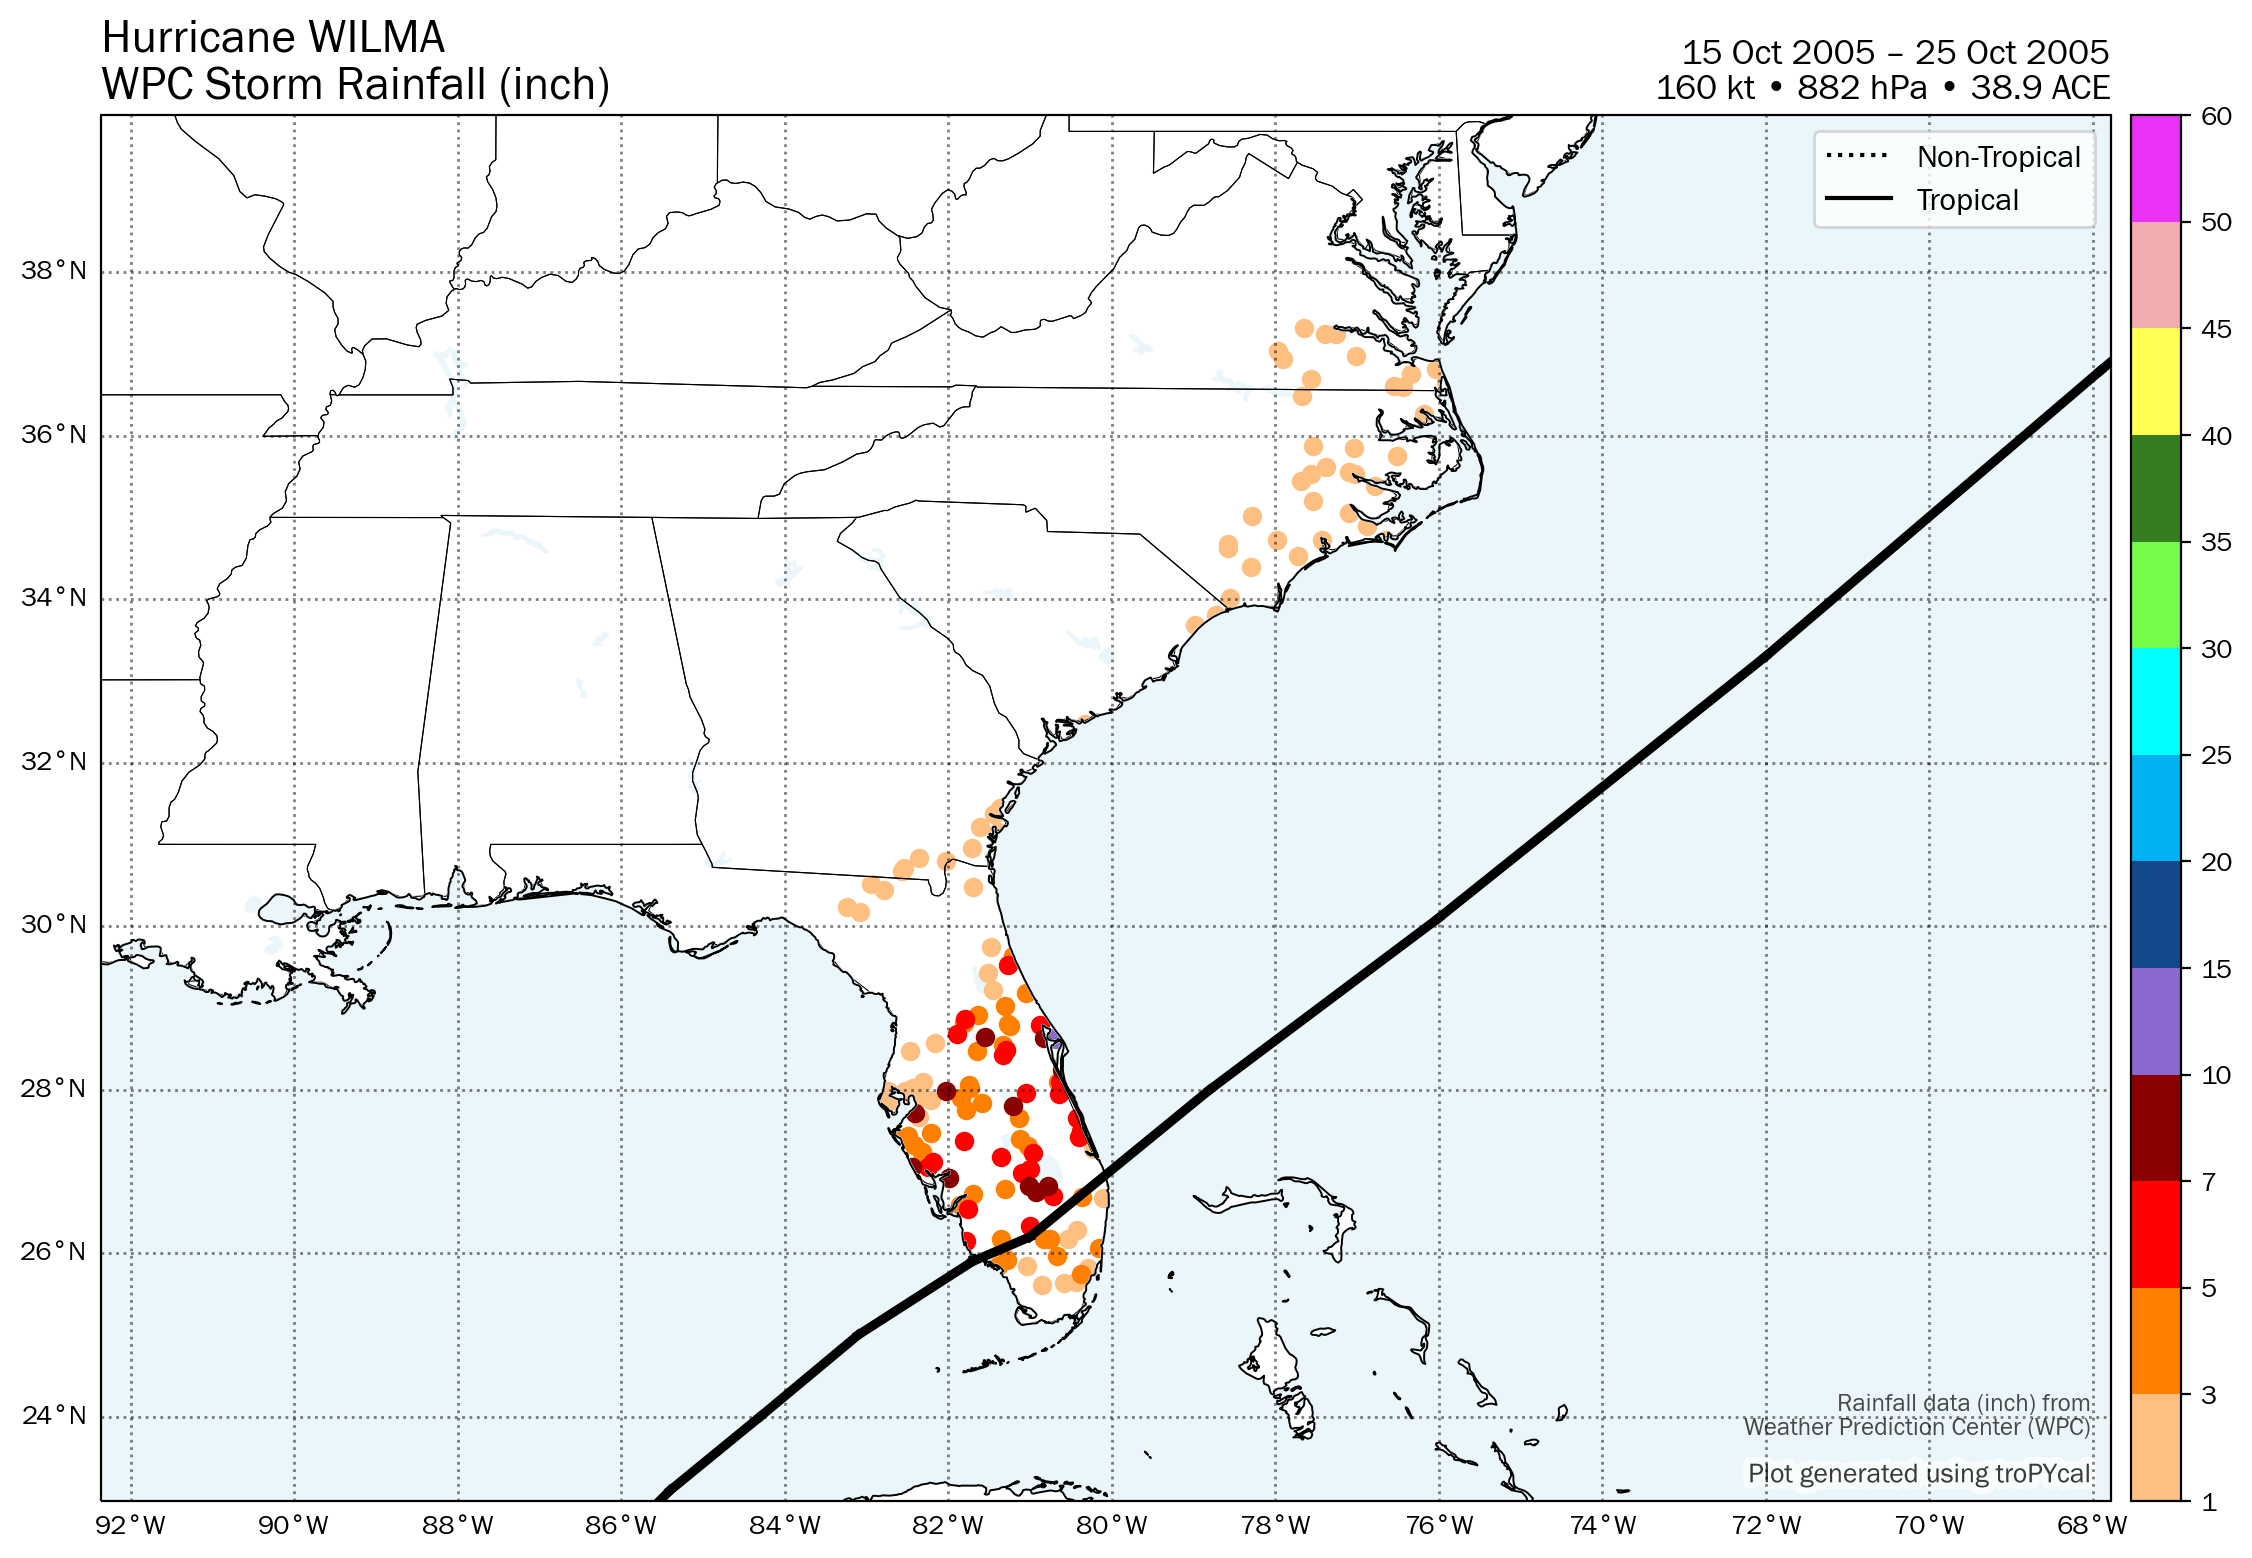
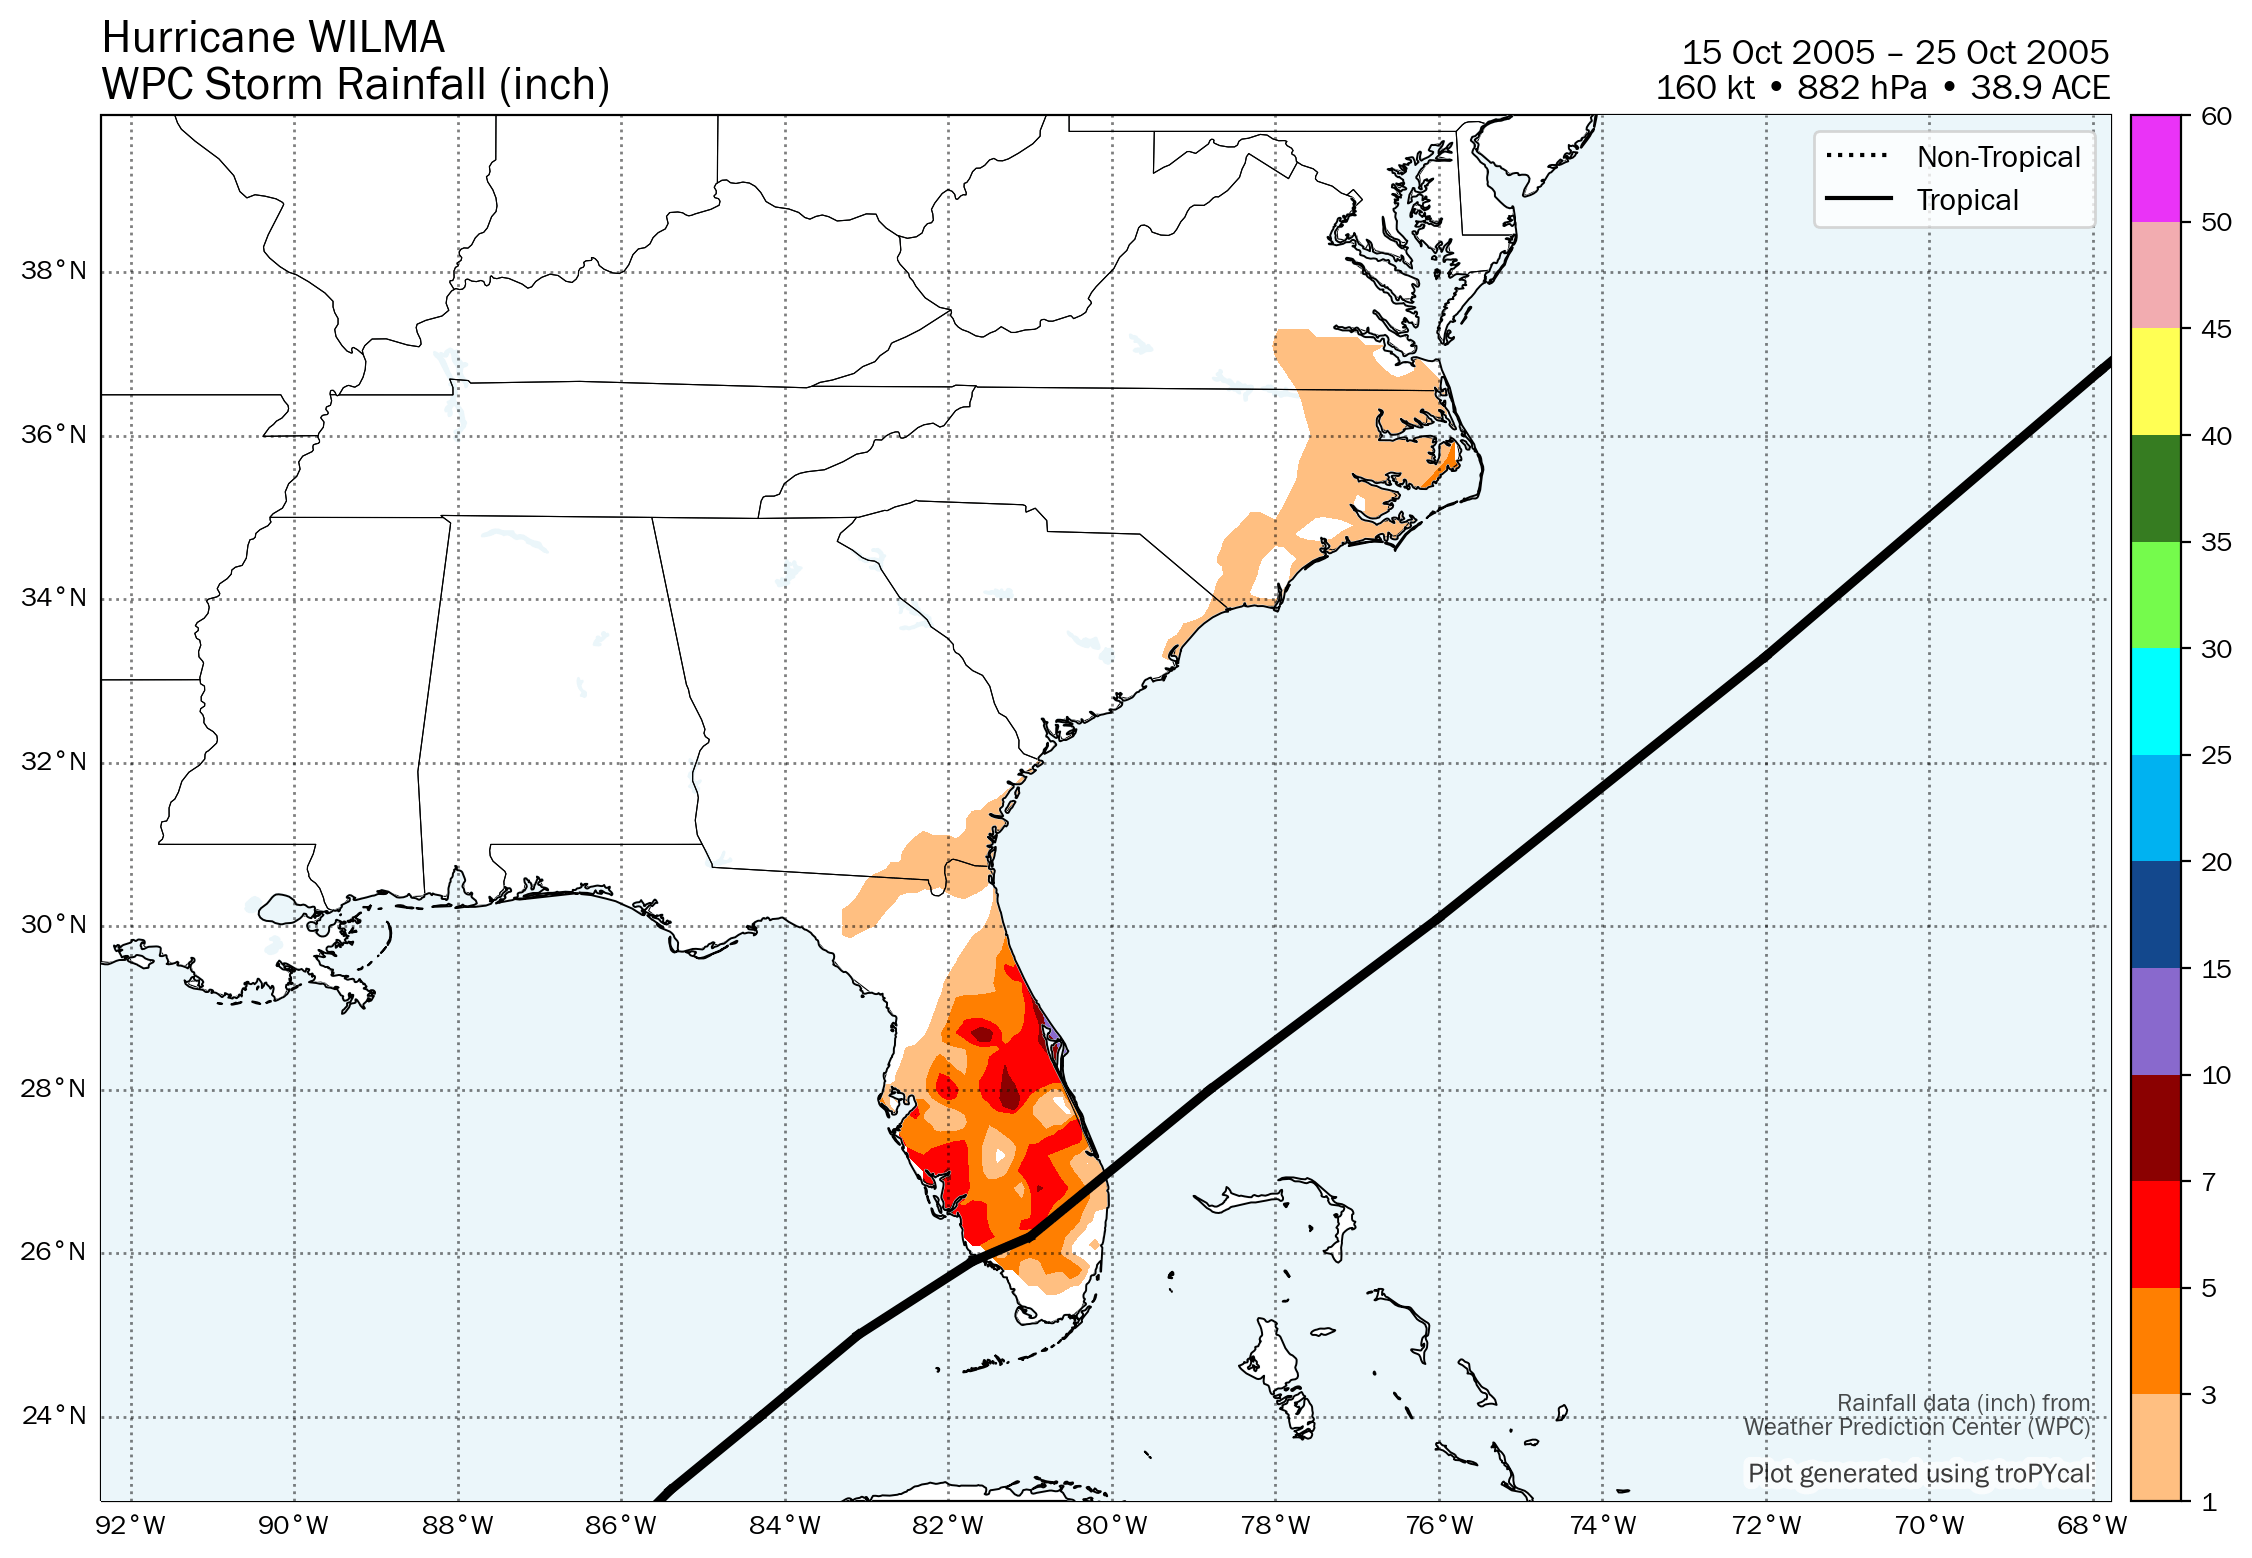
| 5 | Hurricane Wilma | 160 kt | 882 hPa | 18z 10/15 | 18z 10/25 | 38.9 |
| S | Tropical Storm Alpha | 45 kt | 998 hPa | 12z 10/22 | 18z 10/24 | 0.7 |
| 3 | Hurricane Beta | 100 kt | 962 hPa | 18z 10/26 | 00z 10/31 | 6.5 |
| S | Tropical Storm Gamma | 45 kt | 1002 hPa | 00z 11/14 | 00z 11/21 | 1.3 |
| S | Tropical Storm Delta | 60 kt | 980 hPa | 18z 11/22 | 06z 11/28 | 6.0 |
| 1 | Hurricane Epsilon | 75 kt | 981 hPa | 06z 11/29 | 12z 12/08 | 13.4 |
| S | Tropical Storm Zeta | 55 kt | 994 hPa | 00z 12/30 | 12z 01/06 | 6.3 |
Storm-Relative Tornadoes

Tornado Map
Summary Map
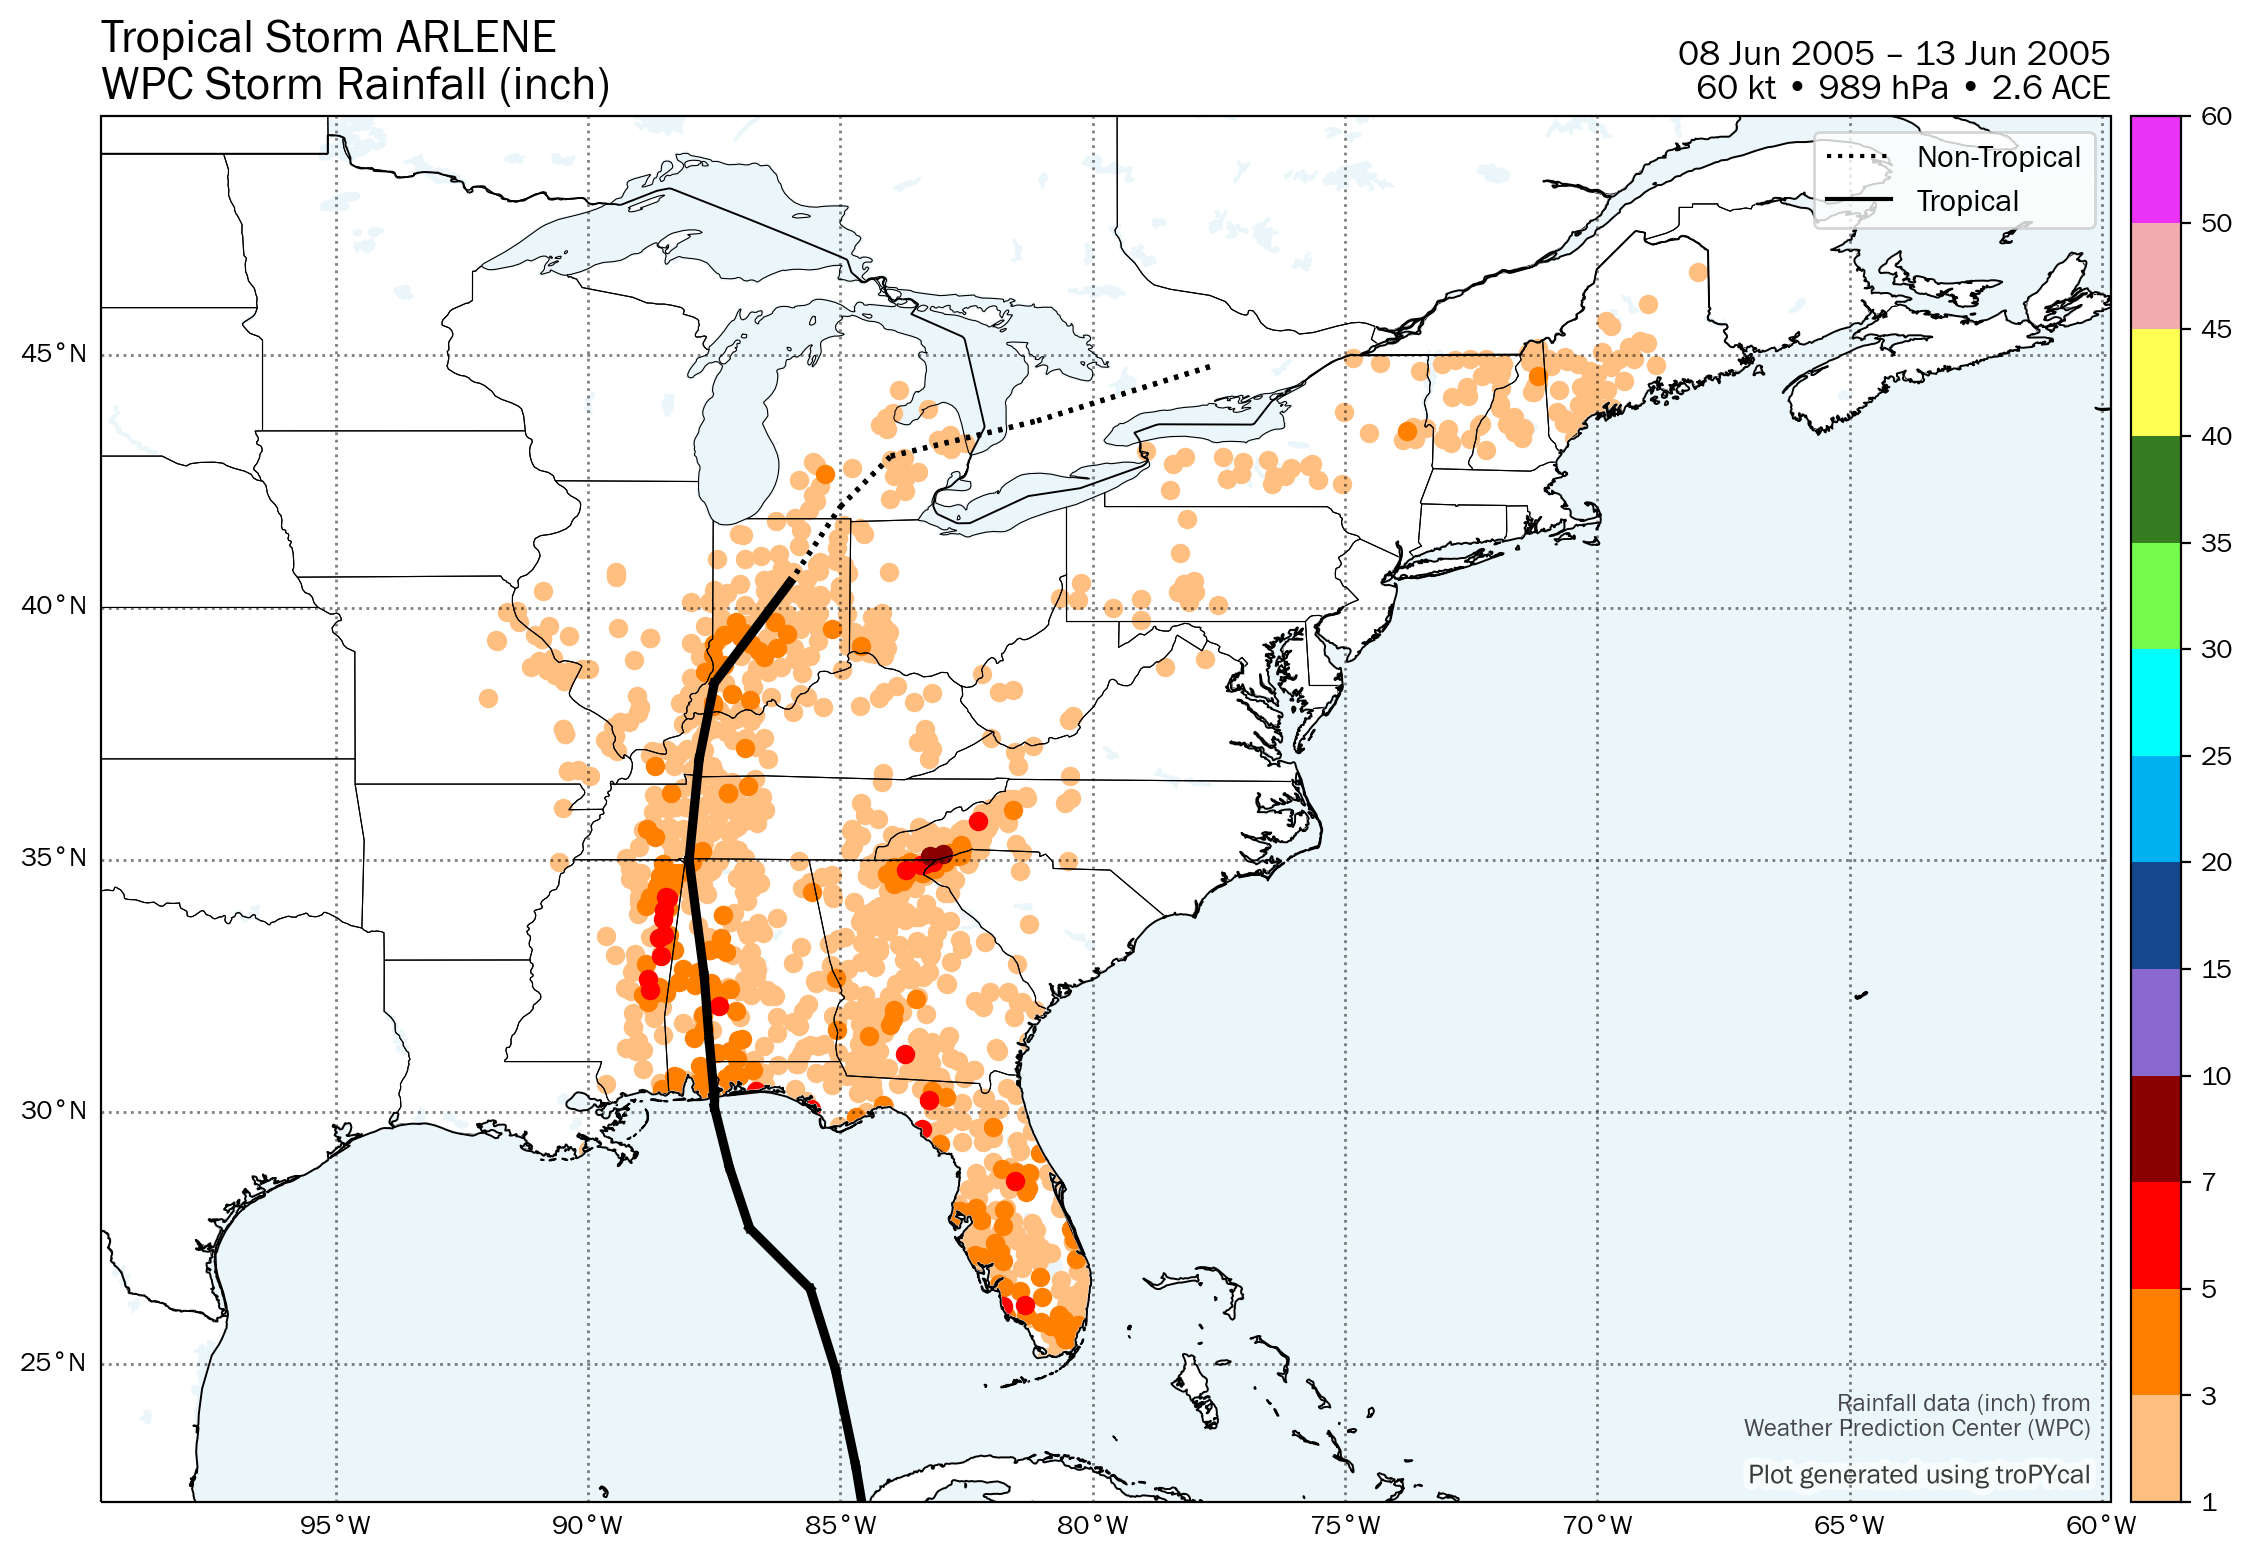
Gridded Rainfall
Summary Plot
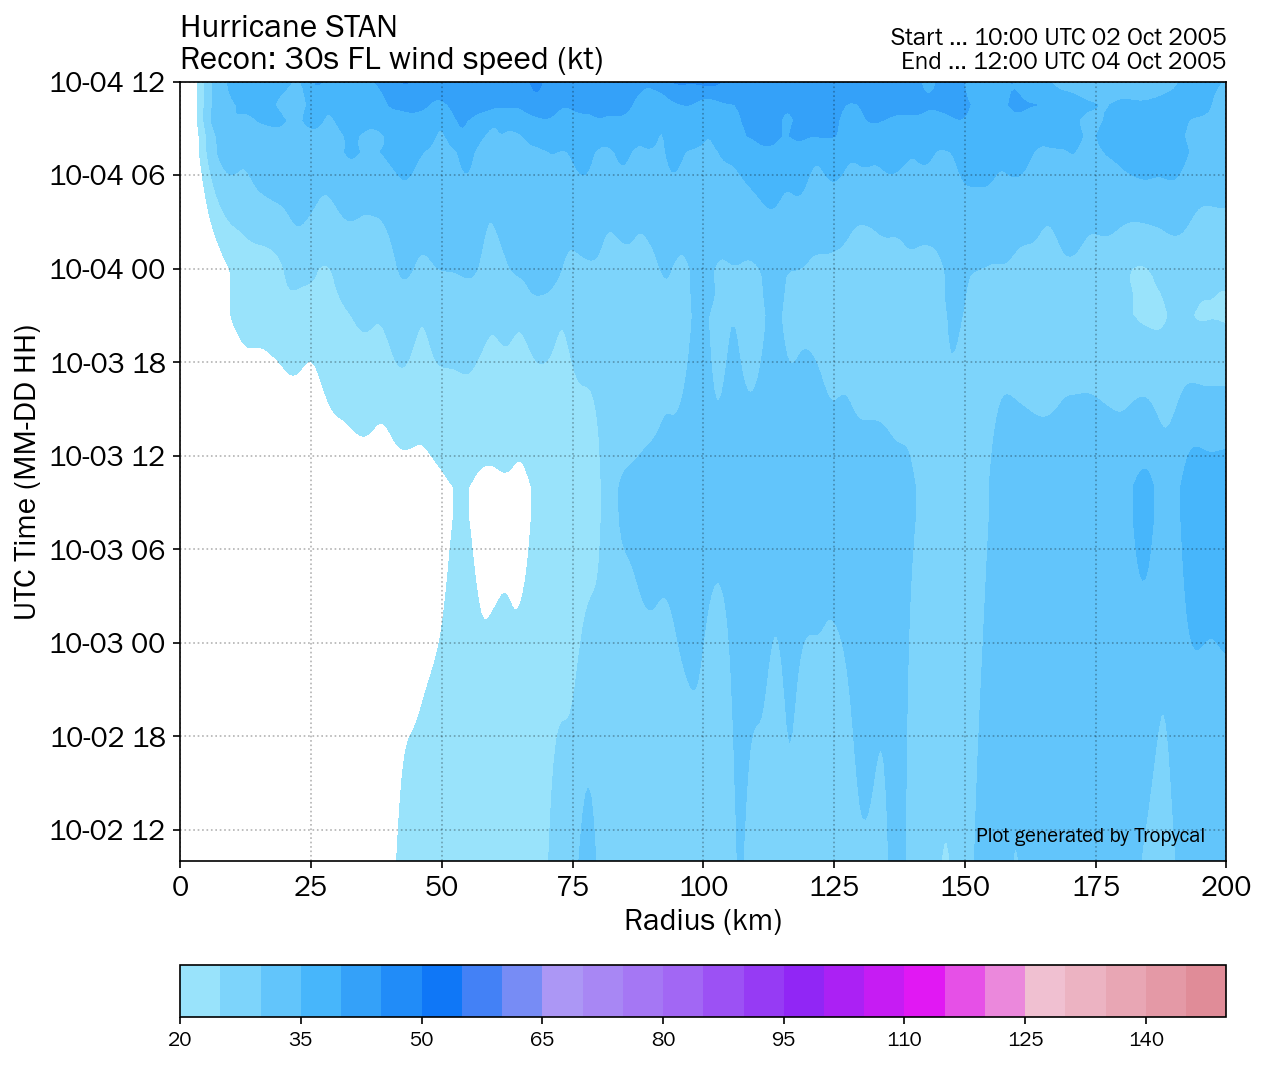
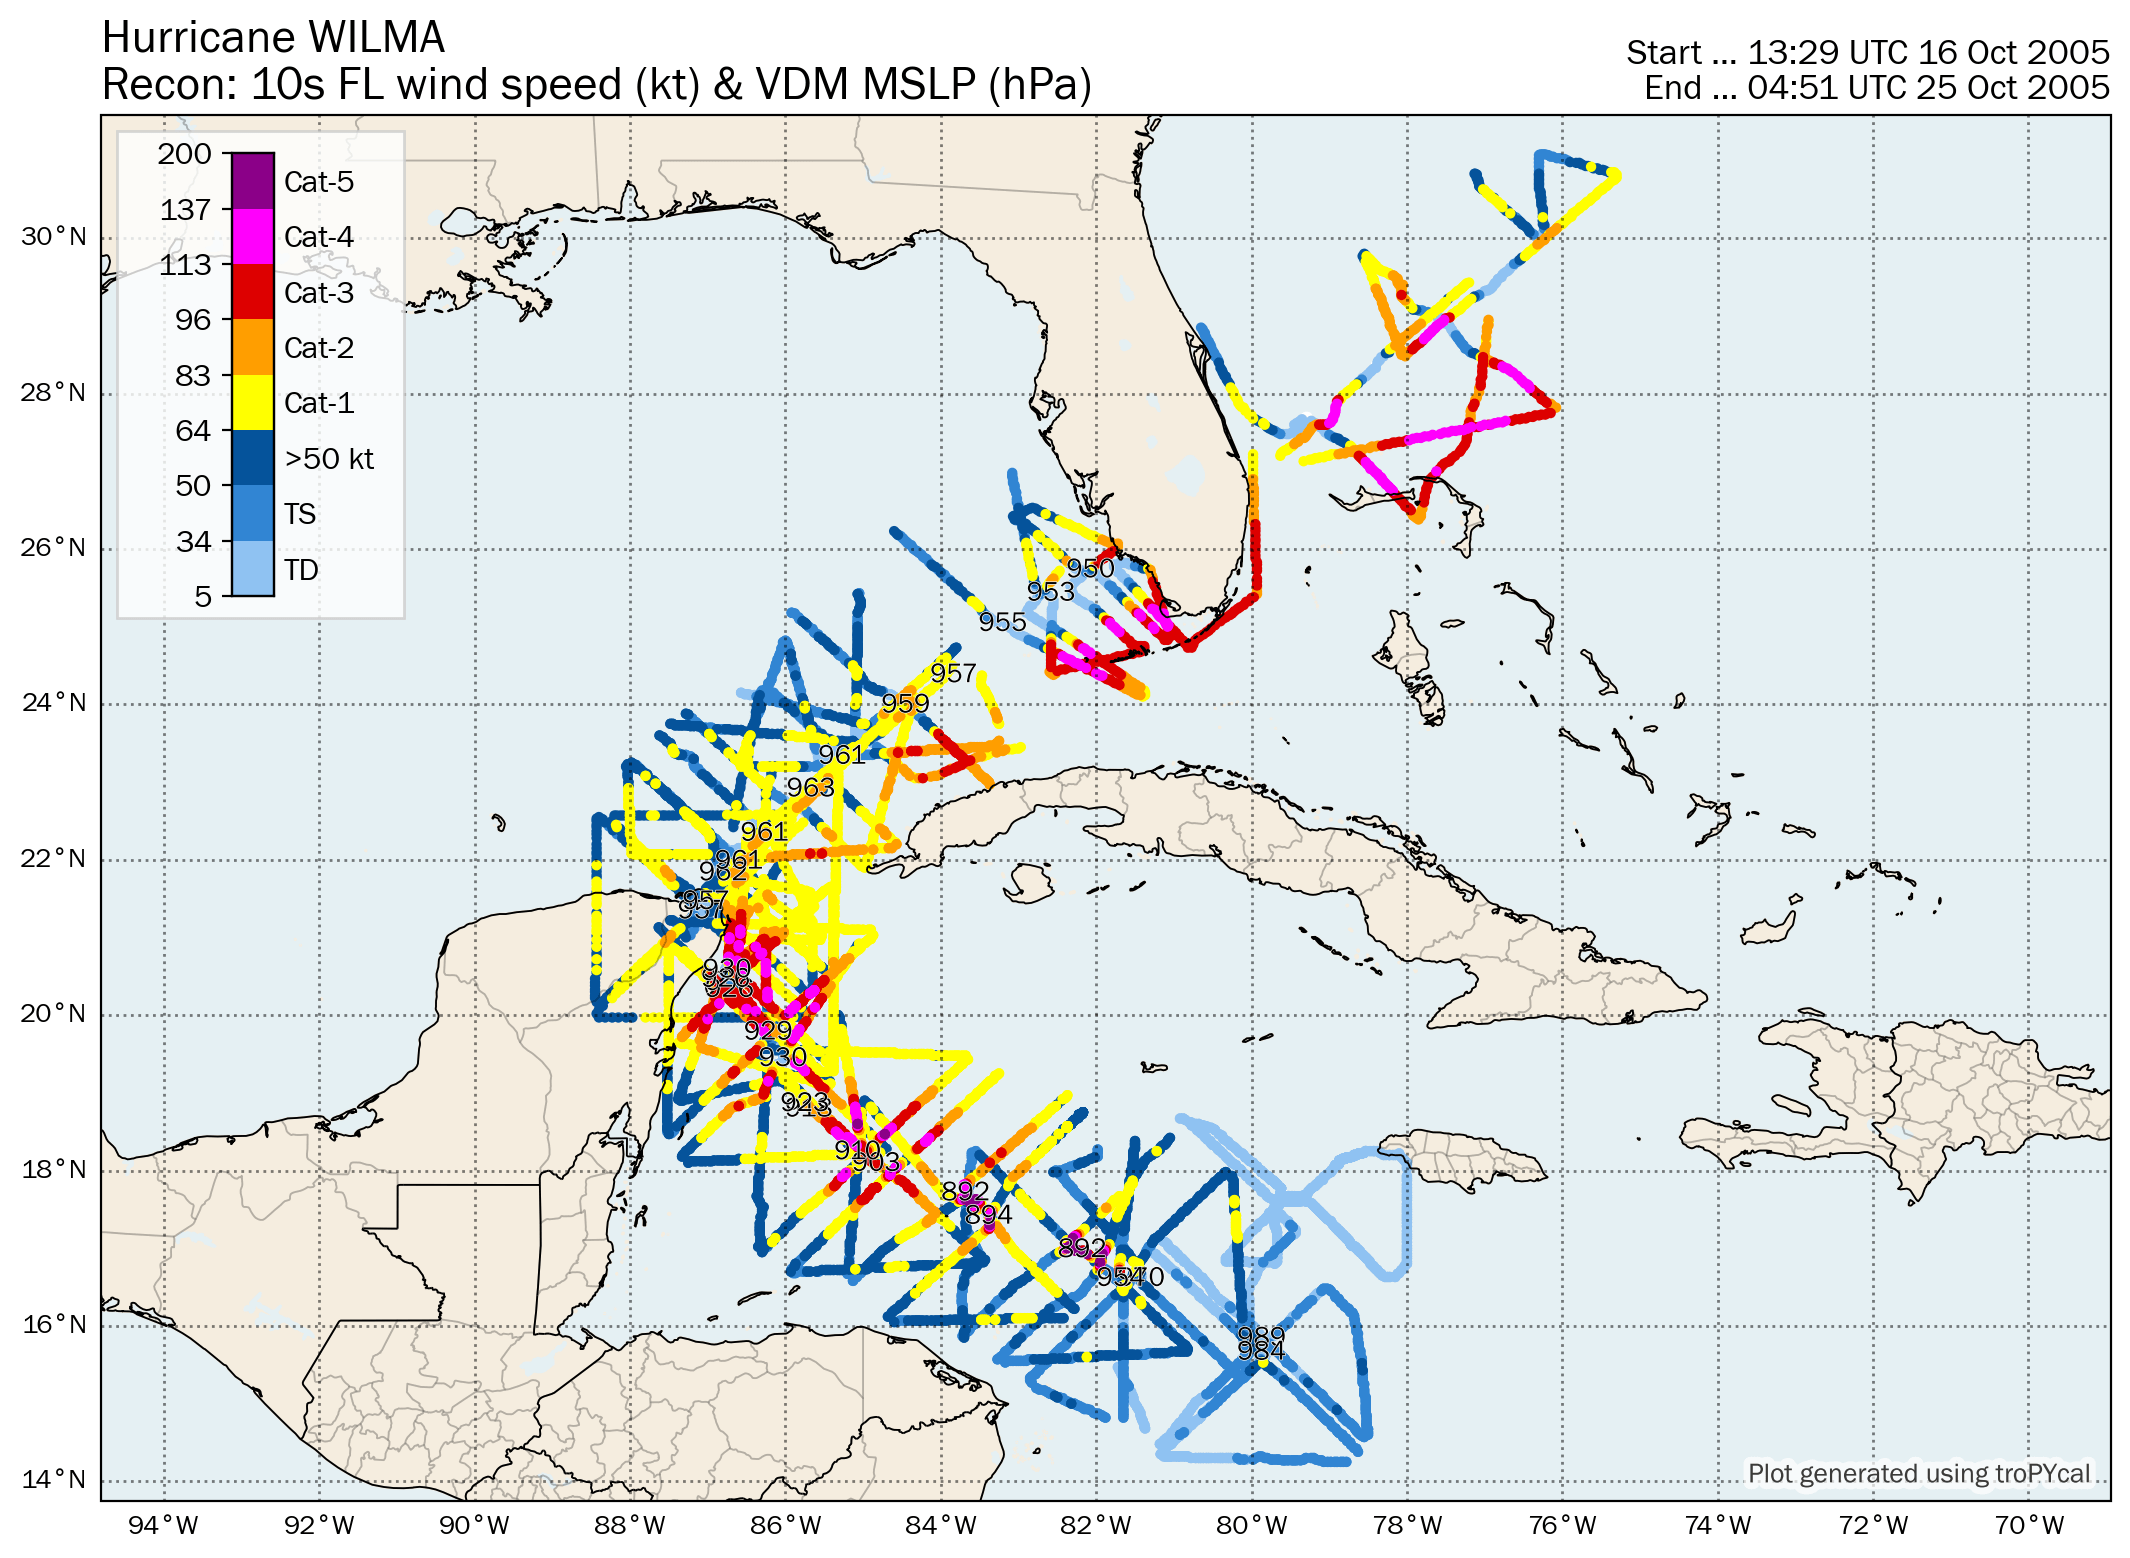
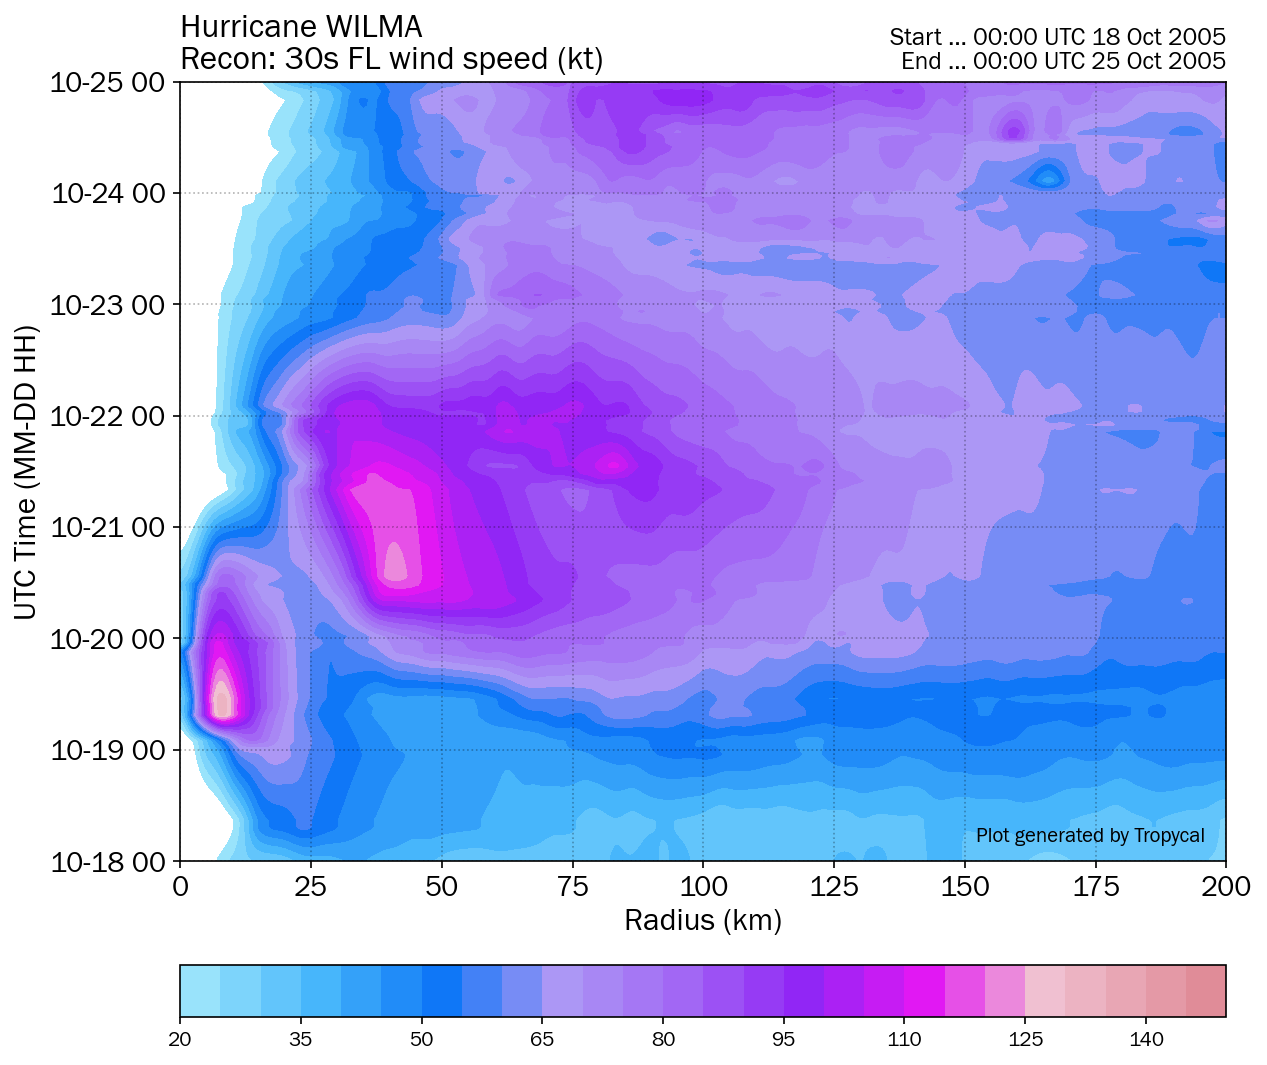
Recon-Derived Hovmoller
Recon-Derived Wind Swath
| Time (UTC) | Lat | Lon | Wind (mph) | Pressure | Storm Type | Category |
|---|---|---|---|---|---|---|
| 1800 UTC 08 Jun | 16.9 | -84.0 | 30 | 1004 | Tropical Depression | - |
| 0000 UTC 09 Jun | 17.4 | -83.9 | 35 | 1003 | Tropical Depression | - |
| 0600 UTC 09 Jun | 18.2 | -83.9 | 40 | 1003 | Tropical Storm | - |
| 1200 UTC 09 Jun | 19.0 | -84.0 | 40 | 1002 | Tropical Storm | - |
| 1800 UTC 09 Jun | 19.7 | -84.1 | 40 | 1002 | Tropical Storm | - |
| 0000 UTC 10 Jun | 20.4 | -84.2 | 45 | 1001 | Tropical Storm | - |
| 0600 UTC 10 Jun | 21.2 | -84.4 | 50 | 1000 | Tropical Storm | - |
| 0800 UTC 10 Jun | 21.8 | -84.5 | 50 | 1000 | Tropical Storm | - |
| 1200 UTC 10 Jun | 23.0 | -84.7 | 60 | 1000 | Tropical Storm | - |
| 1800 UTC 10 Jun | 24.9 | -85.1 | 65 | 995 | Tropical Storm | - |
| 0000 UTC 11 Jun | 26.5 | -85.6 | 70 | 990 | Tropical Storm | - |
| 0100 UTC 11 Jun | 26.5 | -85.6 | 70 | 989 | Tropical Storm | - |
| 0600 UTC 11 Jun | 27.7 | -86.8 | 70 | 993 | Tropical Storm | - |
| 1200 UTC 11 Jun | 28.9 | -87.2 | 65 | 990 | Tropical Storm | - |
| 1800 UTC 11 Jun | 30.1 | -87.5 | 60 | 991 | Tropical Storm | - |
| 1900 UTC 11 Jun | 30.3 | -87.5 | 60 | 991 | Tropical Storm | - |
| 0000 UTC 12 Jun | 31.4 | -87.6 | 35 | 994 | Tropical Depression | - |
| 0600 UTC 12 Jun | 32.7 | -87.7 | 30 | 998 | Tropical Depression | - |
| 1200 UTC 12 Jun | 35.0 | -88.0 | 25 | 1003 | Tropical Depression | - |
| 1800 UTC 12 Jun | 37.0 | -87.8 | 25 | 1005 | Tropical Depression | - |
| 0000 UTC 13 Jun | 38.5 | -87.5 | 25 | 1006 | Tropical Depression | - |
| 0600 UTC 13 Jun | 40.5 | -86.0 | 25 | 1006 | Tropical Depression | - |
| 1200 UTC 13 Jun | 42.0 | -85.0 | 25 | 1005 | Remnant Low | - |
| 1800 UTC 13 Jun | 43.0 | -84.0 | 25 | 1005 | Post-Tropical Cyclone | - |
| 0000 UTC 14 Jun | 43.7 | -81.1 | 25 | 1003 | Post-Tropical Cyclone | - |
| 0600 UTC 14 Jun | 44.8 | -77.6 | 25 | 1001 | Post-Tropical Cyclone | - |
| Time (UTC) | Lat | Lon | Wind (mph) | Pressure | Storm Type | Category |
|---|---|---|---|---|---|---|
| 1800 UTC 28 Jun | 19.7 | -95.4 | 35 | 1006 | Tropical Depression | - |
| 2235 UTC 28 Jun | 19.9 | -95.7 | 40 | 1002 | Tropical Storm | - |
| 0000 UTC 29 Jun | 20.0 | -95.8 | 40 | 1005 | Tropical Storm | - |
| 0600 UTC 29 Jun | 20.4 | -96.4 | 40 | 1005 | Tropical Storm | - |
| 1200 UTC 29 Jun | 20.8 | -97.3 | 40 | 1005 | Tropical Storm | - |
| 1800 UTC 29 Jun | 21.4 | -98.1 | 30 | 1007 | Tropical Depression | - |
| 0000 UTC 30 Jun | 22.0 | -98.5 | 30 | 1008 | Tropical Depression | - |
Storm-Relative Tornadoes
Tornado Map
Summary Map
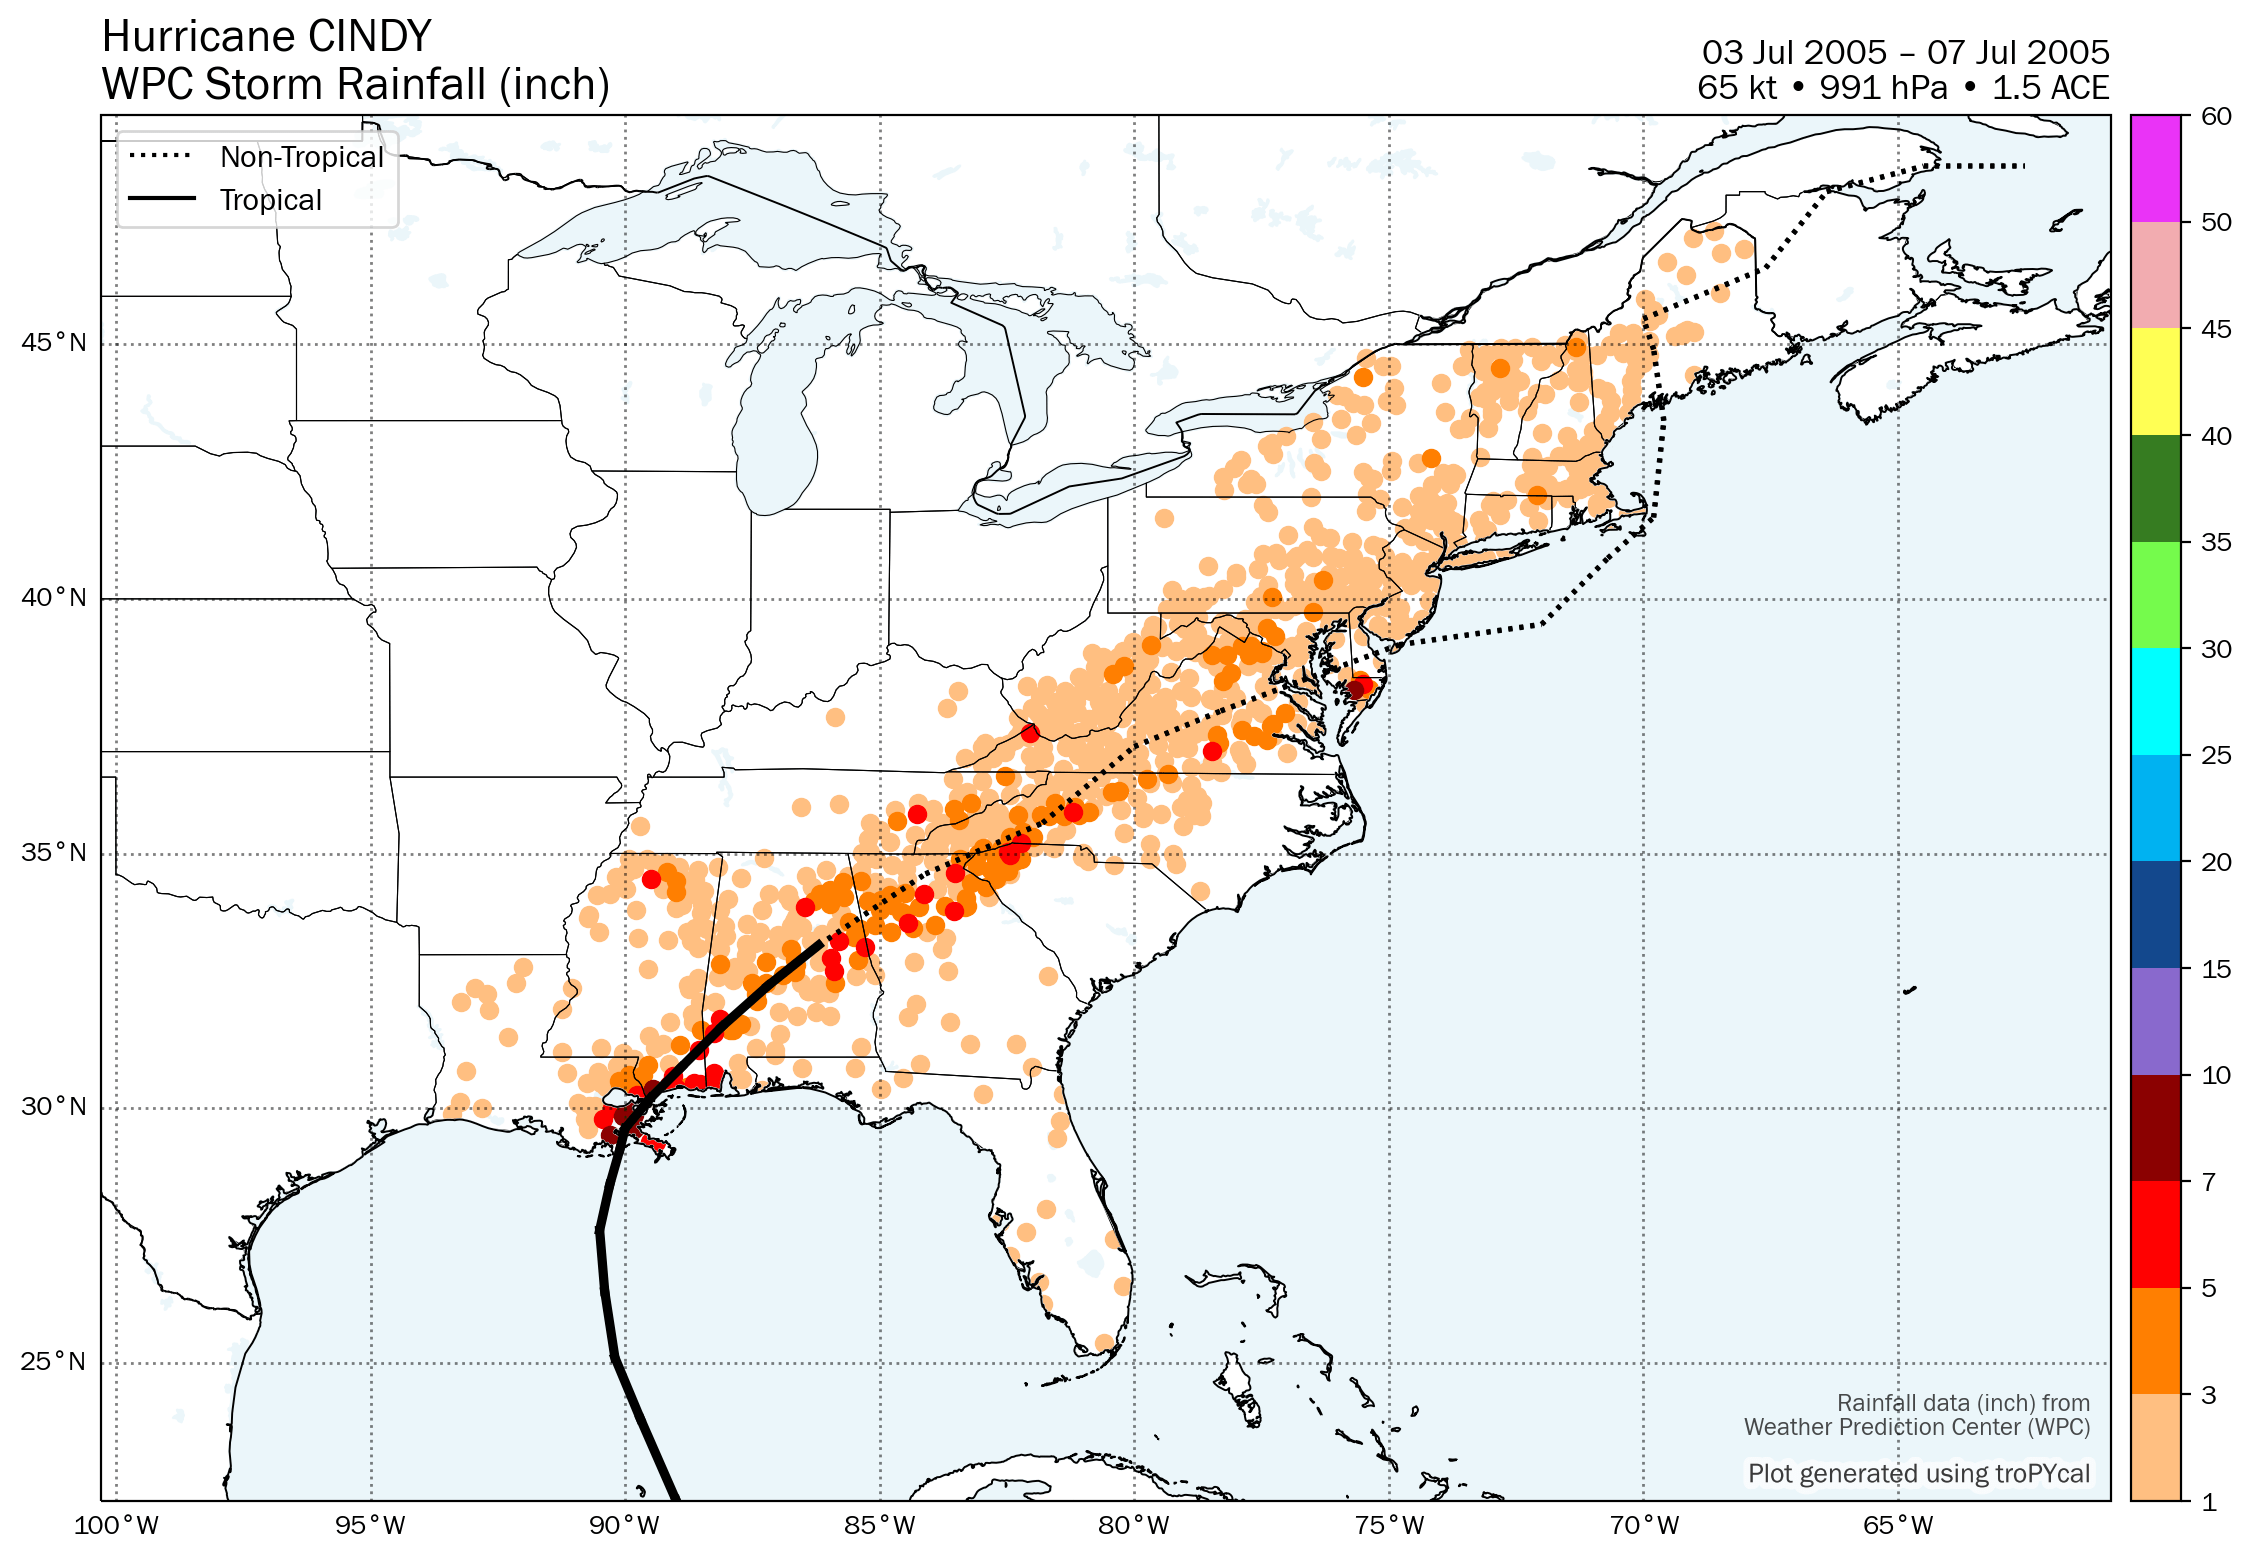
Gridded Rainfall
Summary Plot
Recon-Derived Hovmoller
Recon-Derived Wind Swath
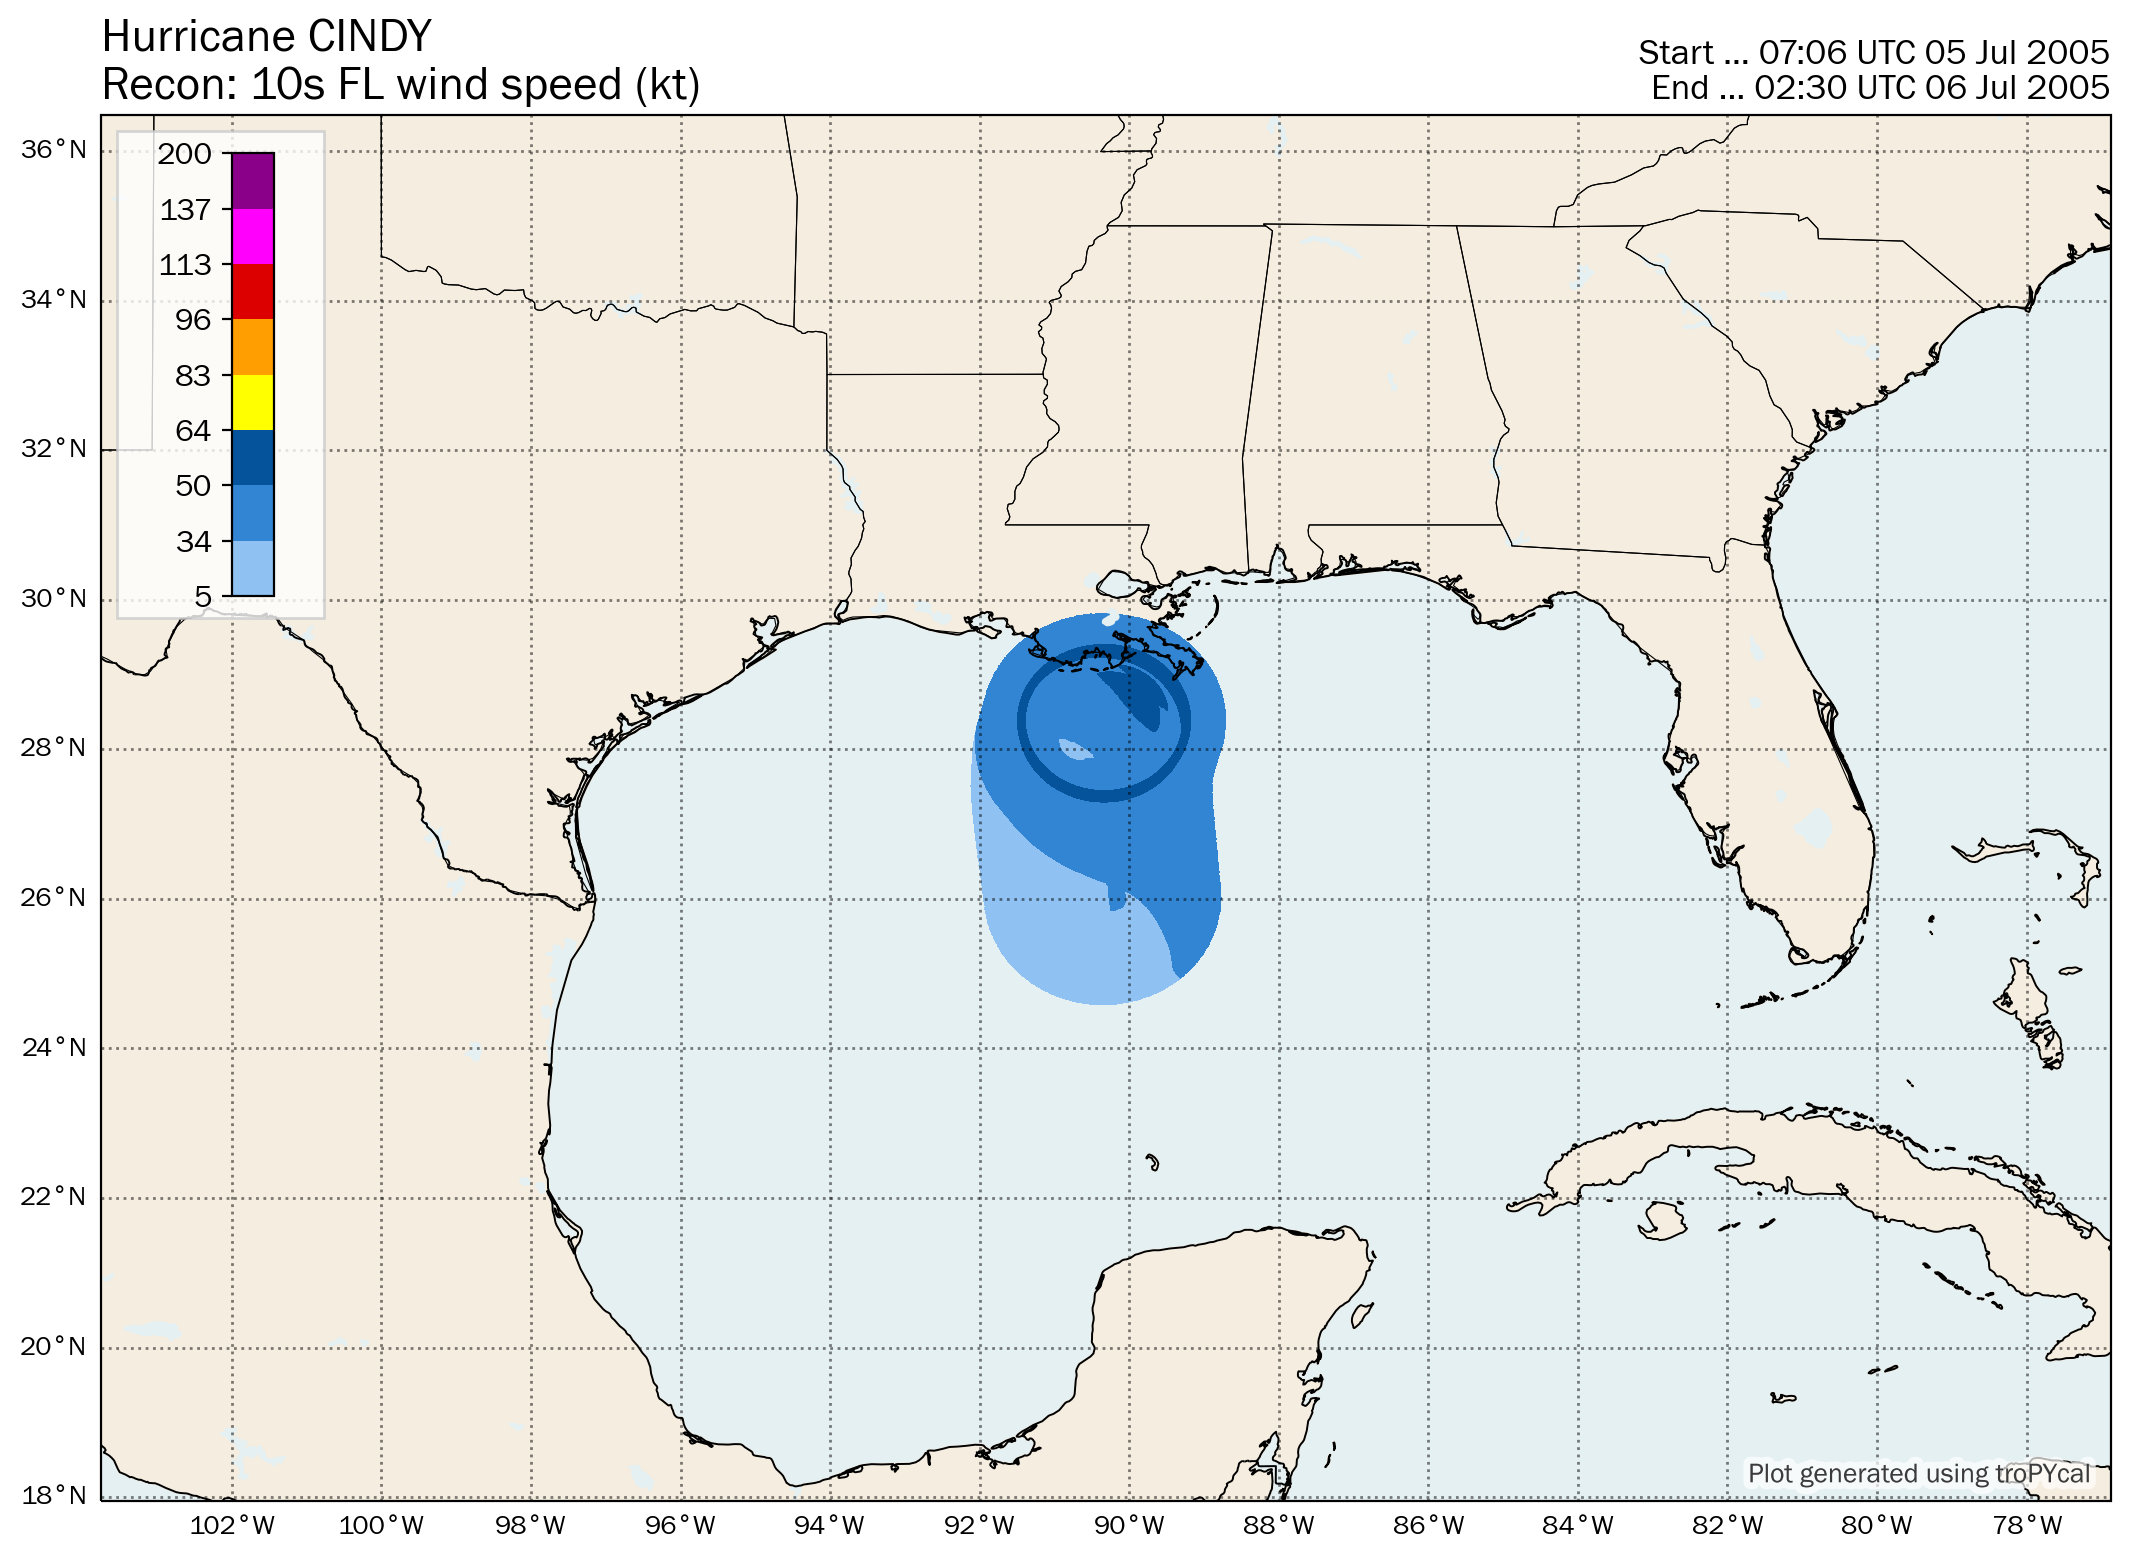
| Time (UTC) | Lat | Lon | Wind (mph) | Pressure | Storm Type | Category |
|---|---|---|---|---|---|---|
| 1800 UTC 03 Jul | 18.3 | -86.7 | 35 | 1009 | Tropical Depression | - |
| 0000 UTC 04 Jul | 18.6 | -87.2 | 35 | 1007 | Tropical Depression | - |
| 0330 UTC 04 Jul | 19.0 | -87.6 | 35 | 1007 | Tropical Depression | - |
| 0600 UTC 04 Jul | 19.3 | -87.9 | 35 | 1007 | Tropical Depression | - |
| 1200 UTC 04 Jul | 20.9 | -88.5 | 30 | 1011 | Tropical Depression | - |
| 1800 UTC 04 Jul | 22.3 | -89.0 | 35 | 1010 | Tropical Depression | - |
| 0000 UTC 05 Jul | 23.9 | -89.7 | 35 | 1009 | Tropical Depression | - |
| 0600 UTC 05 Jul | 25.1 | -90.2 | 40 | 1009 | Tropical Storm | - |
| 1200 UTC 05 Jul | 26.4 | -90.4 | 50 | 1002 | Tropical Storm | - |
| 1800 UTC 05 Jul | 27.6 | -90.5 | 70 | 997 | Tropical Storm | - |
| 0000 UTC 06 Jul | 28.5 | -90.3 | 75 | 992 | Hurricane | 1 |
| 0300 UTC 06 Jul | 29.2 | -90.1 | 75 | 991 | Hurricane | 1 |
| 0600 UTC 06 Jul | 29.6 | -90.0 | 60 | 994 | Tropical Storm | - |
| 0900 UTC 06 Jul | 30.2 | -89.5 | 50 | 995 | Tropical Storm | - |
| 1200 UTC 06 Jul | 30.8 | -88.9 | 45 | 998 | Tropical Storm | - |
| 1800 UTC 06 Jul | 31.6 | -88.1 | 35 | 1000 | Tropical Depression | - |
| 0000 UTC 07 Jul | 32.4 | -87.2 | 30 | 1004 | Tropical Depression | - |
| 0600 UTC 07 Jul | 33.2 | -86.2 | 25 | 1008 | Tropical Depression | - |
| 1200 UTC 07 Jul | 34.6 | -84.1 | 25 | 1009 | Post-Tropical Cyclone | - |
| 1800 UTC 07 Jul | 35.6 | -81.8 | 25 | 1010 | Post-Tropical Cyclone | - |
| 0000 UTC 08 Jul | 37.1 | -80.0 | 25 | 1010 | Post-Tropical Cyclone | - |
| 0600 UTC 08 Jul | 37.8 | -78.3 | 25 | 1010 | Post-Tropical Cyclone | - |
| 1200 UTC 08 Jul | 38.4 | -76.7 | 30 | 1009 | Post-Tropical Cyclone | - |
| 1800 UTC 08 Jul | 39.1 | -74.8 | 30 | 1009 | Post-Tropical Cyclone | - |
| 0000 UTC 09 Jul | 39.5 | -72.0 | 30 | 1009 | Post-Tropical Cyclone | - |
| 0600 UTC 09 Jul | 40.8 | -70.7 | 30 | 1009 | Post-Tropical Cyclone | - |
| 1200 UTC 09 Jul | 41.6 | -69.8 | 35 | 1007 | Post-Tropical Cyclone | - |
| 1800 UTC 09 Jul | 43.5 | -69.6 | 35 | 1006 | Post-Tropical Cyclone | - |
| 0000 UTC 10 Jul | 44.9 | -69.8 | 35 | 1006 | Post-Tropical Cyclone | - |
| 0600 UTC 10 Jul | 45.5 | -70.0 | 35 | 1006 | Post-Tropical Cyclone | - |
| 1200 UTC 10 Jul | 46.5 | -67.6 | 30 | 1006 | Post-Tropical Cyclone | - |
| 1800 UTC 10 Jul | 48.0 | -66.4 | 25 | 1006 | Post-Tropical Cyclone | - |
| 0000 UTC 11 Jul | 48.5 | -64.5 | 25 | 1006 | Post-Tropical Cyclone | - |
| 0600 UTC 11 Jul | 48.5 | -62.5 | 25 | 1006 | Post-Tropical Cyclone | - |
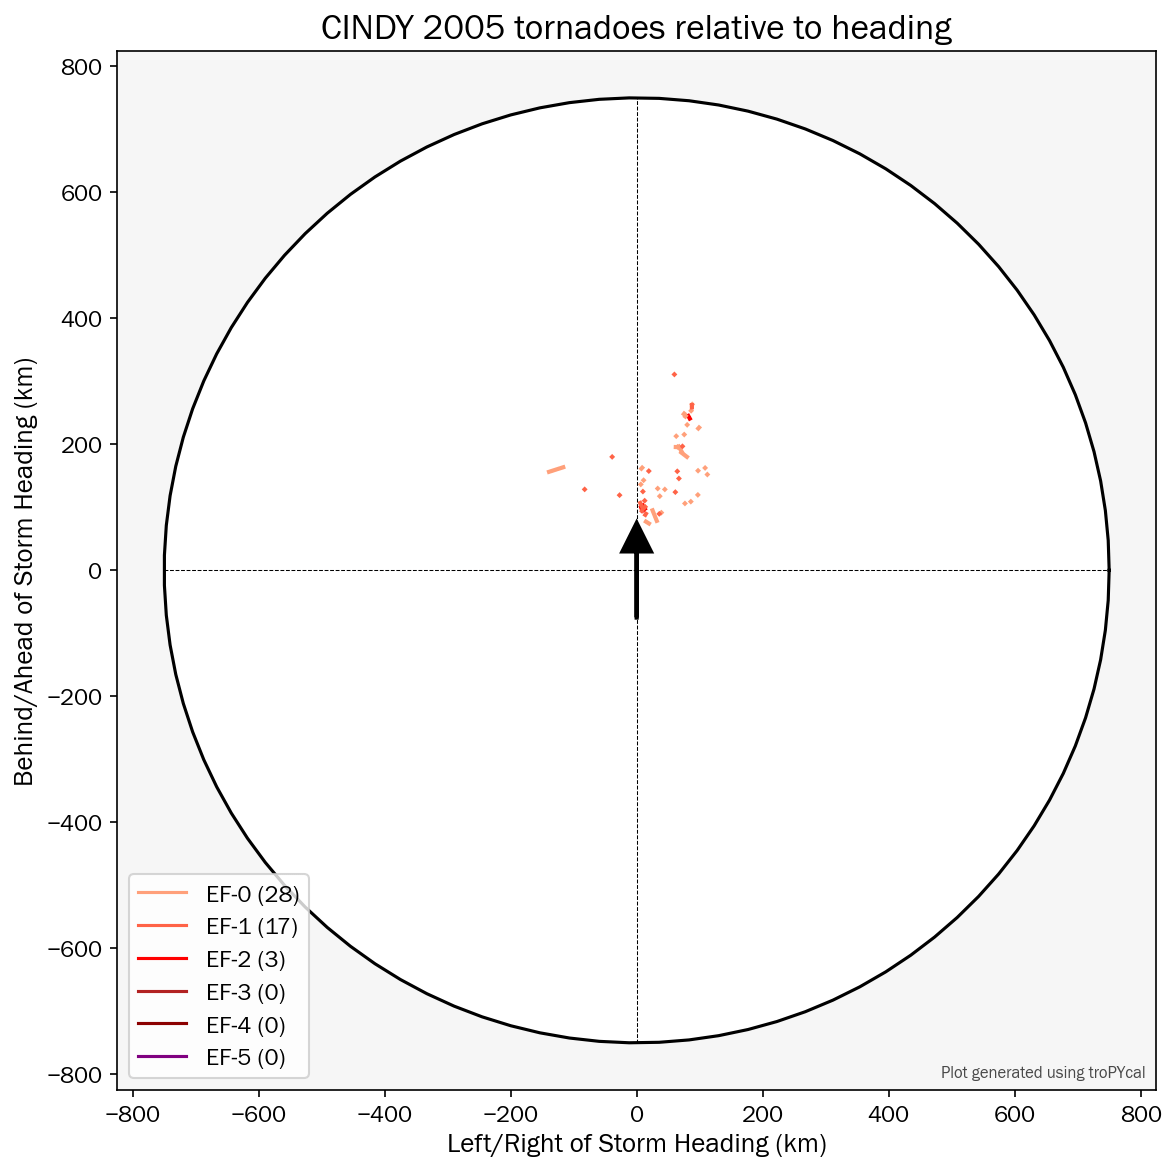
Storm-Relative Tornadoes
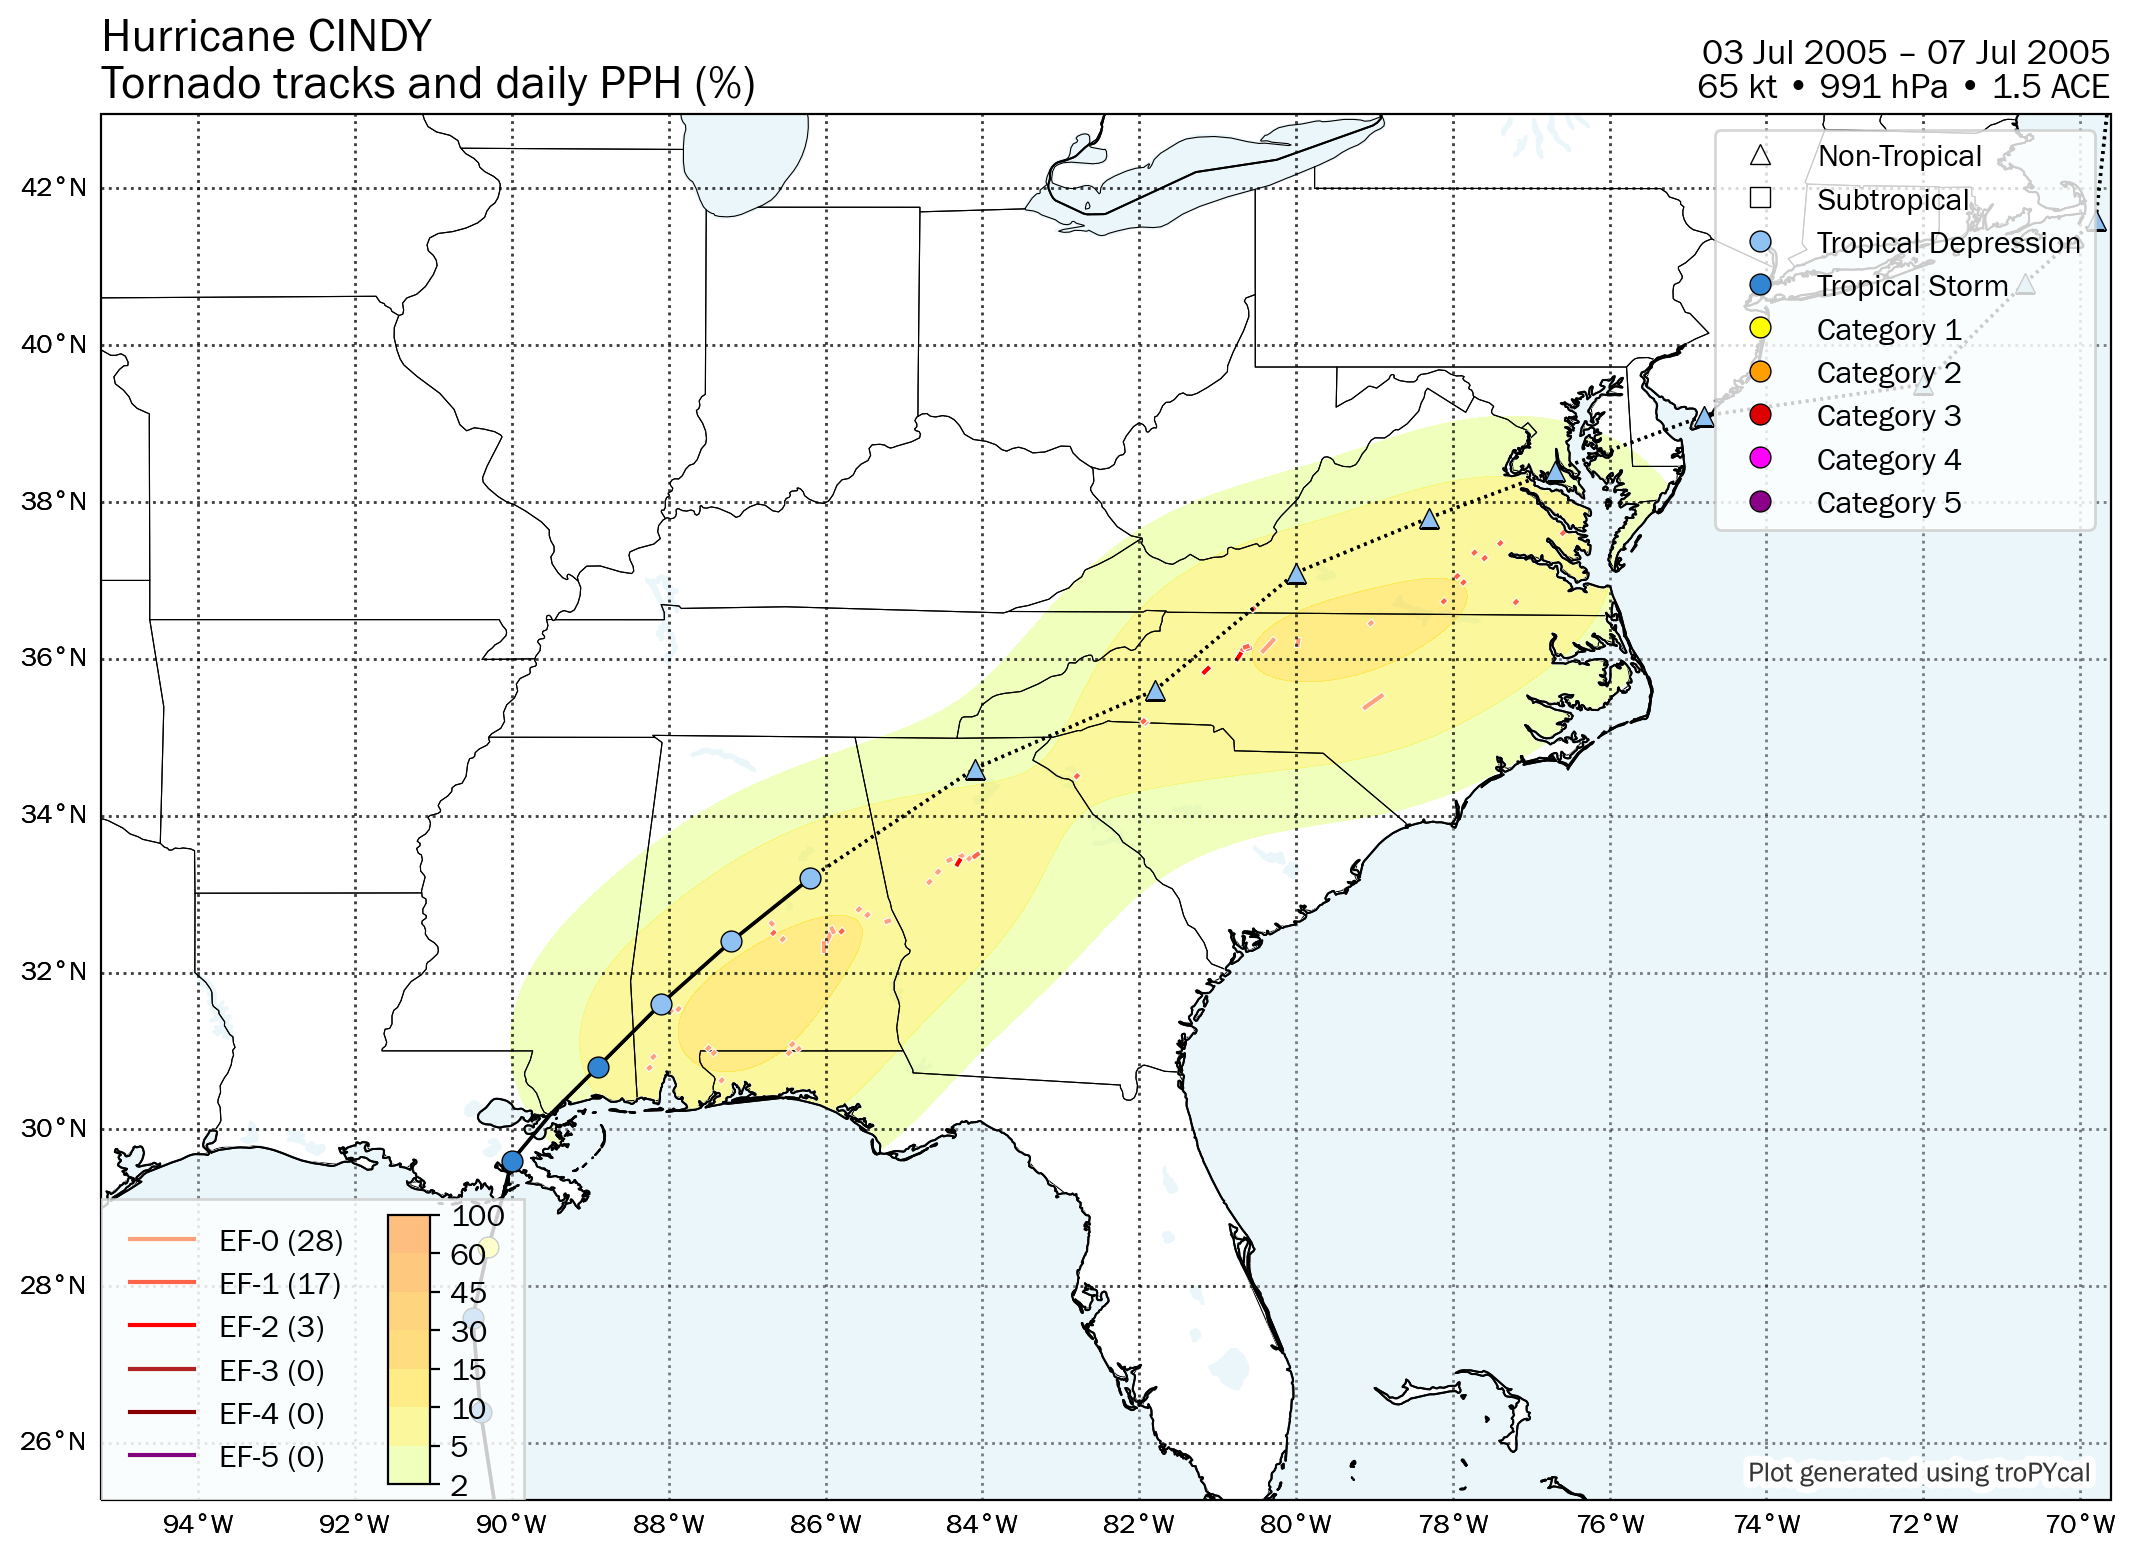
Tornado Map
Summary Map
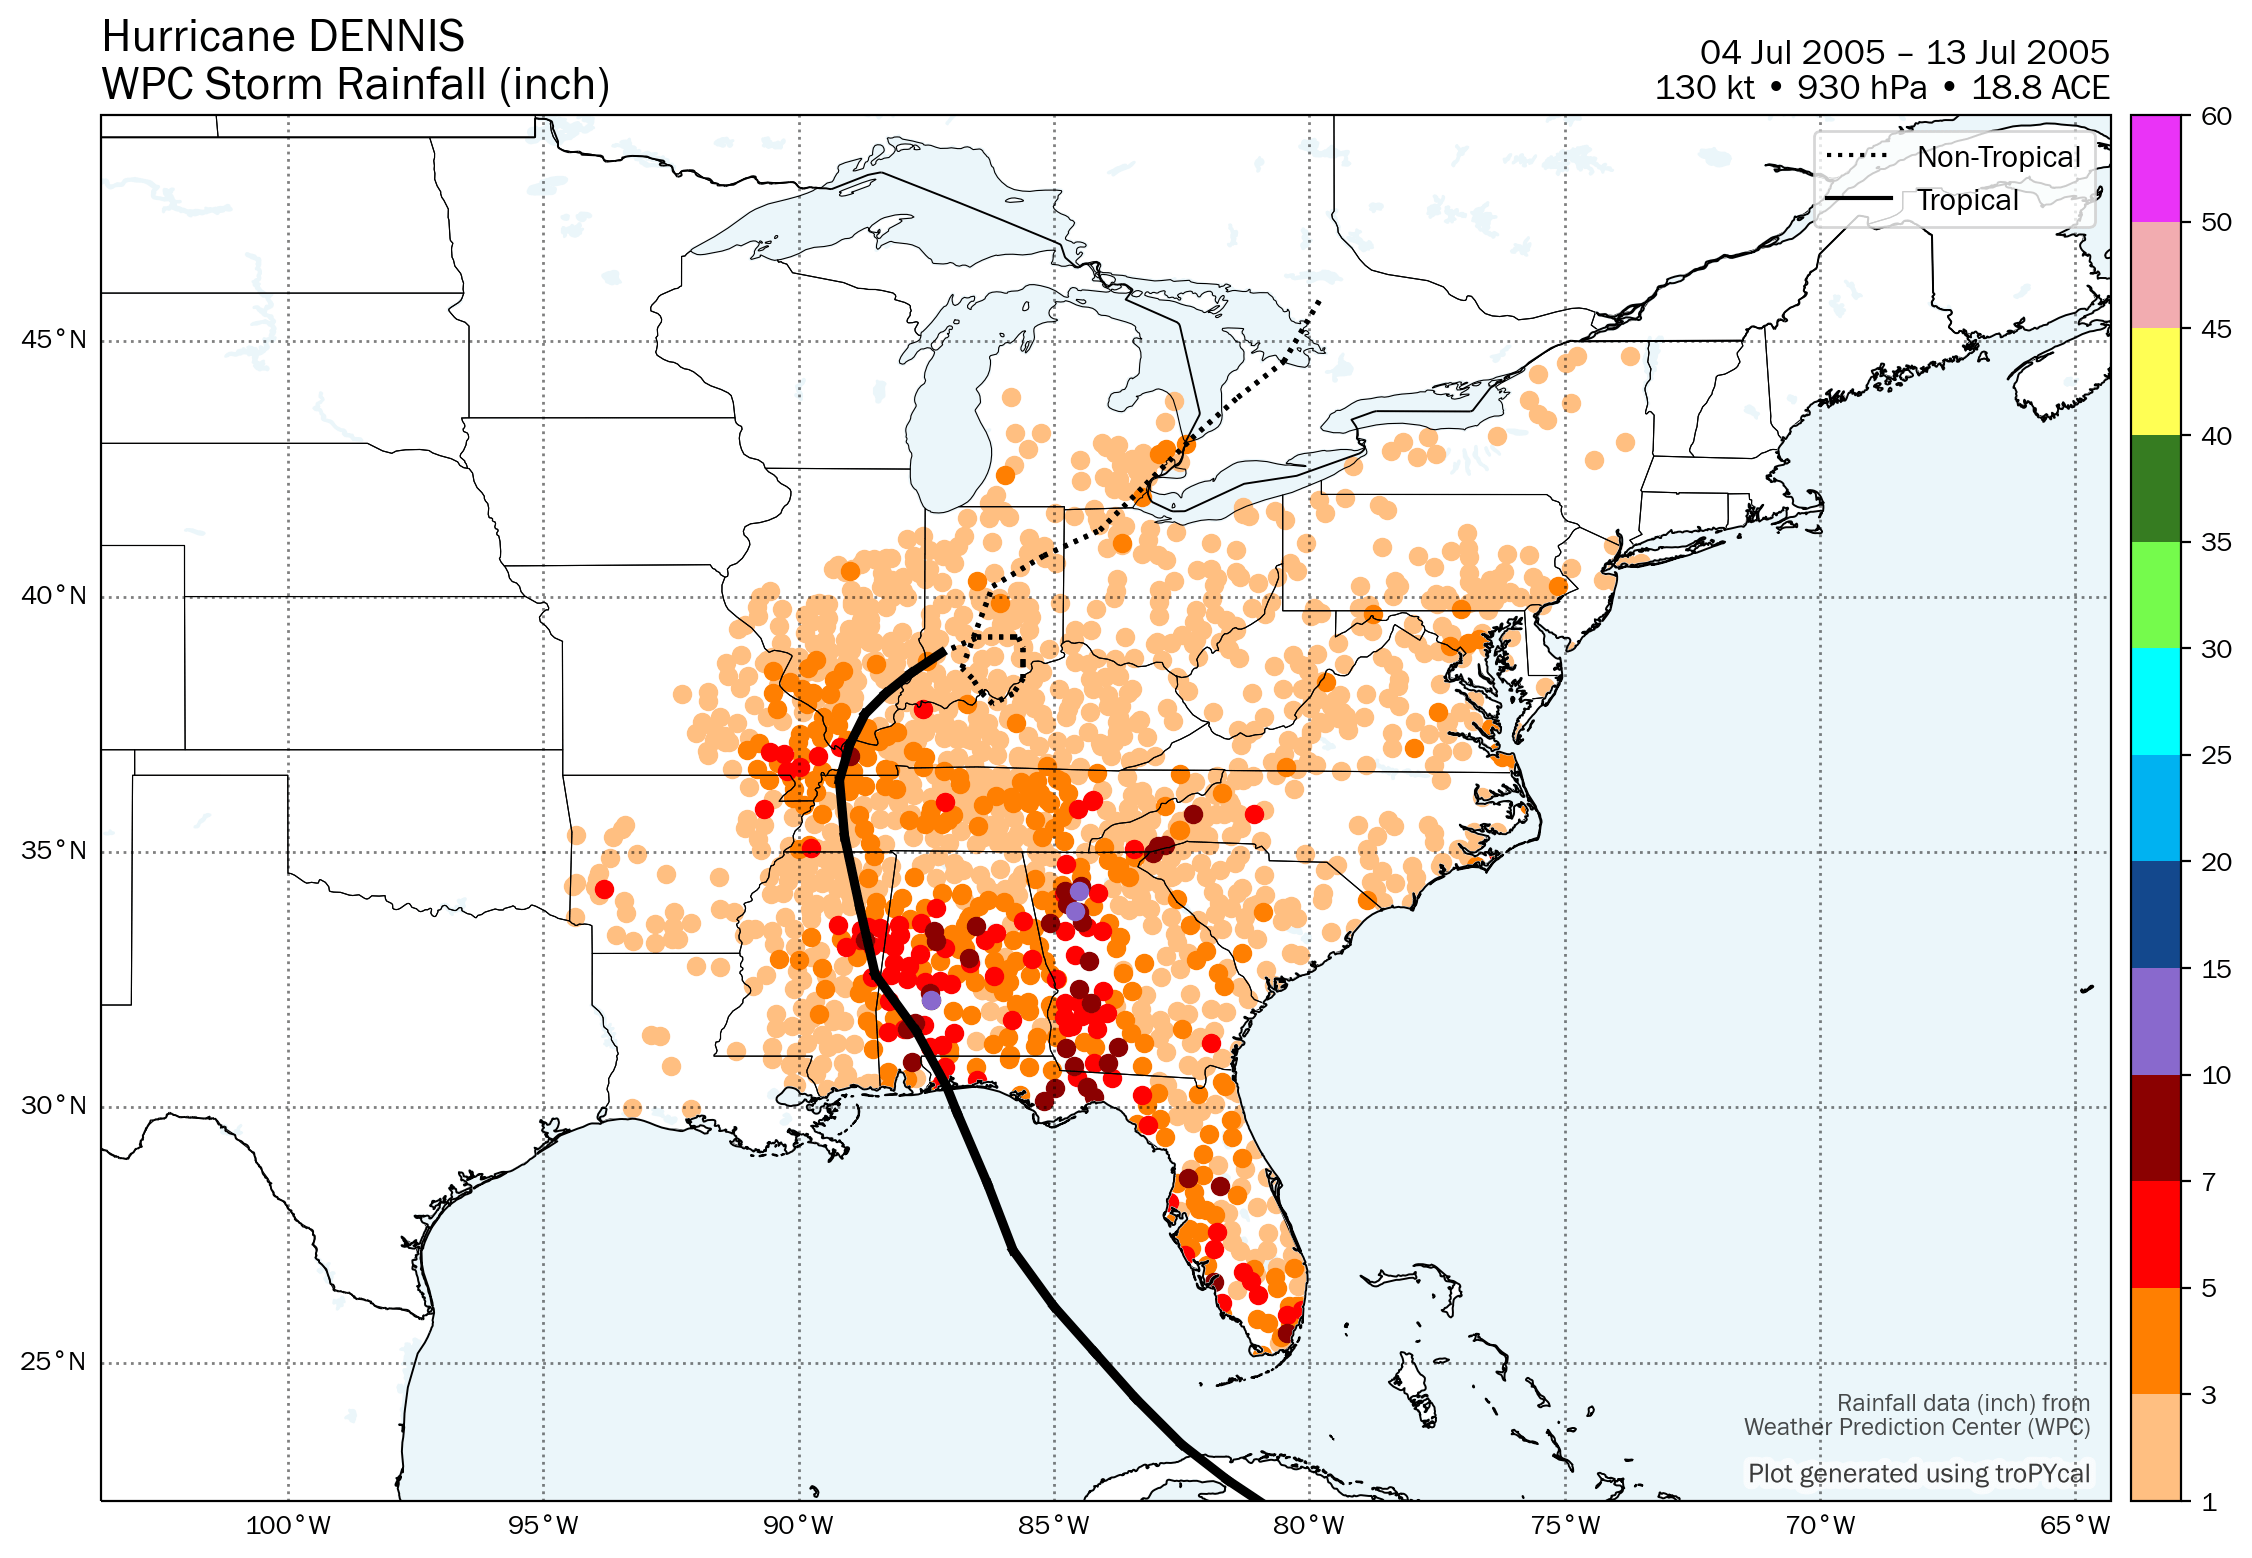
Gridded Rainfall
Summary Plot
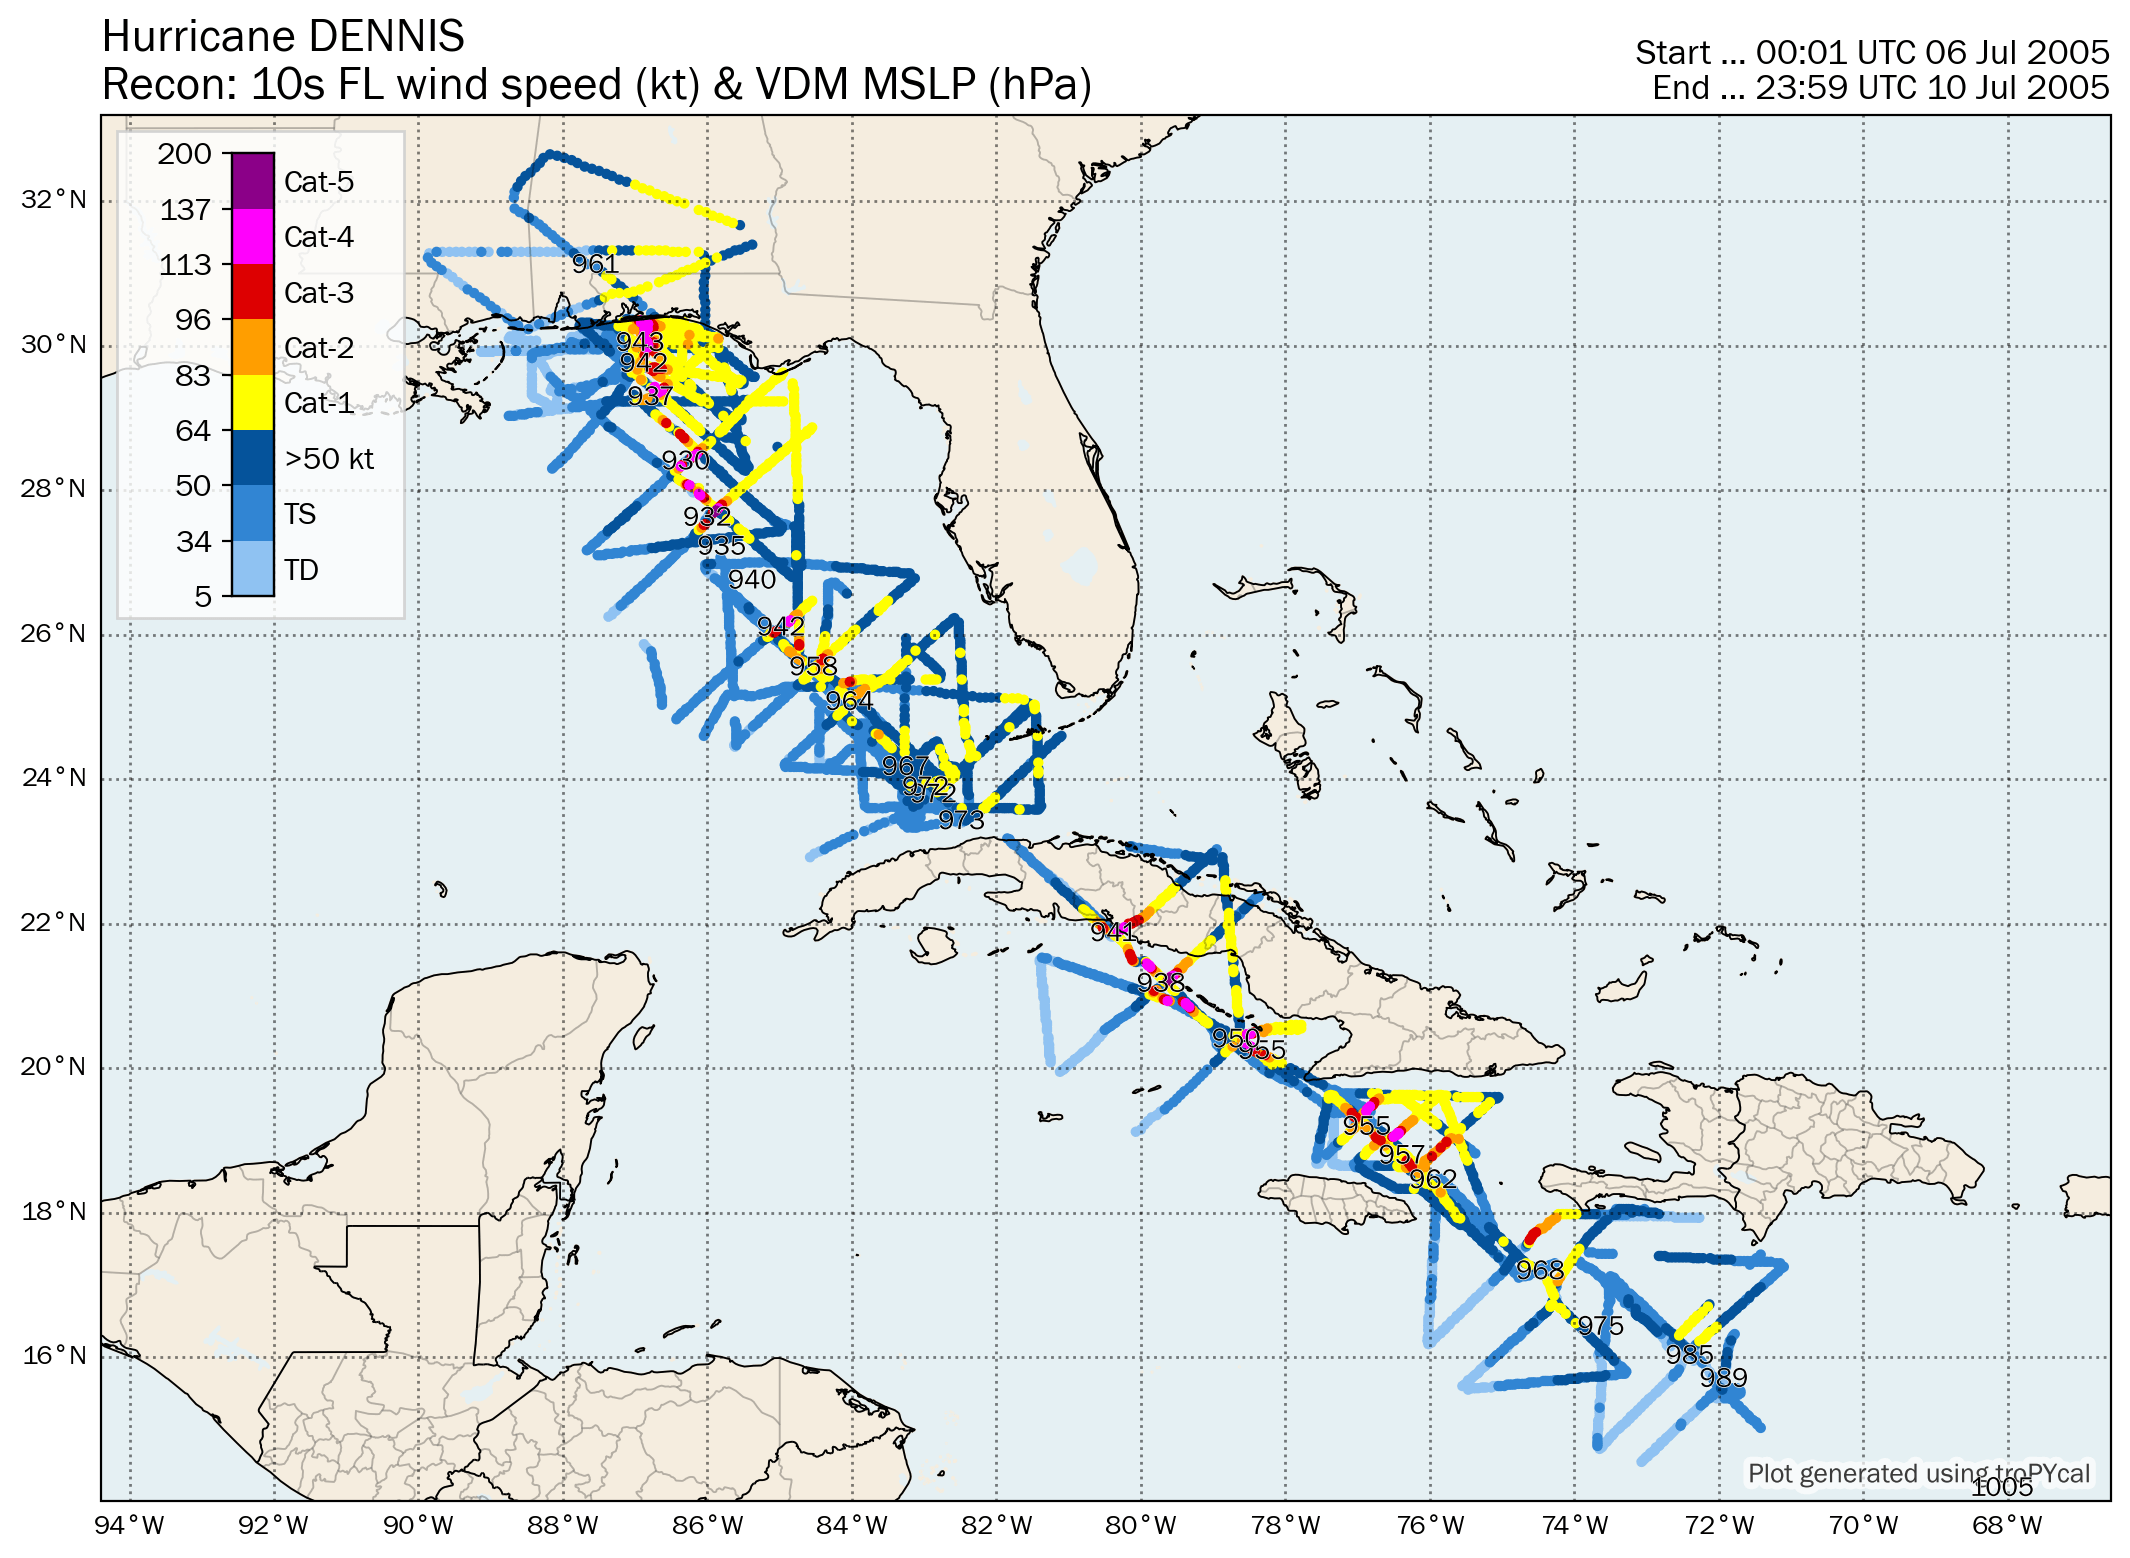
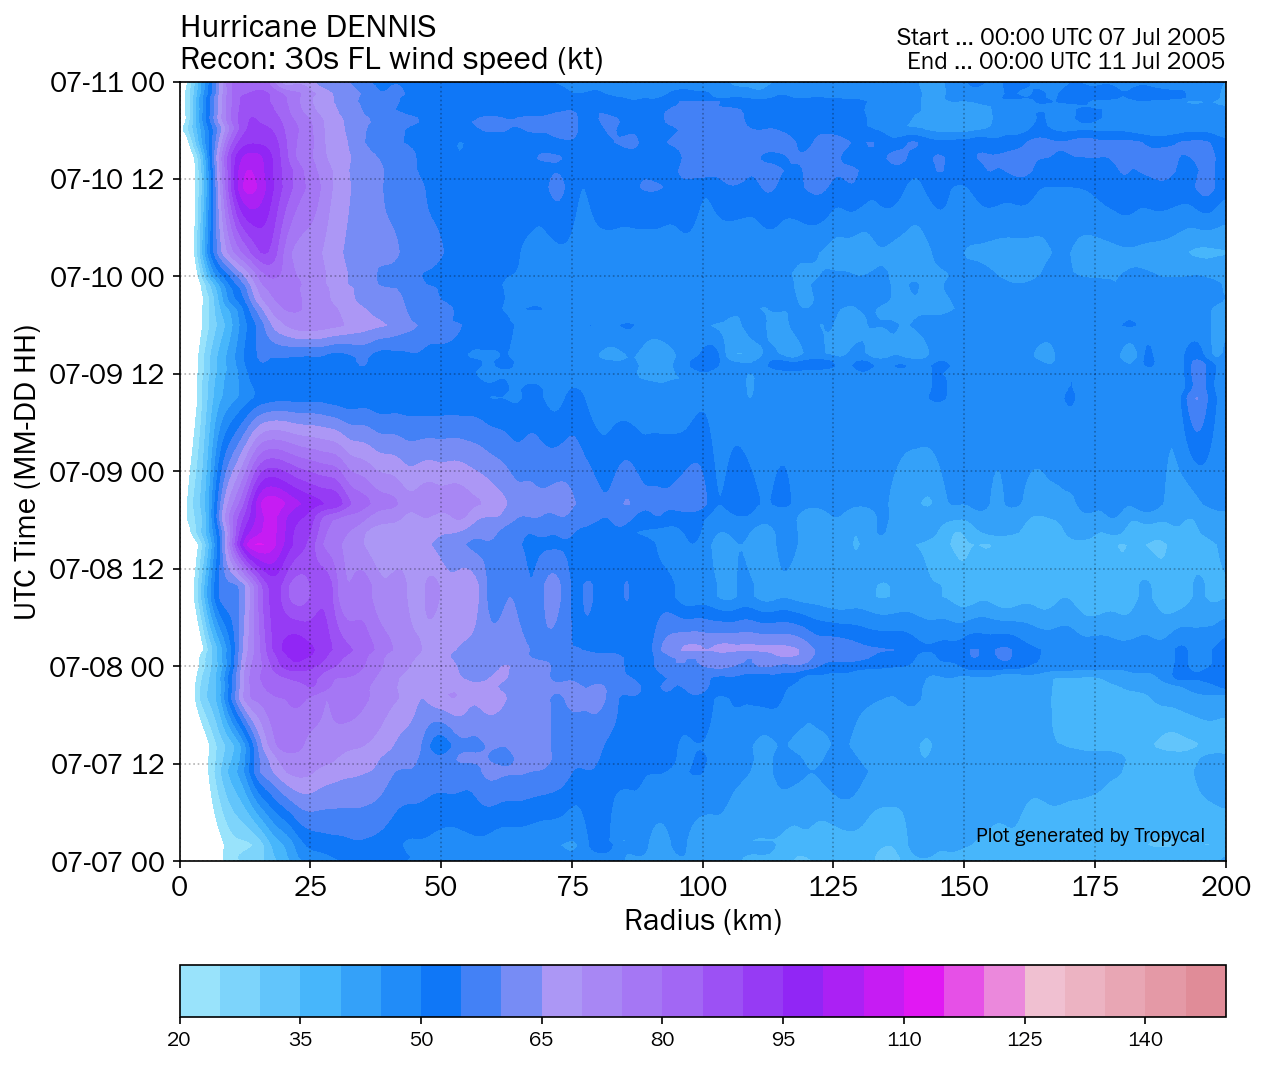
Recon-Derived Hovmoller
Recon-Derived Wind Swath
| Time (UTC) | Lat | Lon | Wind (mph) | Pressure | Storm Type | Category |
|---|---|---|---|---|---|---|
| 1800 UTC 04 Jul | 12.0 | -60.8 | 30 | 1010 | Tropical Depression | - |
| 2100 UTC 04 Jul | 12.1 | -61.6 | 35 | 1010 | Tropical Depression | - |
| 0000 UTC 05 Jul | 12.2 | -62.5 | 35 | 1009 | Tropical Depression | - |
| 0600 UTC 05 Jul | 12.5 | -64.2 | 35 | 1008 | Tropical Depression | - |
| 1200 UTC 05 Jul | 13.0 | -65.9 | 40 | 1007 | Tropical Storm | - |
| 1800 UTC 05 Jul | 13.6 | -67.3 | 45 | 1005 | Tropical Storm | - |
| 0000 UTC 06 Jul | 14.3 | -68.5 | 50 | 1000 | Tropical Storm | - |
| 0600 UTC 06 Jul | 14.7 | -69.7 | 60 | 995 | Tropical Storm | - |
| 1200 UTC 06 Jul | 15.1 | -70.9 | 65 | 991 | Tropical Storm | - |
| 1800 UTC 06 Jul | 15.6 | -71.9 | 70 | 989 | Tropical Storm | - |
| 0000 UTC 07 Jul | 16.2 | -73.0 | 80 | 982 | Hurricane | 1 |
| 0600 UTC 07 Jul | 16.7 | -74.1 | 90 | 972 | Hurricane | 1 |
| 1200 UTC 07 Jul | 17.6 | -74.9 | 105 | 967 | Hurricane | 2 |
| 1800 UTC 07 Jul | 18.5 | -76.1 | 115 | 957 | Hurricane | 3 |
| 0000 UTC 08 Jul | 19.4 | -77.1 | 140 | 951 | Hurricane | 4 |
| 0245 UTC 08 Jul | 19.9 | -77.6 | 140 | 956 | Hurricane | 4 |
| 0600 UTC 08 Jul | 20.3 | -78.4 | 125 | 953 | Hurricane | 3 |
| 1200 UTC 08 Jul | 20.9 | -79.5 | 150 | 938 | Hurricane | 4 |
| 1800 UTC 08 Jul | 22.0 | -80.6 | 140 | 941 | Hurricane | 4 |
| 1845 UTC 08 Jul | 22.1 | -80.7 | 140 | 941 | Hurricane | 4 |
| 0000 UTC 09 Jul | 22.7 | -81.6 | 115 | 960 | Hurricane | 3 |
| 0600 UTC 09 Jul | 23.4 | -82.5 | 85 | 973 | Hurricane | 1 |
| 1200 UTC 09 Jul | 24.3 | -83.4 | 90 | 967 | Hurricane | 1 |
| 1800 UTC 09 Jul | 25.2 | -84.2 | 105 | 962 | Hurricane | 2 |
| 0000 UTC 10 Jul | 26.1 | -85.0 | 125 | 942 | Hurricane | 3 |
| 0600 UTC 10 Jul | 27.2 | -85.8 | 145 | 935 | Hurricane | 4 |
| 1200 UTC 10 Jul | 28.5 | -86.3 | 140 | 930 | Hurricane | 4 |
| 1800 UTC 10 Jul | 29.9 | -86.9 | 125 | 942 | Hurricane | 3 |
| 1930 UTC 10 Jul | 30.4 | -87.1 | 120 | 946 | Hurricane | 3 |
| 0000 UTC 11 Jul | 31.5 | -87.7 | 50 | 970 | Tropical Storm | - |
| 0600 UTC 11 Jul | 32.6 | -88.5 | 35 | 991 | Tropical Depression | - |
| 1200 UTC 11 Jul | 33.9 | -88.8 | 30 | 997 | Tropical Depression | - |
| 1800 UTC 11 Jul | 35.3 | -89.1 | 25 | 1002 | Tropical Depression | - |
| 0000 UTC 12 Jul | 36.4 | -89.2 | 25 | 1003 | Tropical Depression | - |
| 0600 UTC 12 Jul | 37.1 | -89.0 | 20 | 1005 | Tropical Depression | - |
| 1200 UTC 12 Jul | 37.7 | -88.7 | 20 | 1007 | Tropical Depression | - |
| 1800 UTC 12 Jul | 38.1 | -88.3 | 20 | 1008 | Tropical Depression | - |
| 0000 UTC 13 Jul | 38.5 | -87.8 | 20 | 1009 | Tropical Depression | - |
| 0600 UTC 13 Jul | 38.9 | -87.2 | 20 | 1010 | Tropical Depression | - |
| 1200 UTC 13 Jul | 39.2 | -86.5 | 20 | 1010 | Remnant Low | - |
| 1800 UTC 13 Jul | 39.2 | -85.8 | 20 | 1010 | Remnant Low | - |
| 0000 UTC 14 Jul | 39.2 | -85.7 | 15 | 1009 | Remnant Low | - |
| 0600 UTC 14 Jul | 39.0 | -85.6 | 15 | 1009 | Remnant Low | - |
| 1200 UTC 14 Jul | 38.7 | -85.6 | 15 | 1010 | Remnant Low | - |
| 1800 UTC 14 Jul | 38.4 | -85.6 | 15 | 1010 | Remnant Low | - |
| 0000 UTC 15 Jul | 38.1 | -85.8 | 15 | 1009 | Remnant Low | - |
| 0600 UTC 15 Jul | 37.9 | -86.2 | 15 | 1010 | Remnant Low | - |
| 1200 UTC 15 Jul | 38.1 | -86.4 | 15 | 1012 | Remnant Low | - |
| 1800 UTC 15 Jul | 38.4 | -86.6 | 15 | 1012 | Remnant Low | - |
| 0000 UTC 16 Jul | 38.6 | -86.8 | 15 | 1011 | Remnant Low | - |
| 0600 UTC 16 Jul | 39.4 | -86.5 | 15 | 1013 | Remnant Low | - |
| 1200 UTC 16 Jul | 40.2 | -86.2 | 15 | 1013 | Remnant Low | - |
| 1800 UTC 16 Jul | 40.8 | -85.2 | 15 | 1014 | Remnant Low | - |
| 0000 UTC 17 Jul | 41.3 | -84.1 | 15 | 1013 | Remnant Low | - |
| 0600 UTC 17 Jul | 42.2 | -83.2 | 15 | 1013 | Remnant Low | - |
| 1200 UTC 17 Jul | 43.1 | -82.3 | 15 | 1013 | Remnant Low | - |
| 1800 UTC 17 Jul | 43.9 | -81.4 | 15 | 1012 | Remnant Low | - |
| 0000 UTC 18 Jul | 44.6 | -80.5 | 15 | 1010 | Remnant Low | - |
| 0600 UTC 18 Jul | 45.8 | -79.8 | 15 | 1009 | Remnant Low | - |
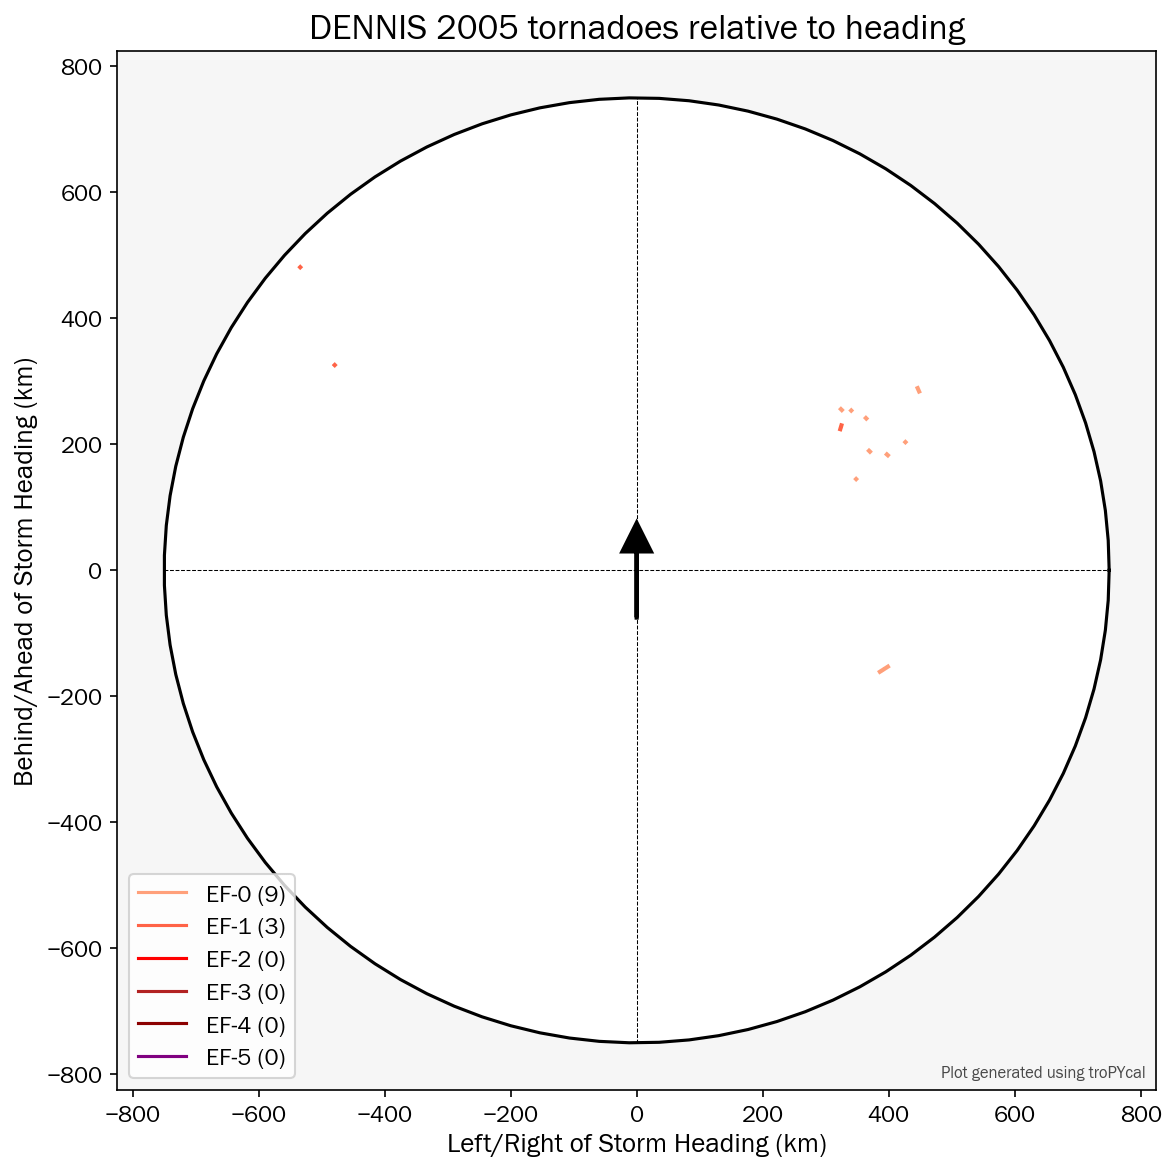
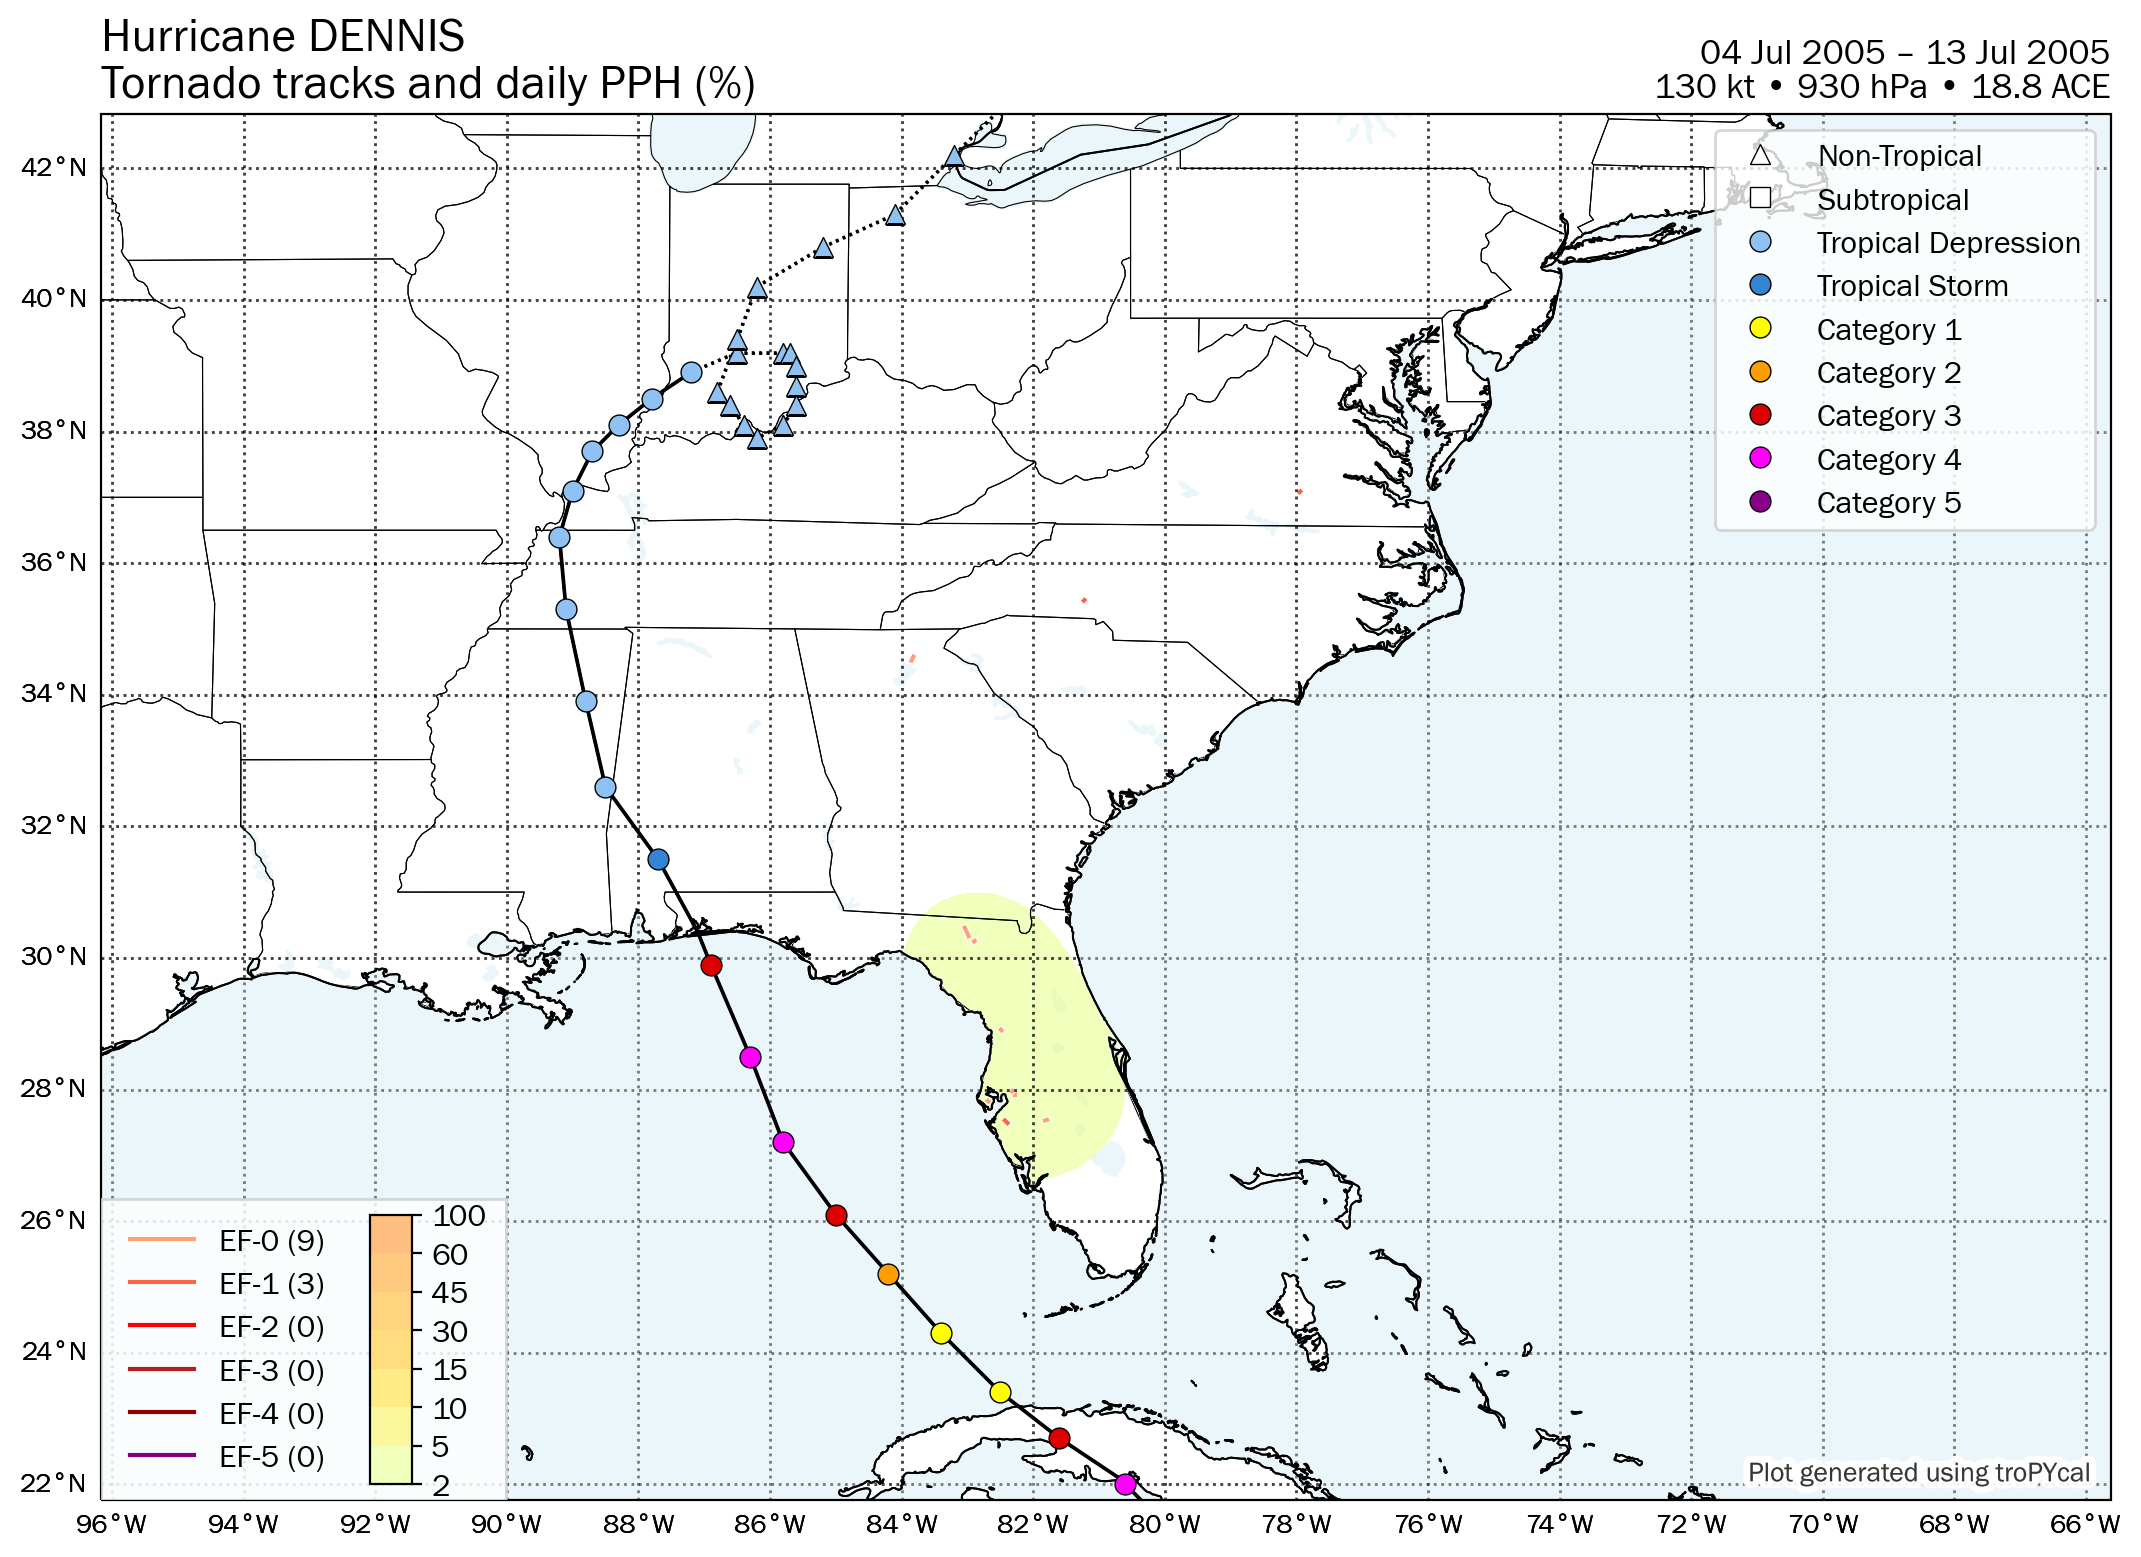
Storm-Relative Tornadoes
Tornado Map
Summary Plot
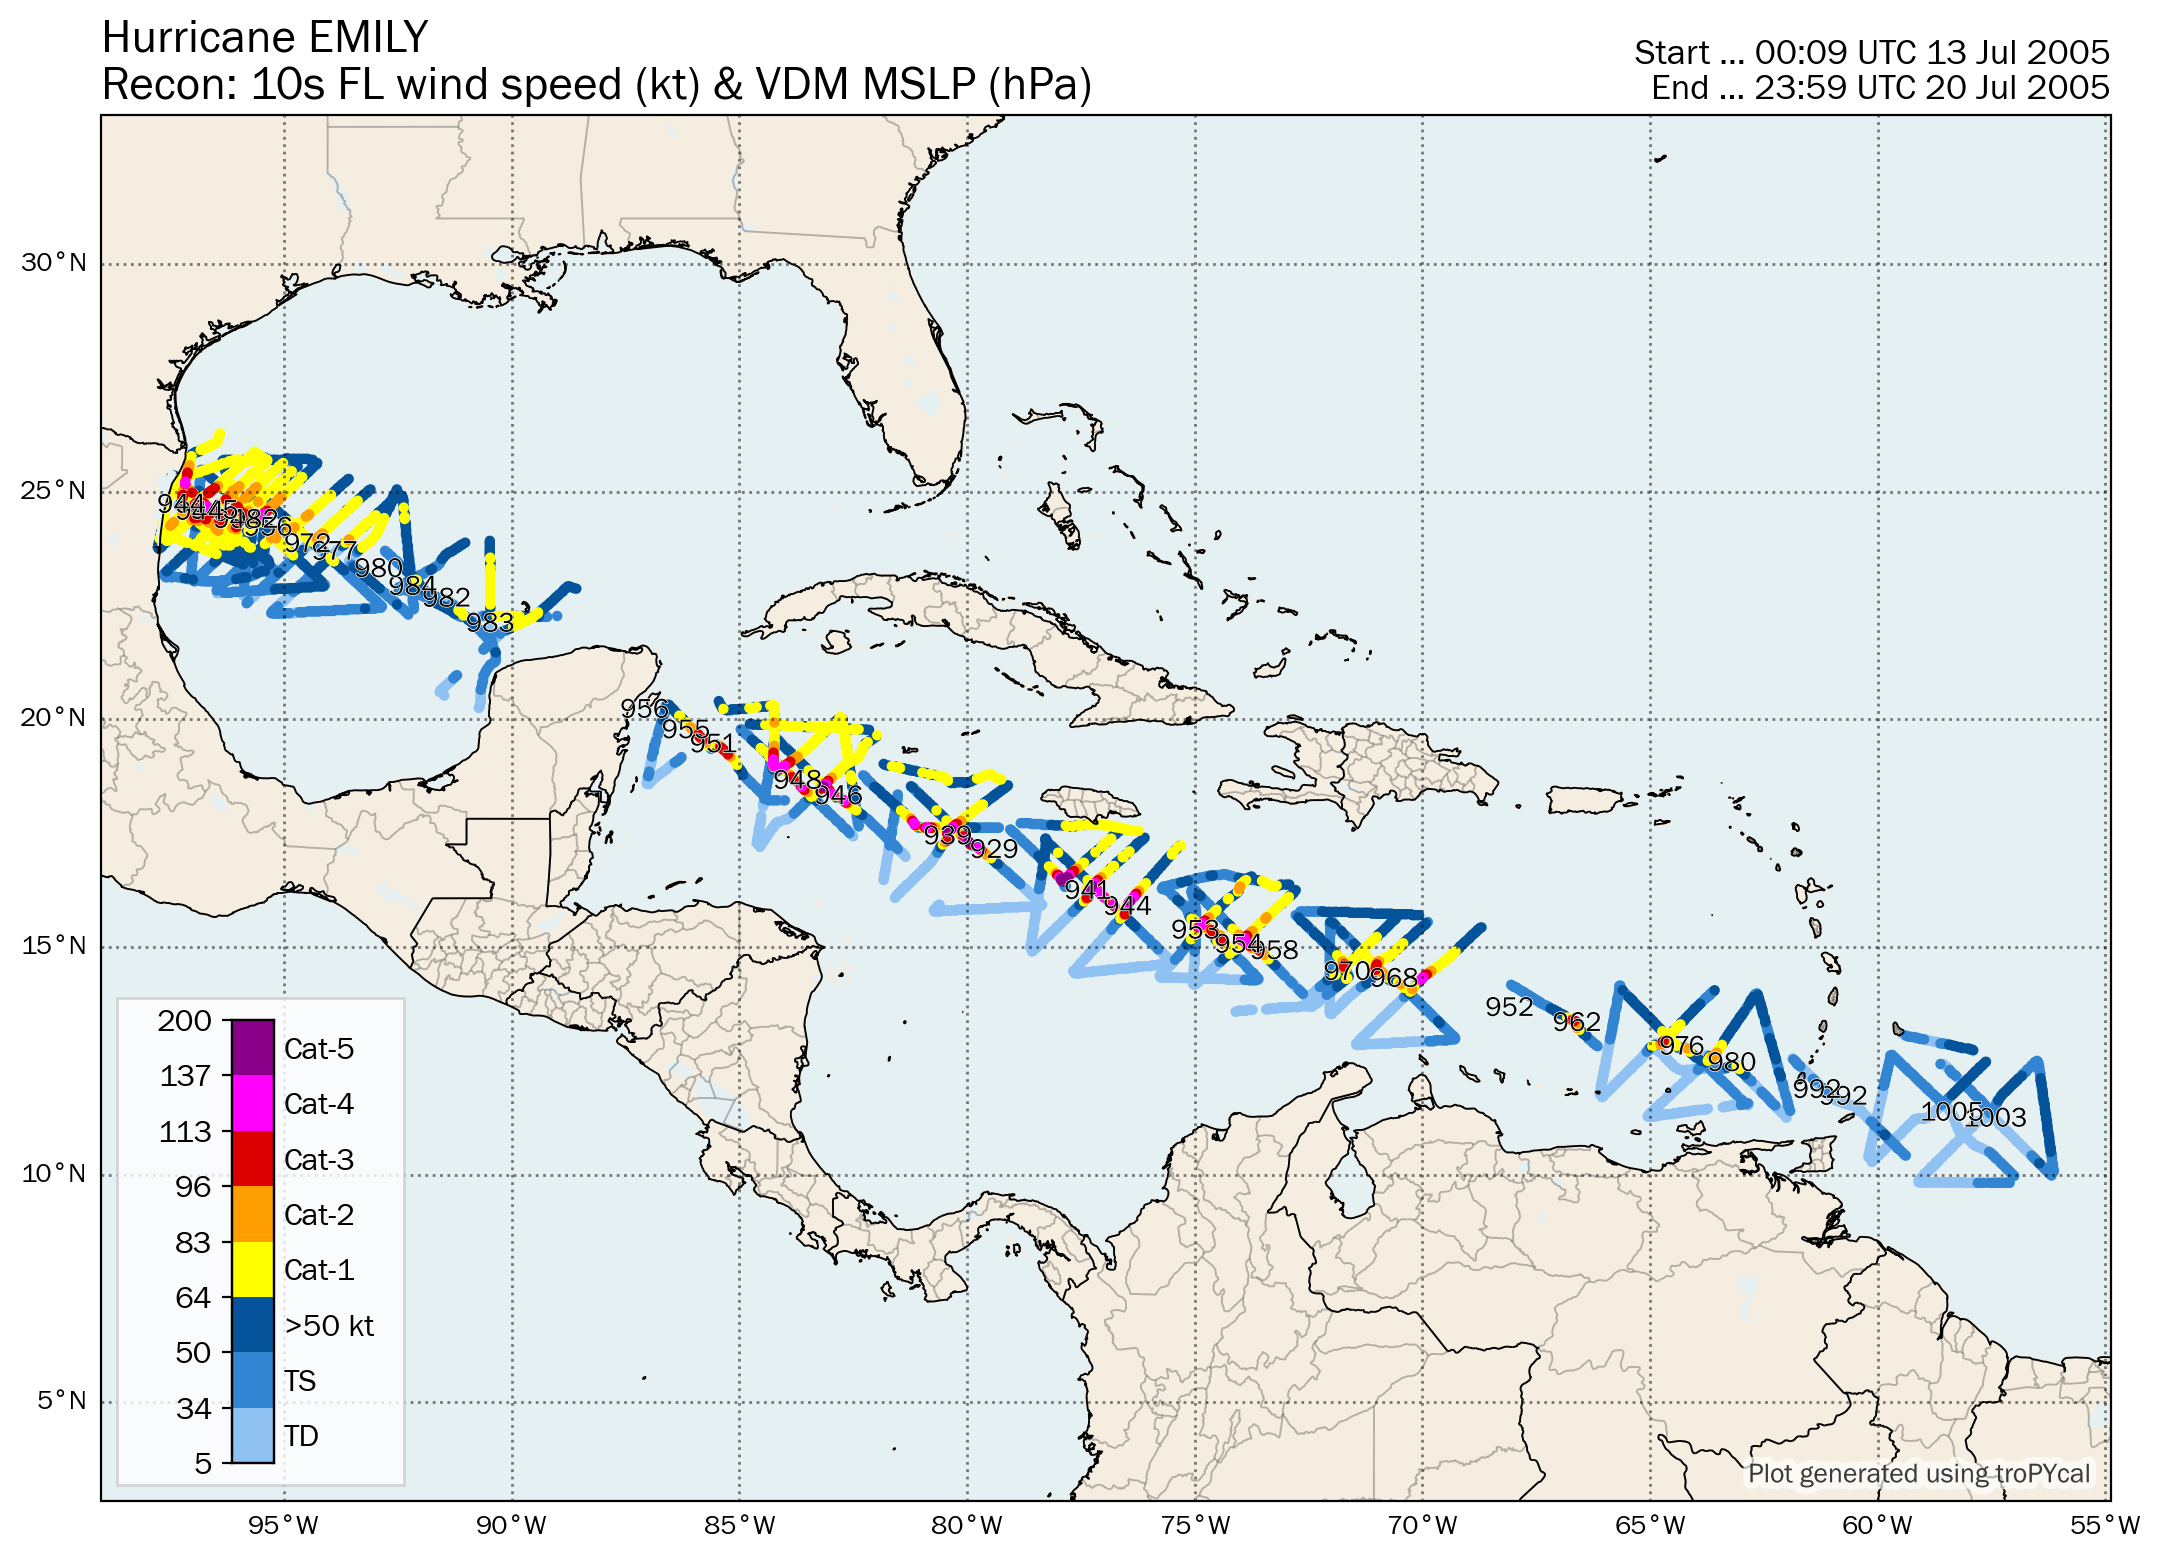
Recon-Derived Hovmoller
Recon-Derived Wind Swath
| Time (UTC) | Lat | Lon | Wind (mph) | Pressure | Storm Type | Category |
|---|---|---|---|---|---|---|
| 0000 UTC 11 Jul | 10.7 | -42.4 | 30 | 1010 | Tropical Depression | - |
| 0600 UTC 11 Jul | 10.8 | -43.4 | 35 | 1009 | Tropical Depression | - |
| 1200 UTC 11 Jul | 10.9 | -44.4 | 35 | 1009 | Tropical Depression | - |
| 1800 UTC 11 Jul | 11.0 | -45.4 | 35 | 1007 | Tropical Depression | - |
| 0000 UTC 12 Jul | 11.0 | -46.8 | 40 | 1006 | Tropical Storm | - |
| 0600 UTC 12 Jul | 11.0 | -48.5 | 45 | 1005 | Tropical Storm | - |
| 1200 UTC 12 Jul | 11.0 | -50.2 | 50 | 1004 | Tropical Storm | - |
| 1800 UTC 12 Jul | 11.0 | -52.0 | 50 | 1004 | Tropical Storm | - |
| 0000 UTC 13 Jul | 11.0 | -53.7 | 50 | 1003 | Tropical Storm | - |
| 0600 UTC 13 Jul | 11.1 | -55.4 | 50 | 1003 | Tropical Storm | - |
| 1200 UTC 13 Jul | 11.2 | -57.2 | 60 | 1003 | Tropical Storm | - |
| 1800 UTC 13 Jul | 11.4 | -58.9 | 65 | 1003 | Tropical Storm | - |
| 0000 UTC 14 Jul | 11.6 | -60.2 | 80 | 999 | Hurricane | 1 |
| 0600 UTC 14 Jul | 11.9 | -61.5 | 85 | 991 | Hurricane | 1 |
| 0700 UTC 14 Jul | 12.0 | -61.8 | 85 | 989 | Hurricane | 1 |
| 1200 UTC 14 Jul | 12.4 | -63.2 | 100 | 980 | Hurricane | 2 |
| 1800 UTC 14 Jul | 12.9 | -64.9 | 115 | 971 | Hurricane | 3 |
| 0000 UTC 15 Jul | 13.3 | -66.7 | 125 | 959 | Hurricane | 3 |
| 0600 UTC 15 Jul | 13.7 | -68.4 | 130 | 952 | Hurricane | 4 |
| 1200 UTC 15 Jul | 14.1 | -70.1 | 130 | 964 | Hurricane | 4 |
| 1800 UTC 15 Jul | 14.5 | -71.8 | 110 | 969 | Hurricane | 2 |
| 0000 UTC 16 Jul | 14.9 | -73.4 | 125 | 958 | Hurricane | 3 |
| 0600 UTC 16 Jul | 15.4 | -75.0 | 140 | 953 | Hurricane | 4 |
| 1200 UTC 16 Jul | 15.9 | -76.5 | 150 | 944 | Hurricane | 4 |
| 1800 UTC 16 Jul | 16.4 | -78.0 | 155 | 937 | Hurricane | 4 |
| 0000 UTC 17 Jul | 17.1 | -79.5 | 160 | 929 | Hurricane | 5 |
| 0600 UTC 17 Jul | 17.7 | -81.2 | 155 | 940 | Hurricane | 4 |
| 1200 UTC 17 Jul | 18.3 | -82.8 | 150 | 946 | Hurricane | 4 |
| 1800 UTC 17 Jul | 18.9 | -84.3 | 145 | 948 | Hurricane | 4 |
| 0000 UTC 18 Jul | 19.5 | -85.8 | 140 | 951 | Hurricane | 4 |
| 0600 UTC 18 Jul | 20.3 | -87.3 | 130 | 955 | Hurricane | 4 |
| 0630 UTC 18 Jul | 20.3 | -87.4 | 130 | 955 | Hurricane | 4 |
| 1200 UTC 18 Jul | 21.3 | -88.9 | 75 | 975 | Hurricane | 1 |
| 1800 UTC 18 Jul | 22.0 | -90.3 | 75 | 984 | Hurricane | 1 |
| 0000 UTC 19 Jul | 22.6 | -91.5 | 85 | 981 | Hurricane | 1 |
| 0600 UTC 19 Jul | 23.2 | -92.8 | 90 | 980 | Hurricane | 1 |
| 1200 UTC 19 Jul | 23.7 | -94.0 | 90 | 977 | Hurricane | 1 |
| 1800 UTC 19 Jul | 24.1 | -95.1 | 100 | 959 | Hurricane | 2 |
| 0000 UTC 20 Jul | 24.4 | -96.1 | 125 | 948 | Hurricane | 3 |
| 0600 UTC 20 Jul | 24.6 | -96.9 | 125 | 944 | Hurricane | 3 |
| 1200 UTC 20 Jul | 24.8 | -97.6 | 125 | 944 | Hurricane | 3 |
| 1800 UTC 20 Jul | 25.0 | -98.7 | 80 | 975 | Hurricane | 1 |
| 0000 UTC 21 Jul | 25.0 | -99.7 | 50 | 995 | Tropical Storm | - |
| 0600 UTC 21 Jul | 25.0 | -100.5 | 35 | 1000 | Tropical Depression | - |
| 1200 UTC 21 Jul | 25.0 | -101.1 | 30 | 1007 | Tropical Depression | - |
Summary Plot
Recon-Derived Hovmoller
Recon-Derived Wind Swath
| Time (UTC) | Lat | Lon | Wind (mph) | Pressure | Storm Type | Category |
|---|---|---|---|---|---|---|
| 1800 UTC 21 Jul | 25.0 | -75.0 | 35 | 1010 | Tropical Depression | - |
| 0000 UTC 22 Jul | 25.7 | -75.9 | 45 | 1009 | Tropical Storm | - |
| 0600 UTC 22 Jul | 26.2 | -76.4 | 45 | 1008 | Tropical Storm | - |
| 1200 UTC 22 Jul | 26.6 | -76.8 | 50 | 1007 | Tropical Storm | - |
| 1800 UTC 22 Jul | 27.4 | -76.7 | 50 | 1006 | Tropical Storm | - |
| 0000 UTC 23 Jul | 28.1 | -76.6 | 50 | 1003 | Tropical Storm | - |
| 0600 UTC 23 Jul | 28.7 | -76.1 | 60 | 1001 | Tropical Storm | - |
| 1200 UTC 23 Jul | 29.2 | -75.4 | 70 | 1001 | Tropical Storm | - |
| 1800 UTC 23 Jul | 29.7 | -74.7 | 70 | 1001 | Tropical Storm | - |
| 0000 UTC 24 Jul | 30.1 | -73.5 | 65 | 1001 | Tropical Storm | - |
| 0600 UTC 24 Jul | 30.3 | -72.6 | 65 | 1001 | Tropical Storm | - |
| 1200 UTC 24 Jul | 30.7 | -71.9 | 50 | 1001 | Tropical Storm | - |
| 1800 UTC 24 Jul | 31.1 | -71.2 | 50 | 1000 | Tropical Storm | - |
| 0000 UTC 25 Jul | 31.1 | -71.2 | 45 | 1000 | Tropical Storm | - |
| 0600 UTC 25 Jul | 31.0 | -70.5 | 45 | 1000 | Tropical Storm | - |
| 1200 UTC 25 Jul | 30.9 | -69.8 | 45 | 999 | Tropical Storm | - |
| 1800 UTC 25 Jul | 30.9 | -69.6 | 45 | 999 | Tropical Storm | - |
| 0000 UTC 26 Jul | 30.9 | -68.6 | 40 | 1000 | Tropical Storm | - |
| 0600 UTC 26 Jul | 31.2 | -68.2 | 40 | 1001 | Tropical Storm | - |
| 1200 UTC 26 Jul | 31.7 | -68.1 | 40 | 1002 | Tropical Storm | - |
| 1800 UTC 26 Jul | 32.2 | -68.3 | 40 | 1001 | Tropical Storm | - |
| 0000 UTC 27 Jul | 32.4 | -68.5 | 45 | 1000 | Tropical Storm | - |
| 0600 UTC 27 Jul | 32.8 | -68.8 | 45 | 1000 | Tropical Storm | - |
| 1200 UTC 27 Jul | 33.2 | -69.1 | 50 | 999 | Tropical Storm | - |
| 1800 UTC 27 Jul | 33.6 | -69.3 | 50 | 999 | Tropical Storm | - |
| 0000 UTC 28 Jul | 34.2 | -69.4 | 60 | 997 | Tropical Storm | - |
| 0600 UTC 28 Jul | 35.0 | -69.3 | 60 | 997 | Tropical Storm | - |
| 1200 UTC 28 Jul | 36.0 | -69.1 | 50 | 999 | Tropical Storm | - |
| 1800 UTC 28 Jul | 37.1 | -68.0 | 60 | 997 | Tropical Storm | - |
| 0000 UTC 29 Jul | 38.4 | -66.6 | 60 | 997 | Tropical Storm | - |
| 0600 UTC 29 Jul | 39.6 | -64.8 | 60 | 997 | Tropical Storm | - |
| 1200 UTC 29 Jul | 40.8 | -62.8 | 60 | 997 | Tropical Storm | - |
| 1800 UTC 29 Jul | 42.2 | -60.2 | 60 | 999 | Tropical Storm | - |
| 0000 UTC 30 Jul | 43.5 | -57.5 | 60 | 1001 | Post-Tropical Cyclone | - |
| 0600 UTC 30 Jul | 44.7 | -54.6 | 50 | 1003 | Post-Tropical Cyclone | - |
| 1200 UTC 30 Jul | 45.8 | -51.7 | 45 | 1005 | Post-Tropical Cyclone | - |
| 1800 UTC 30 Jul | 46.4 | -48.8 | 45 | 1006 | Post-Tropical Cyclone | - |
| 0000 UTC 31 Jul | 47.5 | -46.0 | 45 | 1006 | Post-Tropical Cyclone | - |
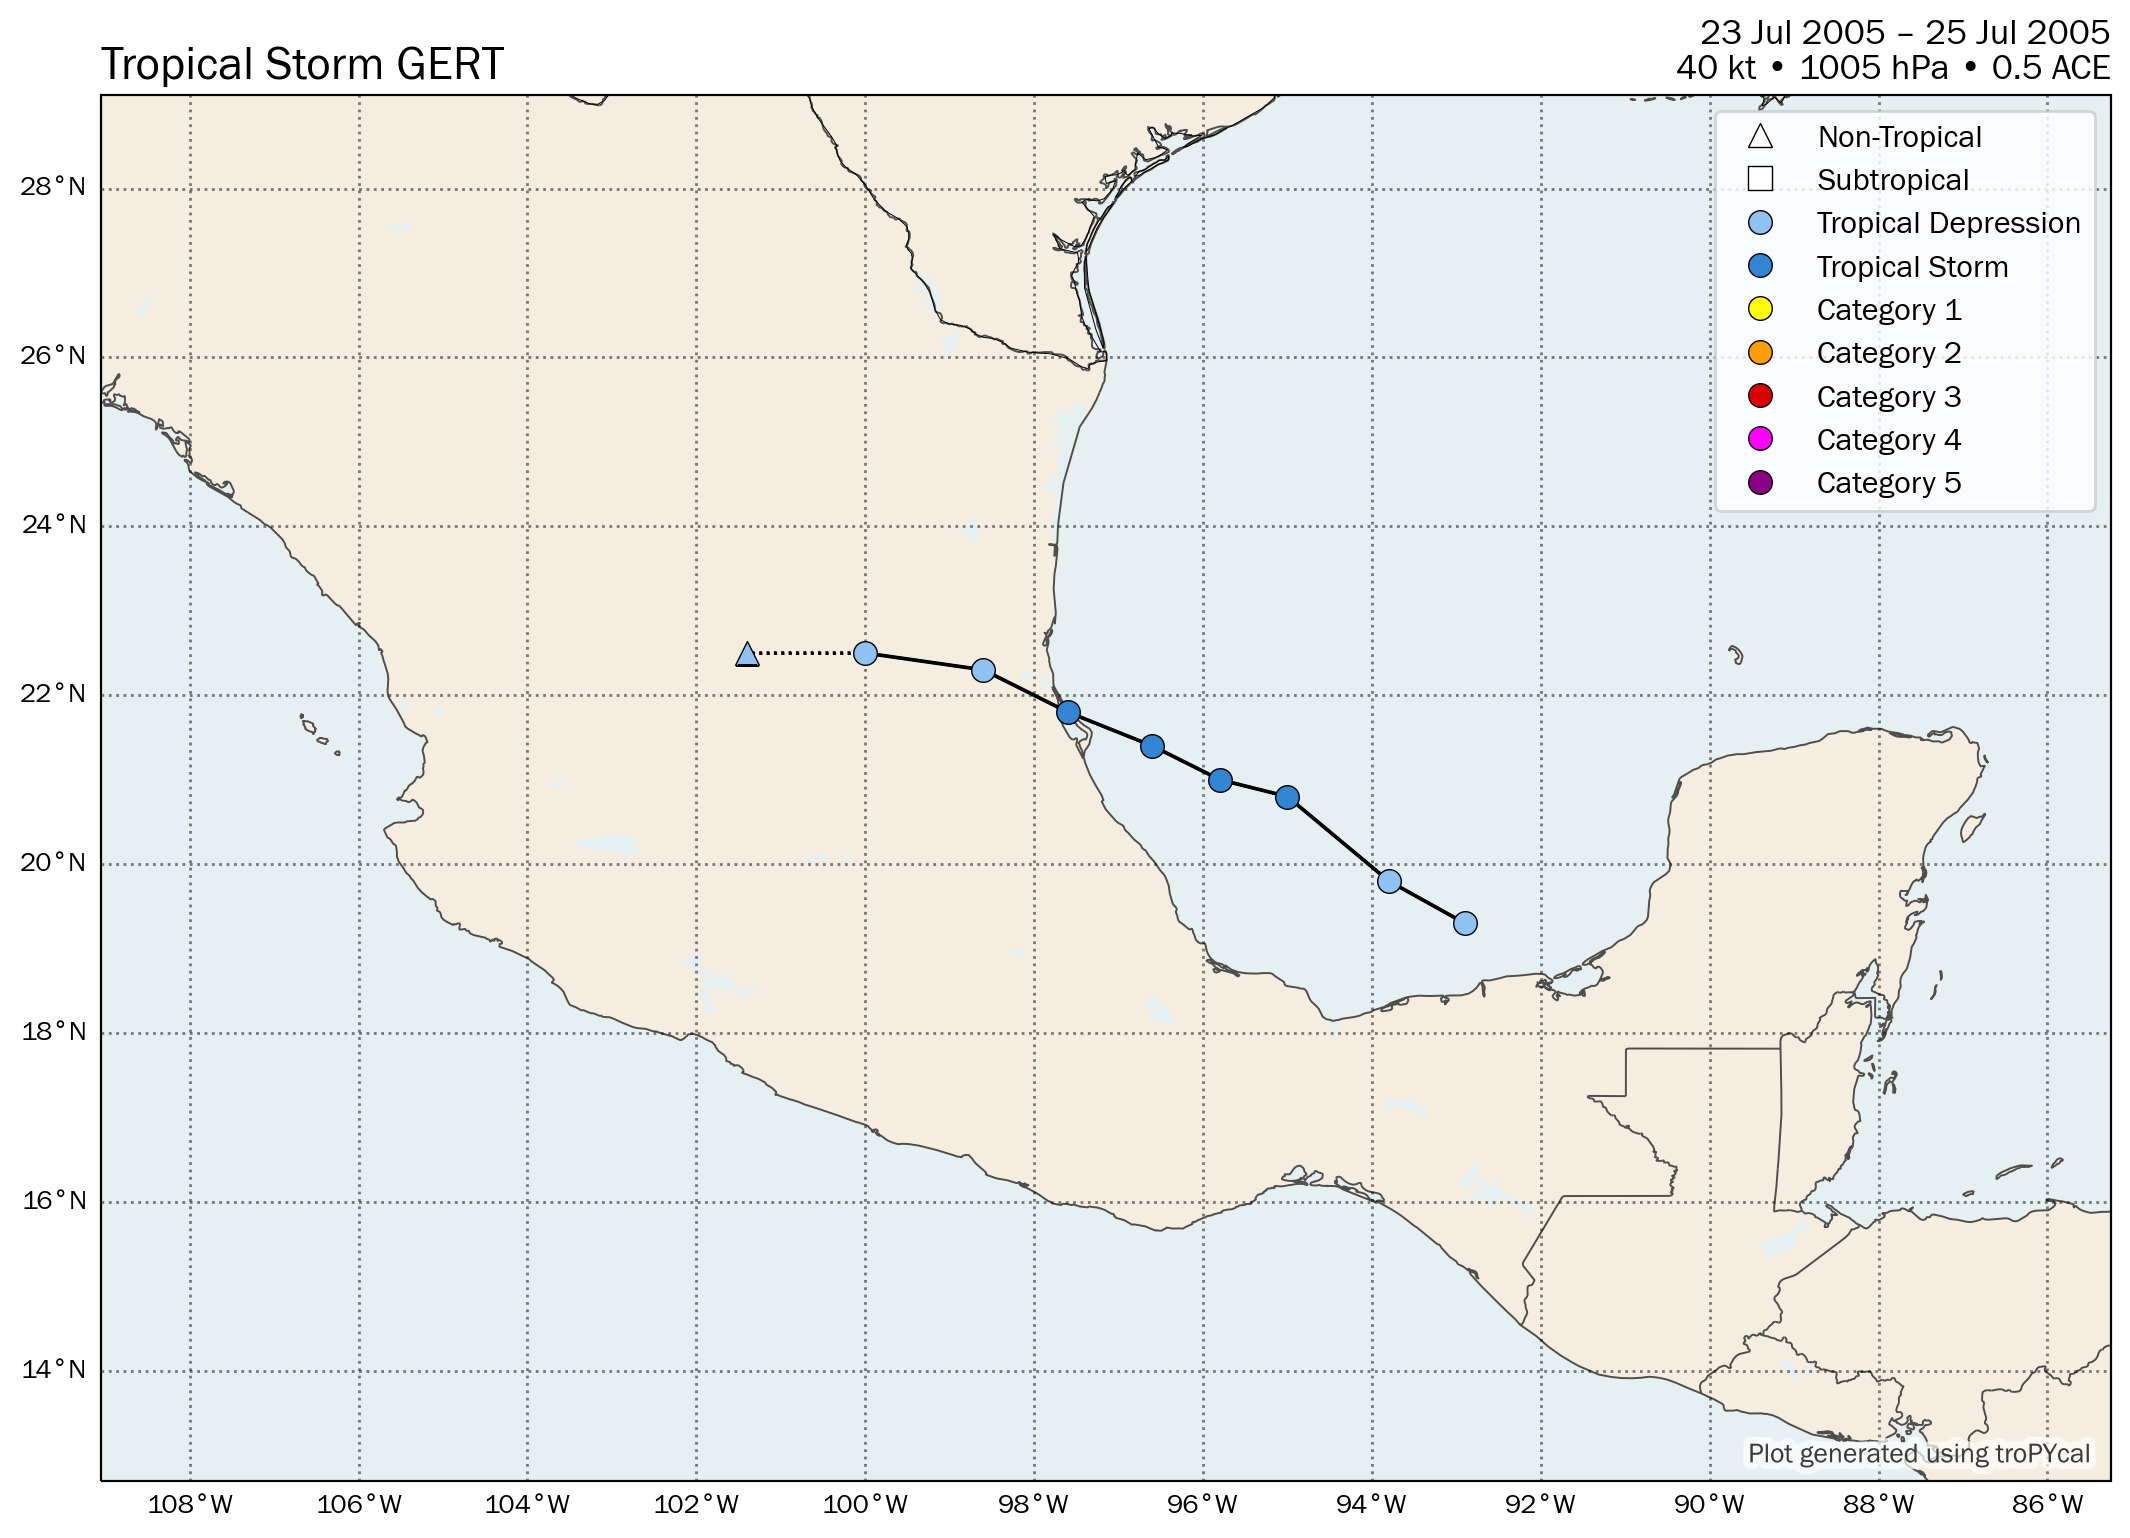
| Time (UTC) | Lat | Lon | Wind (mph) | Pressure | Storm Type | Category |
|---|---|---|---|---|---|---|
| 1800 UTC 23 Jul | 19.3 | -92.9 | 30 | 1011 | Tropical Depression | - |
| 0000 UTC 24 Jul | 19.8 | -93.8 | 35 | 1009 | Tropical Depression | - |
| 0600 UTC 24 Jul | 20.8 | -95.0 | 40 | 1009 | Tropical Storm | - |
| 1200 UTC 24 Jul | 21.0 | -95.8 | 40 | 1008 | Tropical Storm | - |
| 1800 UTC 24 Jul | 21.4 | -96.6 | 40 | 1007 | Tropical Storm | - |
| 0000 UTC 25 Jul | 21.8 | -97.6 | 45 | 1005 | Tropical Storm | - |
| 0600 UTC 25 Jul | 22.3 | -98.6 | 35 | 1006 | Tropical Depression | - |
| 1200 UTC 25 Jul | 22.5 | -100.0 | 30 | 1006 | Tropical Depression | - |
| 1800 UTC 25 Jul | 22.5 | -101.4 | 25 | 1007 | Remnant Low | - |
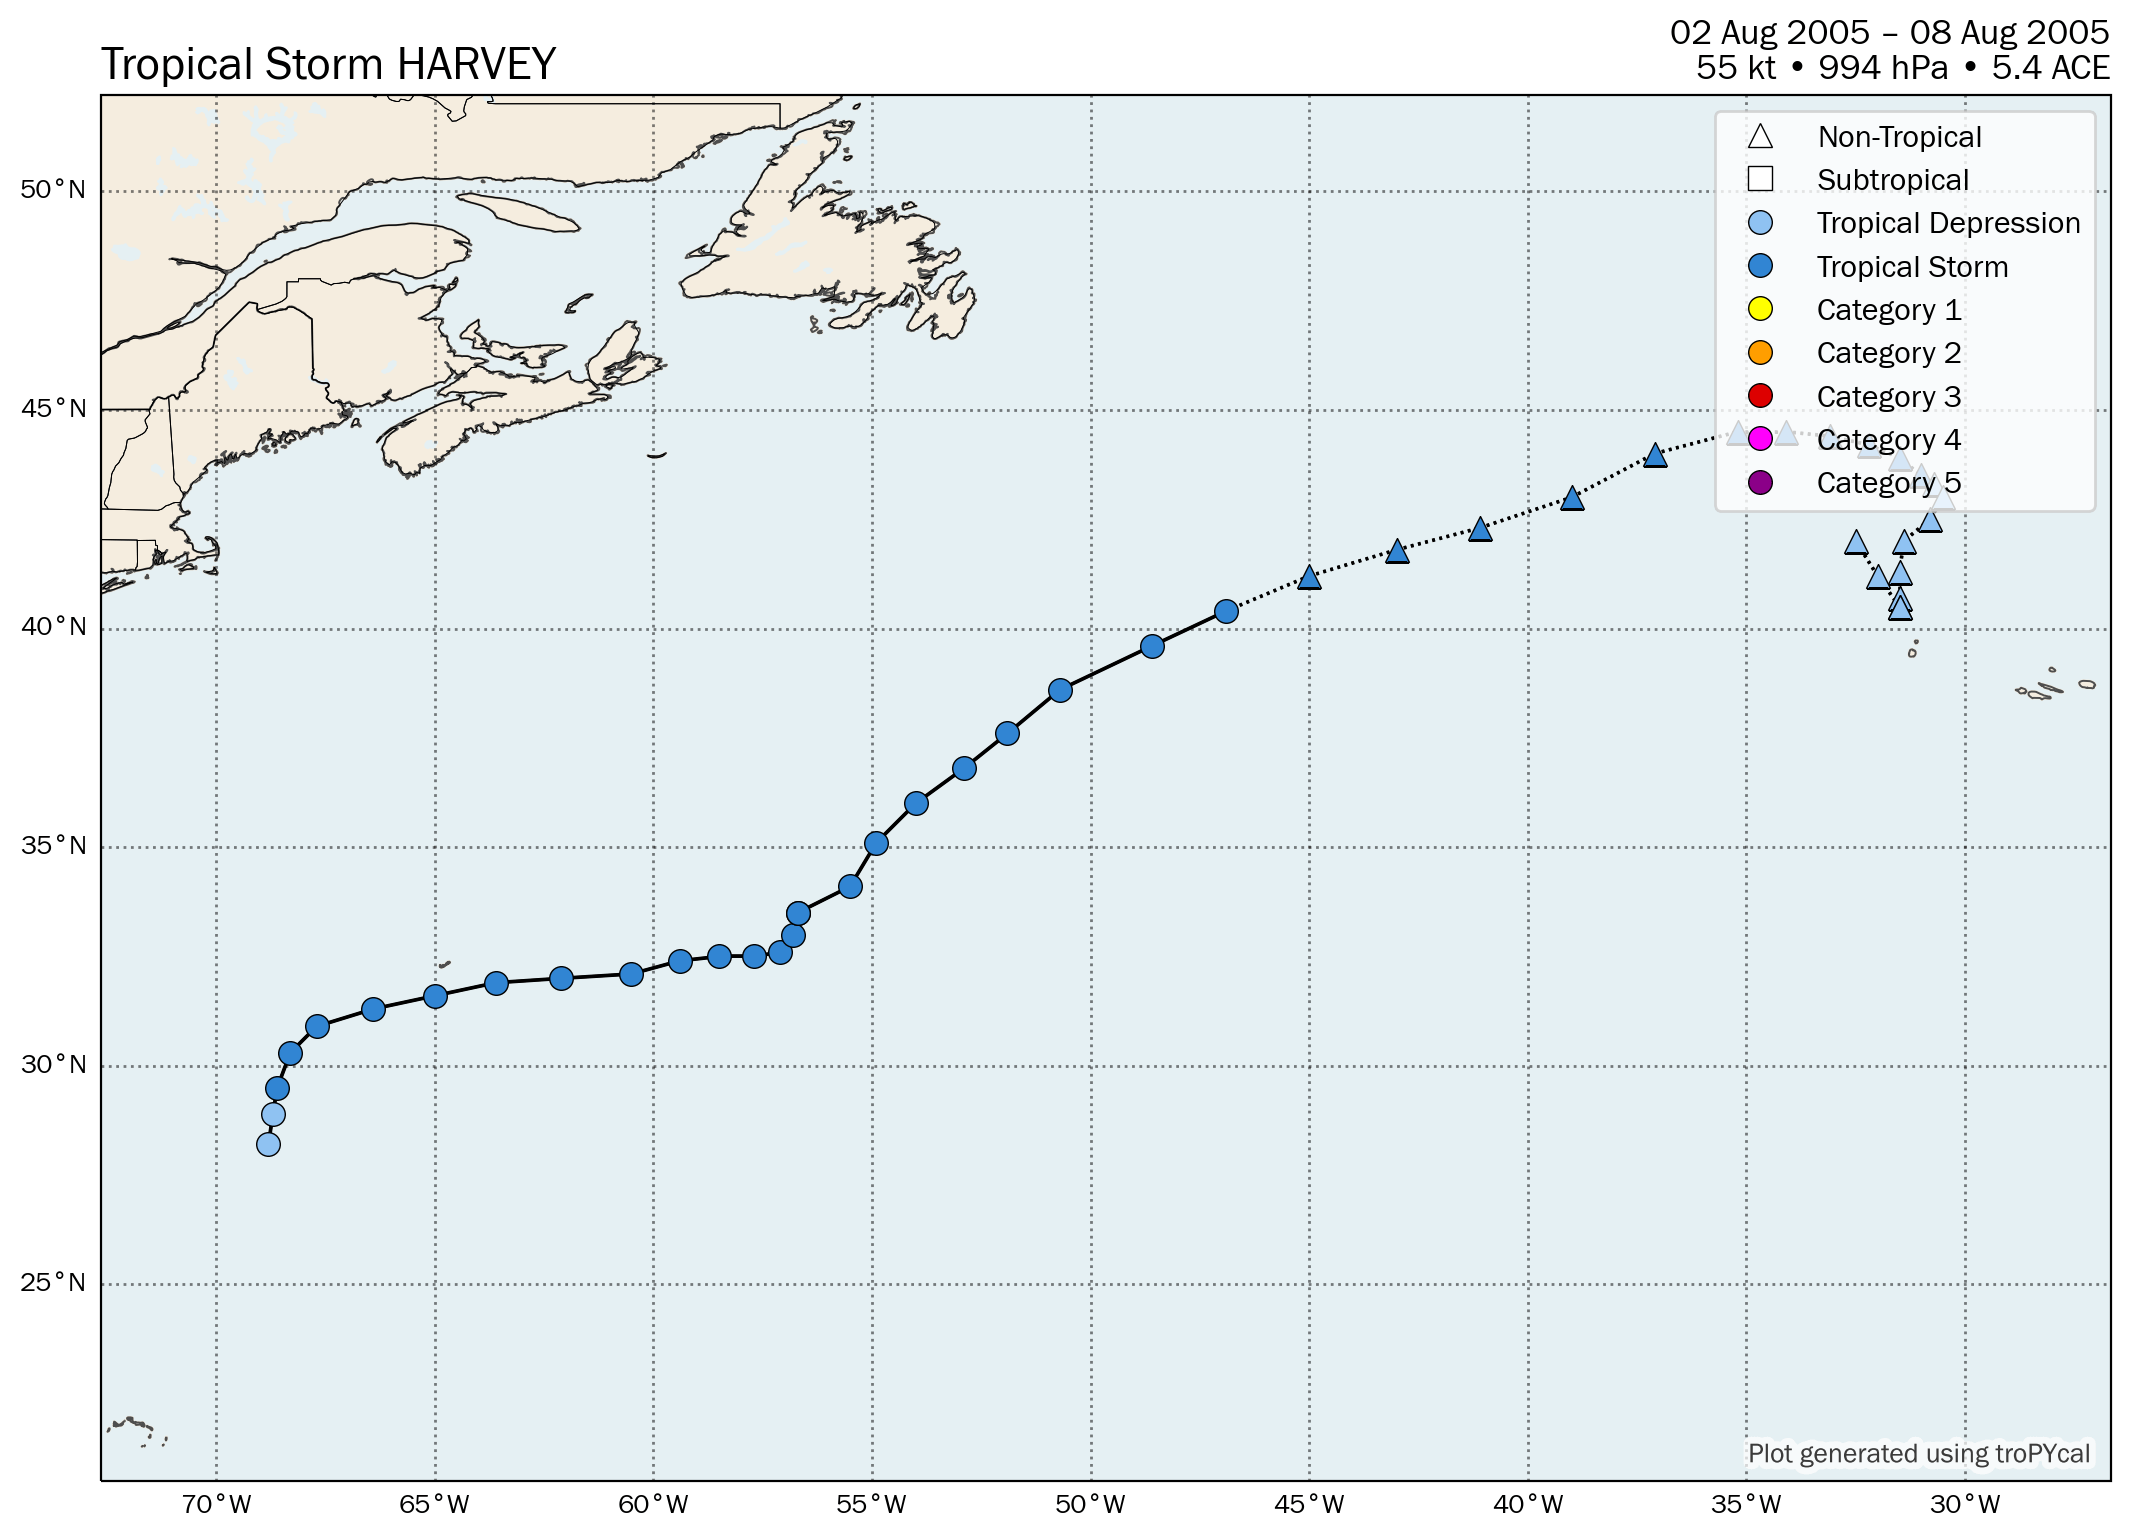
| Time (UTC) | Lat | Lon | Wind (mph) | Pressure | Storm Type | Category |
|---|---|---|---|---|---|---|
| 1800 UTC 02 Aug | 28.2 | -68.8 | 35 | 1006 | Tropical Depression | - |
| 0000 UTC 03 Aug | 28.9 | -68.7 | 35 | 1005 | Tropical Depression | - |
| 0600 UTC 03 Aug | 29.5 | -68.6 | 45 | 1003 | Tropical Storm | - |
| 1200 UTC 03 Aug | 30.3 | -68.3 | 50 | 1001 | Tropical Storm | - |
| 1800 UTC 03 Aug | 30.9 | -67.7 | 60 | 999 | Tropical Storm | - |
| 0000 UTC 04 Aug | 31.3 | -66.4 | 60 | 997 | Tropical Storm | - |
| 0600 UTC 04 Aug | 31.6 | -65.0 | 60 | 995 | Tropical Storm | - |
| 1200 UTC 04 Aug | 31.9 | -63.6 | 60 | 995 | Tropical Storm | - |
| 1800 UTC 04 Aug | 32.0 | -62.1 | 65 | 994 | Tropical Storm | - |
| 0000 UTC 05 Aug | 32.1 | -60.5 | 65 | 994 | Tropical Storm | - |
| 0600 UTC 05 Aug | 32.4 | -59.4 | 65 | 994 | Tropical Storm | - |
| 1200 UTC 05 Aug | 32.5 | -58.5 | 60 | 995 | Tropical Storm | - |
| 1800 UTC 05 Aug | 32.5 | -57.7 | 50 | 997 | Tropical Storm | - |
| 0000 UTC 06 Aug | 32.6 | -57.1 | 50 | 997 | Tropical Storm | - |
| 0600 UTC 06 Aug | 33.0 | -56.8 | 60 | 995 | Tropical Storm | - |
| 1200 UTC 06 Aug | 33.5 | -56.7 | 60 | 995 | Tropical Storm | - |
| 1800 UTC 06 Aug | 33.5 | -56.7 | 60 | 995 | Tropical Storm | - |
| 0000 UTC 07 Aug | 34.1 | -55.5 | 60 | 995 | Tropical Storm | - |
| 0600 UTC 07 Aug | 35.1 | -54.9 | 60 | 995 | Tropical Storm | - |
| 1200 UTC 07 Aug | 36.0 | -54.0 | 50 | 998 | Tropical Storm | - |
| 1800 UTC 07 Aug | 36.8 | -52.9 | 50 | 998 | Tropical Storm | - |
| 0000 UTC 08 Aug | 37.6 | -51.9 | 50 | 998 | Tropical Storm | - |
| 0600 UTC 08 Aug | 38.6 | -50.7 | 50 | 998 | Tropical Storm | - |
| 1200 UTC 08 Aug | 39.6 | -48.6 | 50 | 998 | Tropical Storm | - |
| 1800 UTC 08 Aug | 40.4 | -46.9 | 50 | 998 | Tropical Storm | - |
| 0000 UTC 09 Aug | 41.2 | -45.0 | 50 | 997 | Post-Tropical Cyclone | - |
| 0600 UTC 09 Aug | 41.8 | -43.0 | 60 | 995 | Post-Tropical Cyclone | - |
| 1200 UTC 09 Aug | 42.3 | -41.1 | 60 | 995 | Post-Tropical Cyclone | - |
| 1800 UTC 09 Aug | 43.0 | -39.0 | 60 | 994 | Post-Tropical Cyclone | - |
| 0000 UTC 10 Aug | 44.0 | -37.1 | 60 | 994 | Post-Tropical Cyclone | - |
| 0600 UTC 10 Aug | 44.5 | -35.2 | 60 | 994 | Post-Tropical Cyclone | - |
| 1200 UTC 10 Aug | 44.5 | -34.1 | 60 | 994 | Post-Tropical Cyclone | - |
| 1800 UTC 10 Aug | 44.4 | -33.1 | 60 | 994 | Post-Tropical Cyclone | - |
| 0000 UTC 11 Aug | 44.2 | -32.2 | 50 | 997 | Post-Tropical Cyclone | - |
| 0600 UTC 11 Aug | 43.9 | -31.5 | 45 | 1000 | Post-Tropical Cyclone | - |
| 1200 UTC 11 Aug | 43.5 | -31.0 | 40 | 1003 | Post-Tropical Cyclone | - |
| 1800 UTC 11 Aug | 43.3 | -30.7 | 35 | 1005 | Post-Tropical Cyclone | - |
| 0000 UTC 12 Aug | 43.0 | -30.5 | 35 | 1007 | Post-Tropical Cyclone | - |
| 0600 UTC 12 Aug | 42.5 | -30.8 | 35 | 1008 | Post-Tropical Cyclone | - |
| 1200 UTC 12 Aug | 42.0 | -31.4 | 35 | 1009 | Post-Tropical Cyclone | - |
| 1800 UTC 12 Aug | 41.3 | -31.5 | 30 | 1010 | Remnant Low | - |
| 0000 UTC 13 Aug | 40.7 | -31.5 | 30 | 1010 | Remnant Low | - |
| 0600 UTC 13 Aug | 40.5 | -31.5 | 30 | 1011 | Remnant Low | - |
| 1200 UTC 13 Aug | 40.5 | -31.5 | 30 | 1011 | Remnant Low | - |
| 1800 UTC 13 Aug | 41.2 | -32.0 | 30 | 1012 | Remnant Low | - |
| 0000 UTC 14 Aug | 42.0 | -32.5 | 30 | 1015 | Remnant Low | - |
Summary Plot
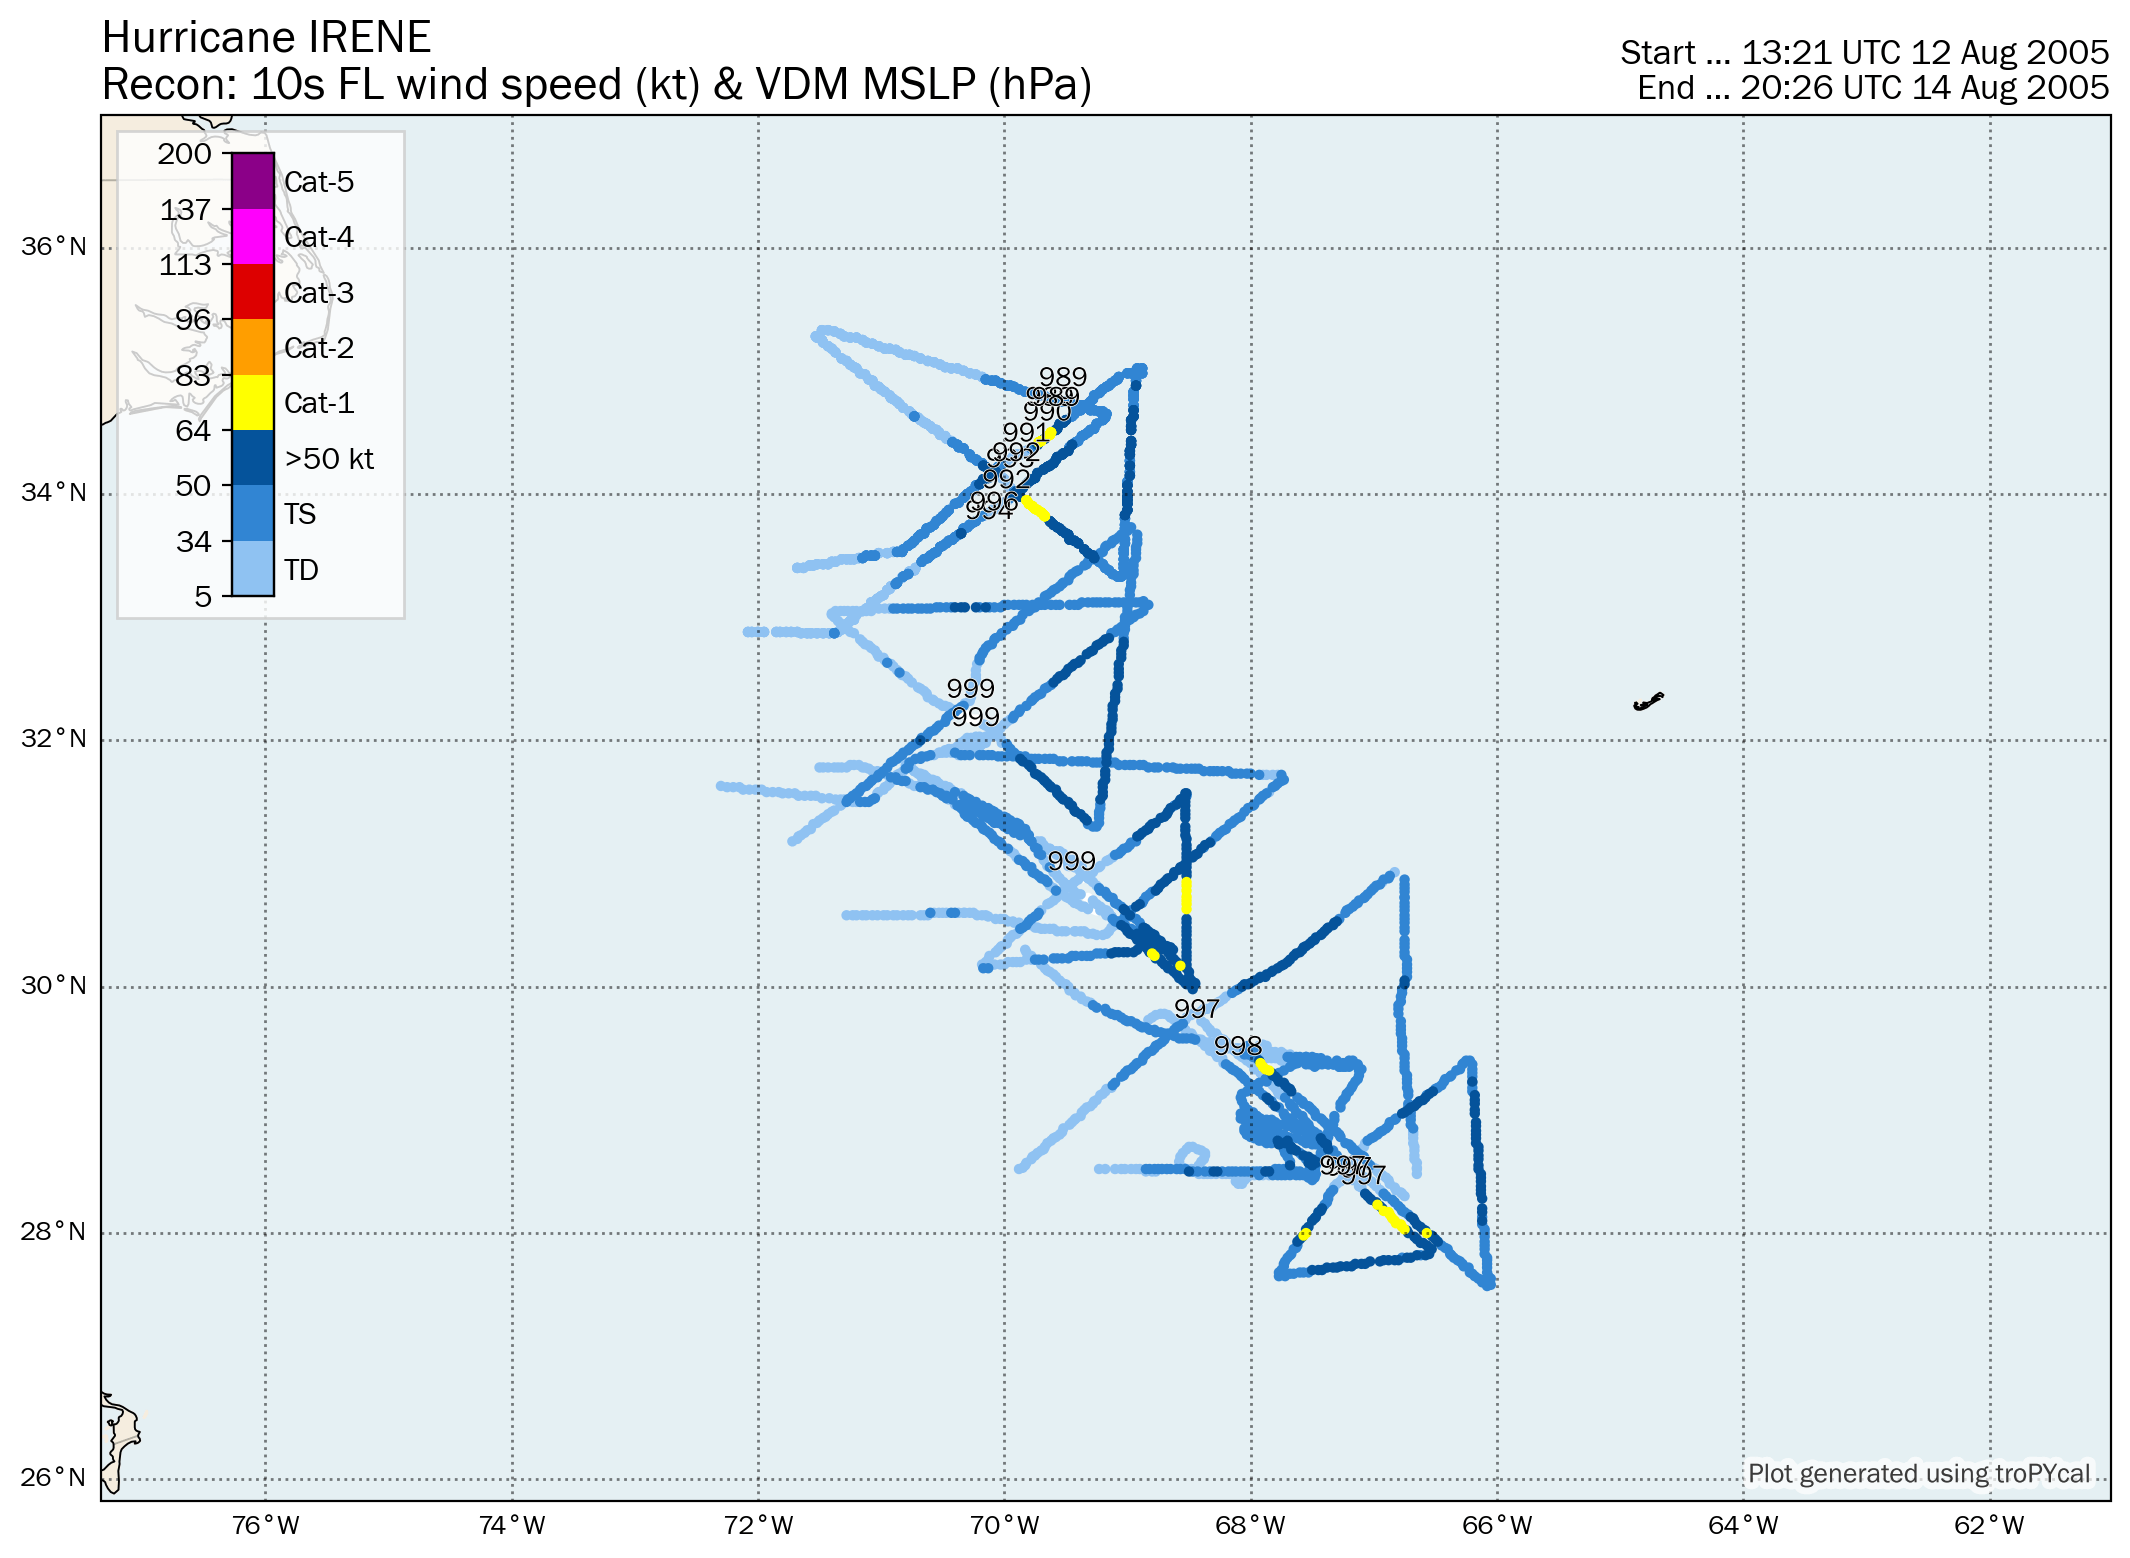
Recon-Derived Hovmoller
Recon-Derived Wind Swath
| Time (UTC) | Lat | Lon | Wind (mph) | Pressure | Storm Type | Category |
|---|---|---|---|---|---|---|
| 1800 UTC 04 Aug | 12.9 | -33.5 | 30 | 1009 | Tropical Depression | - |
| 0000 UTC 05 Aug | 13.6 | -34.5 | 30 | 1009 | Tropical Depression | - |
| 0600 UTC 05 Aug | 14.6 | -35.5 | 30 | 1009 | Tropical Depression | - |
| 1200 UTC 05 Aug | 15.6 | -36.8 | 35 | 1008 | Tropical Depression | - |
| 1800 UTC 05 Aug | 16.6 | -38.4 | 35 | 1008 | Tropical Depression | - |
| 0000 UTC 06 Aug | 17.2 | -39.8 | 35 | 1008 | Tropical Depression | - |
| 0600 UTC 06 Aug | 17.7 | -40.5 | 35 | 1008 | Tropical Depression | - |
| 1200 UTC 06 Aug | 18.2 | -41.6 | 35 | 1008 | Tropical Depression | - |
| 1800 UTC 06 Aug | 18.8 | -42.8 | 35 | 1008 | Tropical Depression | - |
| 0000 UTC 07 Aug | 19.3 | -43.5 | 35 | 1008 | Tropical Depression | - |
| 0600 UTC 07 Aug | 19.7 | -44.2 | 35 | 1007 | Tropical Depression | - |
| 1200 UTC 07 Aug | 20.2 | -45.0 | 40 | 1005 | Tropical Storm | - |
| 1800 UTC 07 Aug | 20.8 | -46.0 | 40 | 1005 | Tropical Storm | - |
| 0000 UTC 08 Aug | 21.3 | -47.2 | 40 | 1005 | Tropical Storm | - |
| 0600 UTC 08 Aug | 21.8 | -48.3 | 40 | 1006 | Tropical Storm | - |
| 1200 UTC 08 Aug | 22.2 | -49.9 | 35 | 1009 | Tropical Depression | - |
| 1800 UTC 08 Aug | 22.4 | -50.9 | 35 | 1009 | Tropical Depression | - |
| 0000 UTC 09 Aug | 22.5 | -52.0 | 35 | 1009 | Tropical Depression | - |
| 0600 UTC 09 Aug | 22.4 | -52.9 | 35 | 1009 | Tropical Depression | - |
| 1200 UTC 09 Aug | 22.4 | -53.7 | 35 | 1009 | Tropical Depression | - |
| 1800 UTC 09 Aug | 22.4 | -54.8 | 35 | 1009 | Tropical Depression | - |
| 0000 UTC 10 Aug | 22.4 | -55.7 | 35 | 1009 | Tropical Depression | - |
| 0600 UTC 10 Aug | 22.3 | -56.5 | 35 | 1009 | Tropical Depression | - |
| 1200 UTC 10 Aug | 22.4 | -57.2 | 35 | 1009 | Tropical Depression | - |
| 1800 UTC 10 Aug | 22.8 | -58.1 | 35 | 1008 | Tropical Depression | - |
| 0000 UTC 11 Aug | 23.3 | -59.3 | 40 | 1005 | Tropical Storm | - |
| 0600 UTC 11 Aug | 23.9 | -60.4 | 45 | 1003 | Tropical Storm | - |
| 1200 UTC 11 Aug | 24.7 | -61.7 | 50 | 1001 | Tropical Storm | - |
| 1800 UTC 11 Aug | 25.4 | -62.9 | 50 | 1001 | Tropical Storm | - |
| 0000 UTC 12 Aug | 26.3 | -63.8 | 50 | 1001 | Tropical Storm | - |
| 0600 UTC 12 Aug | 27.2 | -65.1 | 65 | 998 | Tropical Storm | - |
| 1200 UTC 12 Aug | 27.9 | -66.3 | 65 | 996 | Tropical Storm | - |
| 1800 UTC 12 Aug | 28.4 | -67.1 | 65 | 995 | Tropical Storm | - |
| 0000 UTC 13 Aug | 28.9 | -67.7 | 70 | 993 | Tropical Storm | - |
| 0600 UTC 13 Aug | 29.6 | -68.2 | 70 | 996 | Tropical Storm | - |
| 1200 UTC 13 Aug | 30.0 | -69.0 | 70 | 997 | Tropical Storm | - |
| 1800 UTC 13 Aug | 30.8 | -69.4 | 70 | 1000 | Tropical Storm | - |
| 0000 UTC 14 Aug | 31.6 | -69.9 | 70 | 997 | Tropical Storm | - |
| 0600 UTC 14 Aug | 32.1 | -70.2 | 65 | 999 | Tropical Storm | - |
| 1200 UTC 14 Aug | 33.1 | -70.1 | 65 | 999 | Tropical Storm | - |
| 1800 UTC 14 Aug | 34.0 | -70.0 | 70 | 994 | Tropical Storm | - |
| 0000 UTC 15 Aug | 34.9 | -69.5 | 80 | 989 | Hurricane | 1 |
| 0600 UTC 15 Aug | 35.7 | -68.7 | 85 | 985 | Hurricane | 1 |
| 1200 UTC 15 Aug | 36.3 | -67.7 | 85 | 985 | Hurricane | 1 |
| 1800 UTC 15 Aug | 36.5 | -66.5 | 90 | 980 | Hurricane | 1 |
| 0000 UTC 16 Aug | 36.6 | -65.1 | 90 | 980 | Hurricane | 1 |
| 0600 UTC 16 Aug | 36.6 | -64.0 | 90 | 978 | Hurricane | 1 |
| 1200 UTC 16 Aug | 36.6 | -63.0 | 100 | 975 | Hurricane | 2 |
| 1800 UTC 16 Aug | 36.5 | -62.0 | 105 | 970 | Hurricane | 2 |
| 0000 UTC 17 Aug | 36.5 | -61.3 | 90 | 978 | Hurricane | 1 |
| 0600 UTC 17 Aug | 36.5 | -60.6 | 85 | 983 | Hurricane | 1 |
| 1200 UTC 17 Aug | 36.9 | -59.1 | 75 | 987 | Hurricane | 1 |
| 1800 UTC 17 Aug | 37.6 | -57.3 | 75 | 987 | Hurricane | 1 |
| 0000 UTC 18 Aug | 38.6 | -55.0 | 70 | 990 | Tropical Storm | - |
| 0600 UTC 18 Aug | 40.3 | -52.3 | 70 | 990 | Tropical Storm | - |
| 1200 UTC 18 Aug | 43.3 | -48.9 | 60 | 992 | Tropical Storm | - |
| Time (UTC) | Lat | Lon | Wind (mph) | Pressure | Storm Type | Category |
|---|---|---|---|---|---|---|
| 1200 UTC 13 Aug | 13.3 | -43.6 | 30 | 1009 | Tropical Depression | - |
| 1800 UTC 13 Aug | 13.8 | -44.7 | 35 | 1008 | Tropical Depression | - |
| 0000 UTC 14 Aug | 13.8 | -45.7 | 35 | 1008 | Tropical Depression | - |
| 0600 UTC 14 Aug | 13.4 | -46.0 | 30 | 1009 | Tropical Depression | - |
| 1200 UTC 14 Aug | 13.5 | -46.4 | 30 | 1009 | Tropical Depression | - |
| 1800 UTC 14 Aug | 13.9 | -46.7 | 30 | 1010 | Remnant Low | - |
| 0000 UTC 15 Aug | 14.4 | -47.4 | 30 | 1010 | Remnant Low | - |
| 0600 UTC 15 Aug | 14.5 | -48.4 | 30 | 1010 | Remnant Low | - |
| 1200 UTC 15 Aug | 14.6 | -49.3 | 30 | 1010 | Remnant Low | - |
| 1800 UTC 15 Aug | 14.8 | -49.9 | 30 | 1010 | Remnant Low | - |
| 0000 UTC 16 Aug | 15.1 | -50.4 | 30 | 1010 | Remnant Low | - |
| 0600 UTC 16 Aug | 15.5 | -51.1 | 30 | 1010 | Remnant Low | - |
| 1200 UTC 16 Aug | 16.0 | -52.0 | 30 | 1010 | Remnant Low | - |
| 1800 UTC 16 Aug | 16.1 | -53.2 | 30 | 1010 | Remnant Low | - |
| 0000 UTC 17 Aug | 16.1 | -54.1 | 30 | 1010 | Remnant Low | - |
| 0600 UTC 17 Aug | 16.1 | -54.9 | 30 | 1010 | Remnant Low | - |
| 1200 UTC 17 Aug | 16.7 | -55.6 | 30 | 1010 | Remnant Low | - |
| 1800 UTC 17 Aug | 17.1 | -56.6 | 30 | 1010 | Remnant Low | - |
| 0000 UTC 18 Aug | 17.3 | -57.7 | 30 | 1010 | Remnant Low | - |
| 0600 UTC 18 Aug | 17.6 | -58.9 | 30 | 1012 | Remnant Low | - |
| 1200 UTC 18 Aug | 18.0 | -60.1 | 30 | 1014 | Remnant Low | - |
| Time (UTC) | Lat | Lon | Wind (mph) | Pressure | Storm Type | Category |
|---|---|---|---|---|---|---|
| 1200 UTC 22 Aug | 19.4 | -94.5 | 35 | 1006 | Tropical Depression | - |
| 1800 UTC 22 Aug | 19.6 | -95.0 | 40 | 1004 | Tropical Storm | - |
| 0000 UTC 23 Aug | 19.7 | -95.7 | 50 | 1001 | Tropical Storm | - |
| 0330 UTC 23 Aug | 19.7 | -96.4 | 60 | 998 | Tropical Storm | - |
| 0600 UTC 23 Aug | 19.7 | -96.7 | 40 | 1002 | Tropical Storm | - |
| 1200 UTC 23 Aug | 19.7 | -97.7 | 30 | 1005 | Tropical Depression | - |
Storm-Relative Tornadoes
Tornado Map
Summary Map
Gridded Rainfall
Summary Plot
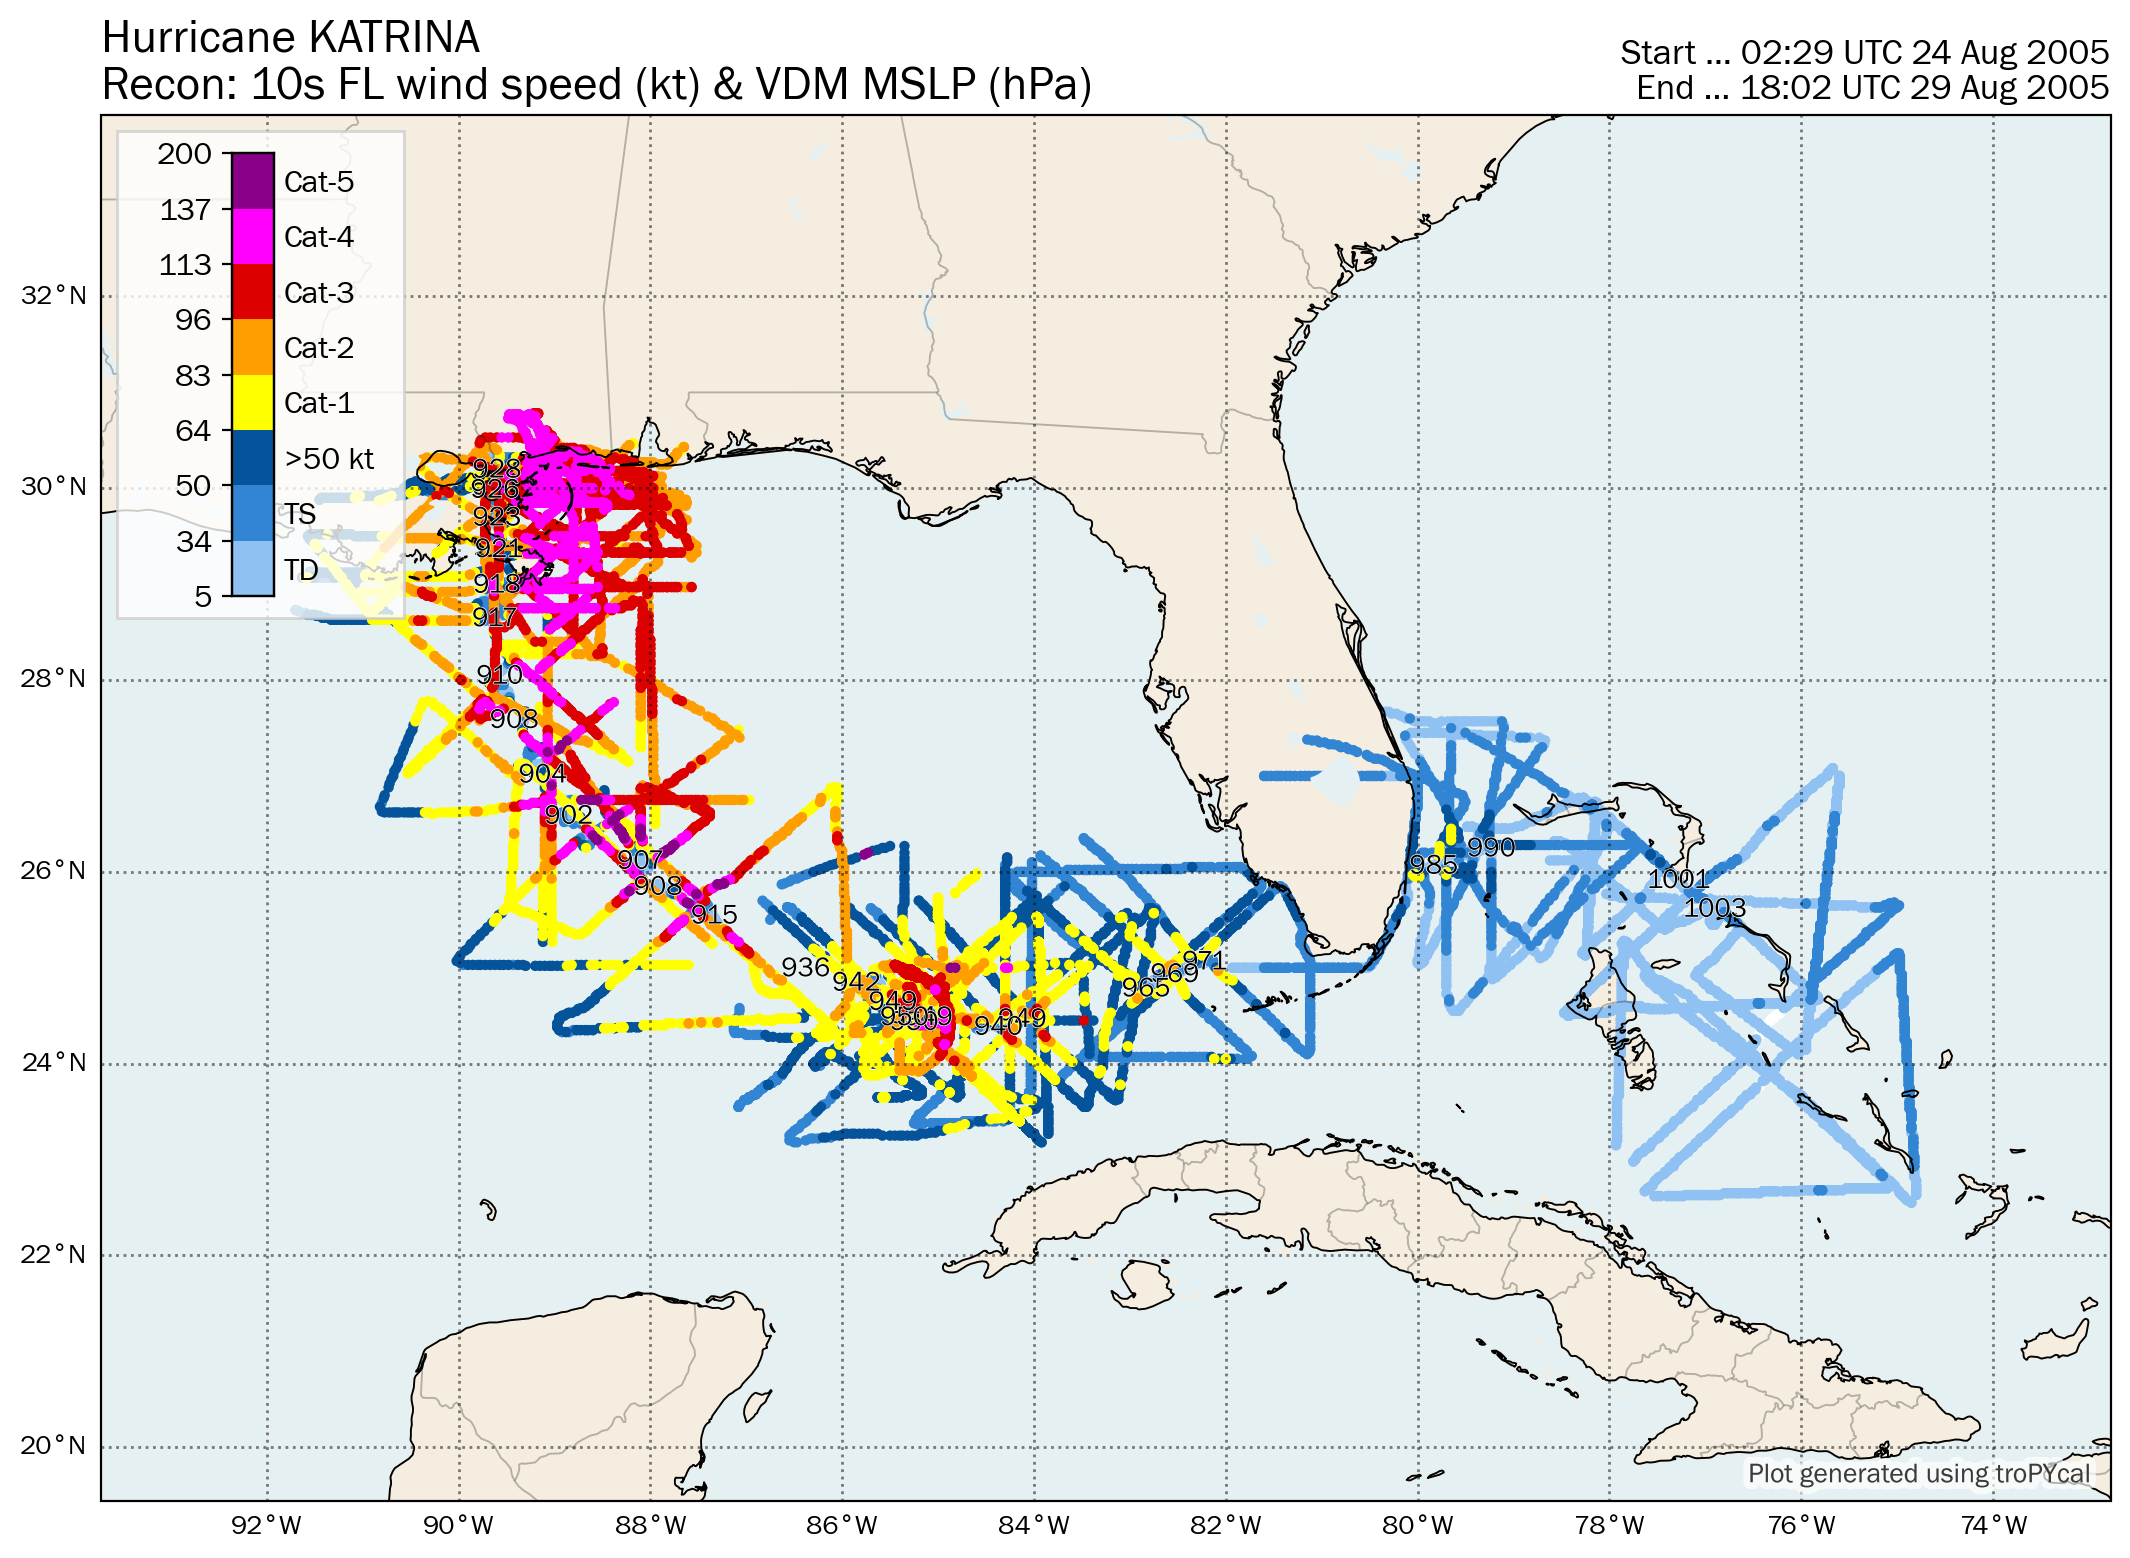
Recon-Derived Hovmoller
Recon-Derived Wind Swath
| Time (UTC) | Lat | Lon | Wind (mph) | Pressure | Storm Type | Category |
|---|---|---|---|---|---|---|
| 1800 UTC 23 Aug | 23.1 | -75.1 | 35 | 1008 | Tropical Depression | - |
| 0000 UTC 24 Aug | 23.4 | -75.7 | 35 | 1007 | Tropical Depression | - |
| 0600 UTC 24 Aug | 23.8 | -76.2 | 35 | 1007 | Tropical Depression | - |
| 1200 UTC 24 Aug | 24.5 | -76.5 | 40 | 1006 | Tropical Storm | - |
| 1800 UTC 24 Aug | 25.4 | -76.9 | 45 | 1003 | Tropical Storm | - |
| 0000 UTC 25 Aug | 26.0 | -77.7 | 50 | 1000 | Tropical Storm | - |
| 0600 UTC 25 Aug | 26.1 | -78.4 | 60 | 997 | Tropical Storm | - |
| 1200 UTC 25 Aug | 26.2 | -79.0 | 65 | 994 | Tropical Storm | - |
| 1800 UTC 25 Aug | 26.2 | -79.6 | 70 | 988 | Tropical Storm | - |
| 2230 UTC 25 Aug | 26.0 | -80.1 | 80 | 984 | Hurricane | 1 |
| 0000 UTC 26 Aug | 25.9 | -80.3 | 80 | 983 | Hurricane | 1 |
| 0600 UTC 26 Aug | 25.4 | -81.3 | 75 | 987 | Hurricane | 1 |
| 1200 UTC 26 Aug | 25.1 | -82.0 | 85 | 979 | Hurricane | 1 |
| 1800 UTC 26 Aug | 24.9 | -82.6 | 100 | 968 | Hurricane | 2 |
| 0000 UTC 27 Aug | 24.6 | -83.3 | 105 | 959 | Hurricane | 2 |
| 0600 UTC 27 Aug | 24.4 | -84.0 | 110 | 950 | Hurricane | 2 |
| 1200 UTC 27 Aug | 24.4 | -84.7 | 115 | 942 | Hurricane | 3 |
| 1800 UTC 27 Aug | 24.5 | -85.3 | 115 | 948 | Hurricane | 3 |
| 0000 UTC 28 Aug | 24.8 | -85.9 | 115 | 941 | Hurricane | 3 |
| 0600 UTC 28 Aug | 25.2 | -86.7 | 145 | 930 | Hurricane | 4 |
| 1200 UTC 28 Aug | 25.7 | -87.7 | 165 | 909 | Hurricane | 5 |
| 1800 UTC 28 Aug | 26.3 | -88.6 | 175 | 902 | Hurricane | 5 |
| 0000 UTC 29 Aug | 27.2 | -89.2 | 160 | 905 | Hurricane | 5 |
| 0600 UTC 29 Aug | 28.2 | -89.6 | 145 | 913 | Hurricane | 4 |
| 1110 UTC 29 Aug | 29.3 | -89.6 | 125 | 920 | Hurricane | 3 |
| 1200 UTC 29 Aug | 29.5 | -89.6 | 125 | 923 | Hurricane | 3 |
| 1445 UTC 29 Aug | 30.2 | -89.6 | 120 | 928 | Hurricane | 3 |
| 1800 UTC 29 Aug | 31.1 | -89.6 | 90 | 948 | Hurricane | 1 |
| 0000 UTC 30 Aug | 32.6 | -89.1 | 60 | 961 | Tropical Storm | - |
| 0600 UTC 30 Aug | 34.1 | -88.6 | 45 | 978 | Tropical Storm | - |
| 1200 UTC 30 Aug | 35.6 | -88.0 | 35 | 985 | Tropical Depression | - |
| 1800 UTC 30 Aug | 37.0 | -87.0 | 35 | 990 | Tropical Depression | - |
| 0000 UTC 31 Aug | 38.6 | -85.3 | 35 | 994 | Post-Tropical Cyclone | - |
| 0600 UTC 31 Aug | 40.1 | -82.9 | 30 | 996 | Post-Tropical Cyclone | - |
| Time (UTC) | Lat | Lon | Wind (mph) | Pressure | Storm Type | Category |
|---|---|---|---|---|---|---|
| 1200 UTC 28 Aug | 14.0 | -45.1 | 30 | 1009 | Tropical Depression | - |
| 1800 UTC 28 Aug | 14.9 | -46.4 | 30 | 1007 | Tropical Depression | - |
| 0000 UTC 29 Aug | 15.7 | -47.6 | 30 | 1007 | Tropical Depression | - |
| 0600 UTC 29 Aug | 17.0 | -48.9 | 30 | 1007 | Tropical Depression | - |
| 1200 UTC 29 Aug | 17.7 | -50.6 | 30 | 1008 | Tropical Depression | - |
| 1800 UTC 29 Aug | 18.5 | -52.5 | 25 | 1009 | Remnant Low | - |
| 0000 UTC 30 Aug | 20.5 | -53.2 | 25 | 1010 | Remnant Low | - |
| 0600 UTC 30 Aug | 22.1 | -53.6 | 25 | 1010 | Remnant Low | - |
| 1200 UTC 30 Aug | 24.2 | -54.2 | 25 | 1010 | Remnant Low | - |
| 1800 UTC 30 Aug | 25.5 | -53.6 | 30 | 1010 | Remnant Low | - |
| 0000 UTC 31 Aug | 26.9 | -52.7 | 30 | 1010 | Remnant Low | - |
| 0600 UTC 31 Aug | 28.0 | -51.6 | 35 | 1007 | Tropical Depression | - |
| 1200 UTC 31 Aug | 29.0 | -50.4 | 40 | 1006 | Tropical Storm | - |
| 1800 UTC 31 Aug | 30.1 | -50.1 | 40 | 1007 | Tropical Storm | - |
| 0000 UTC 01 Sep | 31.1 | -50.3 | 35 | 1009 | Tropical Depression | - |
| 0600 UTC 01 Sep | 31.9 | -51.2 | 35 | 1010 | Tropical Depression | - |
| 1200 UTC 01 Sep | 31.9 | -51.4 | 35 | 1010 | Tropical Depression | - |
| 1800 UTC 01 Sep | 32.3 | -51.5 | 35 | 1010 | Tropical Depression | - |
| 0000 UTC 02 Sep | 32.4 | -52.0 | 30 | 1010 | Tropical Depression | - |
| 0600 UTC 02 Sep | 32.6 | -52.3 | 30 | 1010 | Remnant Low | - |
| 1200 UTC 02 Sep | 33.2 | -52.3 | 30 | 1010 | Remnant Low | - |
| 1800 UTC 02 Sep | 33.9 | -52.7 | 30 | 1010 | Remnant Low | - |
| 0000 UTC 03 Sep | 34.7 | -53.2 | 30 | 1010 | Remnant Low | - |
| 0600 UTC 03 Sep | 35.5 | -53.9 | 30 | 1010 | Remnant Low | - |
| 1200 UTC 03 Sep | 36.6 | -54.2 | 30 | 1010 | Remnant Low | - |
| 1800 UTC 03 Sep | 37.4 | -53.9 | 30 | 1010 | Remnant Low | - |
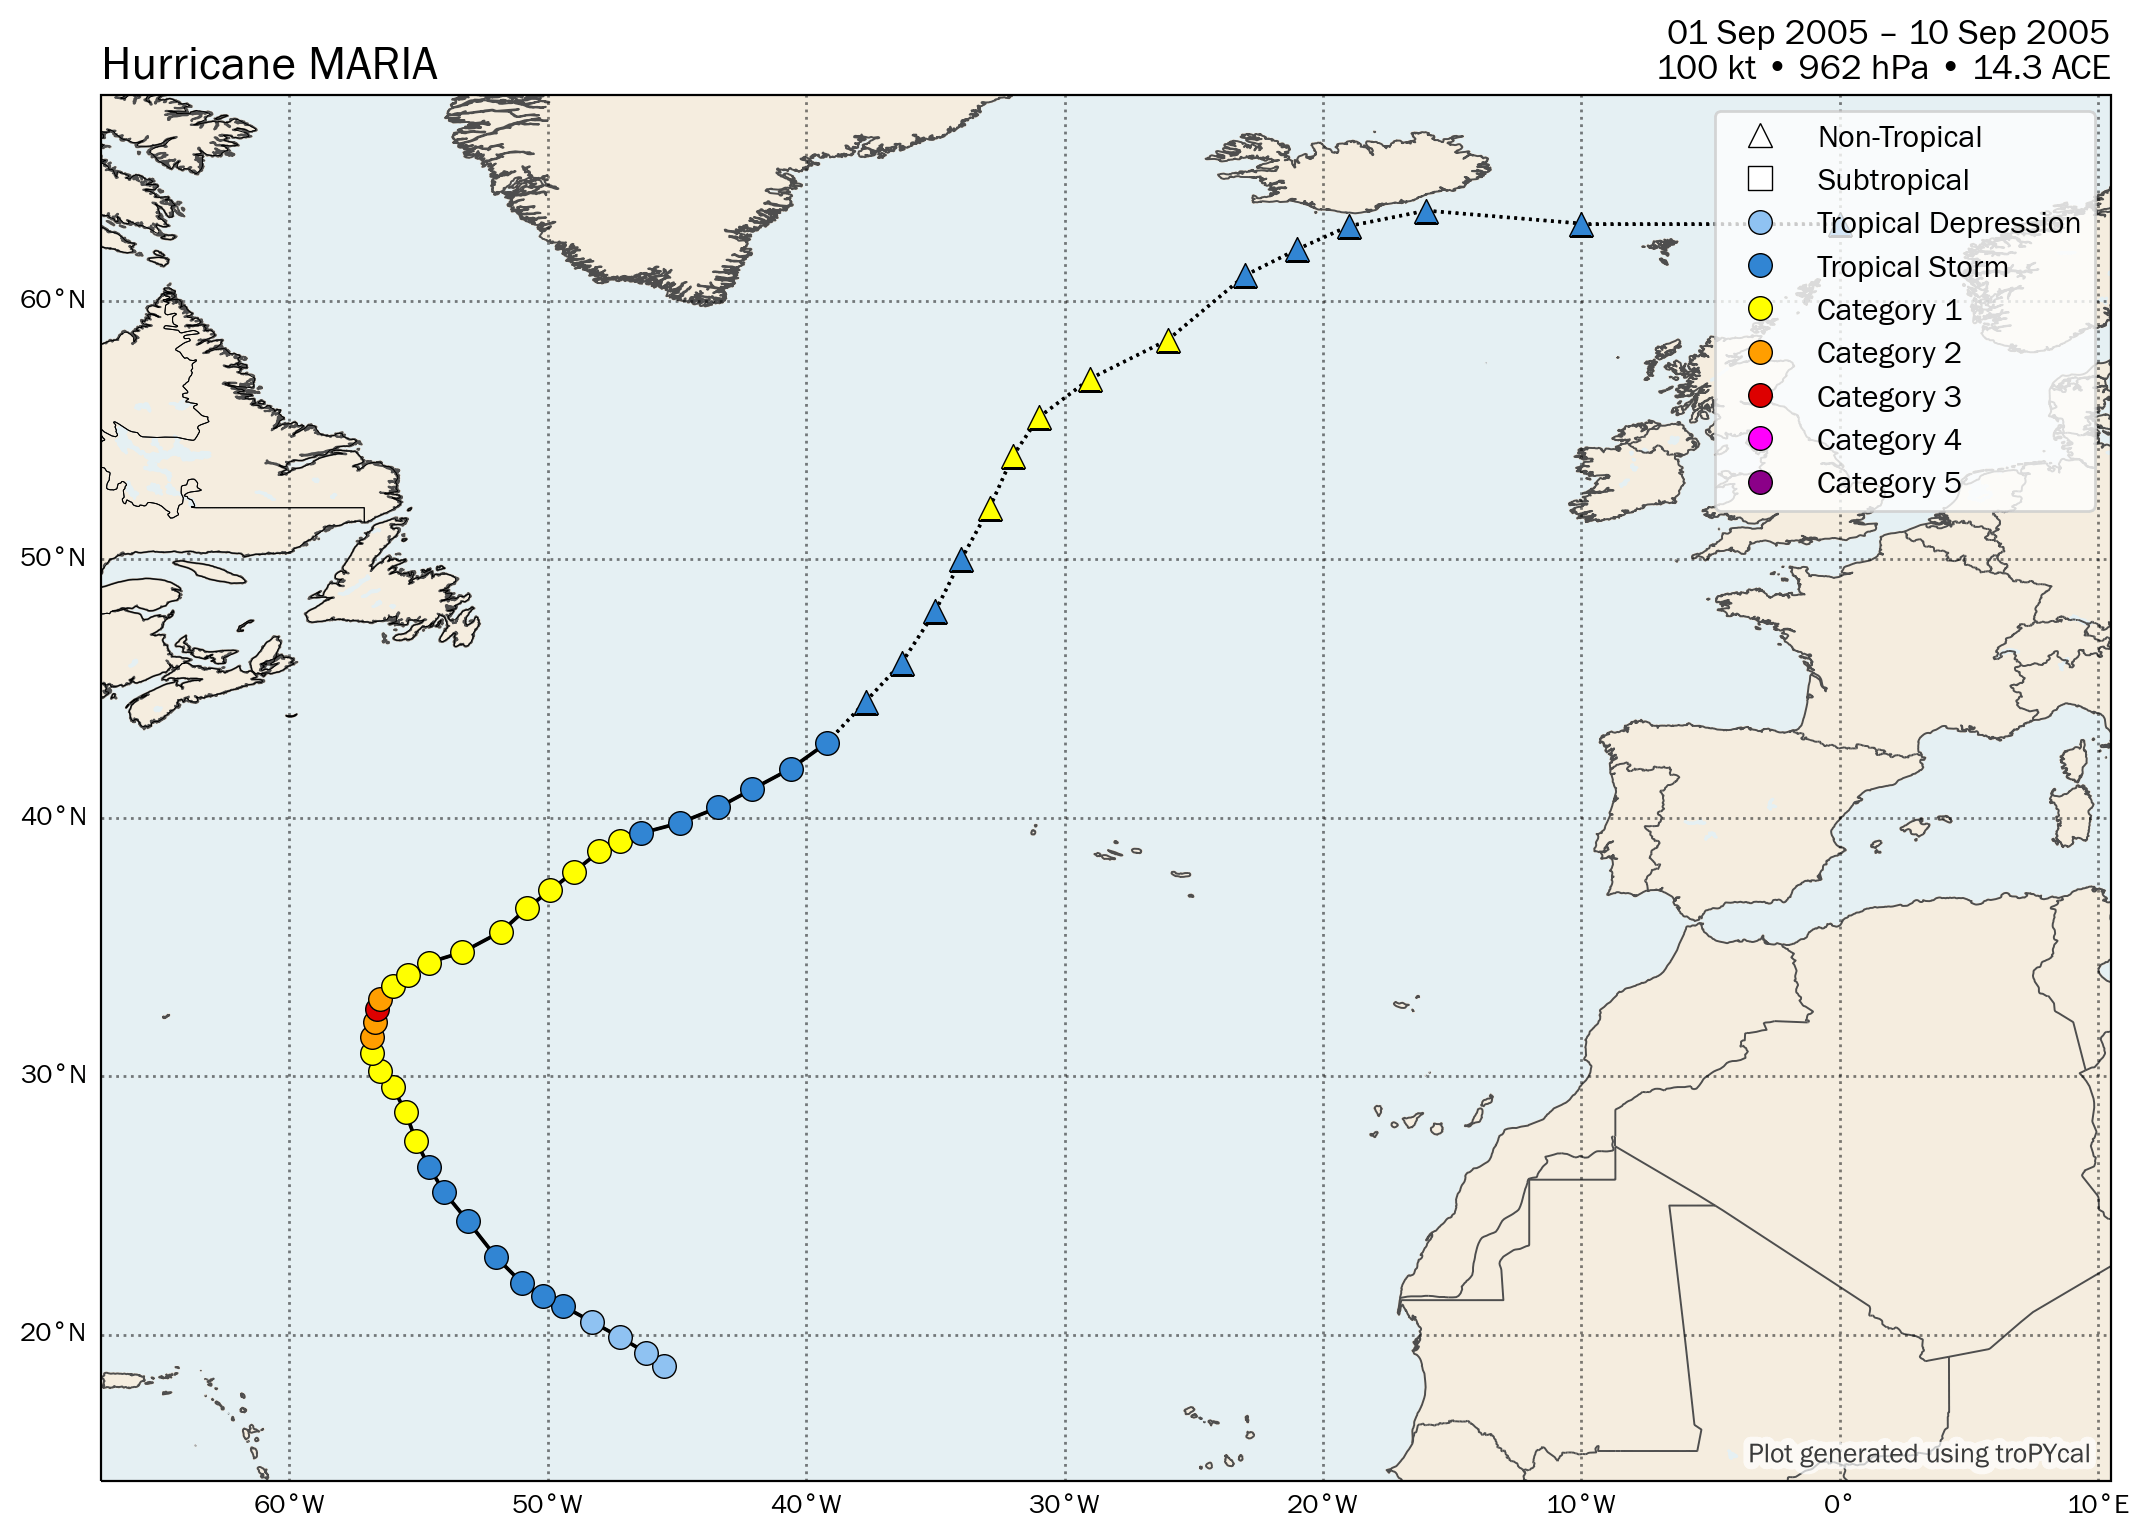
| Time (UTC) | Lat | Lon | Wind (mph) | Pressure | Storm Type | Category |
|---|---|---|---|---|---|---|
| 1200 UTC 01 Sep | 18.8 | -45.5 | 35 | 1008 | Tropical Depression | - |
| 1800 UTC 01 Sep | 19.3 | -46.2 | 35 | 1008 | Tropical Depression | - |
| 0000 UTC 02 Sep | 19.9 | -47.2 | 35 | 1008 | Tropical Depression | - |
| 0600 UTC 02 Sep | 20.5 | -48.3 | 35 | 1008 | Tropical Depression | - |
| 1200 UTC 02 Sep | 21.1 | -49.4 | 40 | 1006 | Tropical Storm | - |
| 1800 UTC 02 Sep | 21.5 | -50.2 | 45 | 1003 | Tropical Storm | - |
| 0000 UTC 03 Sep | 22.0 | -51.0 | 50 | 1001 | Tropical Storm | - |
| 0600 UTC 03 Sep | 23.0 | -52.0 | 50 | 1000 | Tropical Storm | - |
| 1200 UTC 03 Sep | 24.4 | -53.1 | 60 | 997 | Tropical Storm | - |
| 1800 UTC 03 Sep | 25.5 | -54.0 | 65 | 994 | Tropical Storm | - |
| 0000 UTC 04 Sep | 26.5 | -54.6 | 70 | 990 | Tropical Storm | - |
| 0600 UTC 04 Sep | 27.5 | -55.1 | 75 | 987 | Hurricane | 1 |
| 1200 UTC 04 Sep | 28.6 | -55.5 | 75 | 987 | Hurricane | 1 |
| 1800 UTC 04 Sep | 29.6 | -56.0 | 85 | 980 | Hurricane | 1 |
| 0000 UTC 05 Sep | 30.2 | -56.5 | 85 | 980 | Hurricane | 1 |
| 0600 UTC 05 Sep | 30.9 | -56.8 | 90 | 977 | Hurricane | 1 |
| 1200 UTC 05 Sep | 31.5 | -56.8 | 100 | 975 | Hurricane | 2 |
| 1800 UTC 05 Sep | 32.1 | -56.7 | 105 | 970 | Hurricane | 2 |
| 0000 UTC 06 Sep | 32.6 | -56.6 | 115 | 962 | Hurricane | 3 |
| 0600 UTC 06 Sep | 33.0 | -56.5 | 105 | 970 | Hurricane | 2 |
| 1200 UTC 06 Sep | 33.5 | -56.0 | 90 | 975 | Hurricane | 1 |
| 1800 UTC 06 Sep | 33.9 | -55.4 | 85 | 980 | Hurricane | 1 |
| 0000 UTC 07 Sep | 34.4 | -54.6 | 75 | 987 | Hurricane | 1 |
| 0600 UTC 07 Sep | 34.8 | -53.3 | 80 | 983 | Hurricane | 1 |
| 1200 UTC 07 Sep | 35.6 | -51.8 | 85 | 980 | Hurricane | 1 |
| 1800 UTC 07 Sep | 36.5 | -50.8 | 85 | 980 | Hurricane | 1 |
| 0000 UTC 08 Sep | 37.2 | -49.9 | 80 | 982 | Hurricane | 1 |
| 0600 UTC 08 Sep | 37.9 | -49.0 | 75 | 985 | Hurricane | 1 |
| 1200 UTC 08 Sep | 38.7 | -48.0 | 75 | 985 | Hurricane | 1 |
| 1800 UTC 08 Sep | 39.1 | -47.2 | 75 | 985 | Hurricane | 1 |
| 0000 UTC 09 Sep | 39.4 | -46.4 | 70 | 987 | Tropical Storm | - |
| 0600 UTC 09 Sep | 39.8 | -44.9 | 65 | 987 | Tropical Storm | - |
| 1200 UTC 09 Sep | 40.4 | -43.4 | 65 | 988 | Tropical Storm | - |
| 1800 UTC 09 Sep | 41.1 | -42.1 | 60 | 988 | Tropical Storm | - |
| 0000 UTC 10 Sep | 41.9 | -40.6 | 60 | 988 | Tropical Storm | - |
| 0600 UTC 10 Sep | 42.9 | -39.2 | 60 | 988 | Tropical Storm | - |
| 1200 UTC 10 Sep | 44.5 | -37.7 | 60 | 980 | Post-Tropical Cyclone | - |
| 1800 UTC 10 Sep | 46.0 | -36.3 | 65 | 975 | Post-Tropical Cyclone | - |
| 0000 UTC 11 Sep | 48.0 | -35.0 | 70 | 975 | Post-Tropical Cyclone | - |
| 0600 UTC 11 Sep | 50.0 | -34.0 | 70 | 974 | Post-Tropical Cyclone | - |
| 1200 UTC 11 Sep | 52.0 | -32.9 | 75 | 971 | Post-Tropical Cyclone | 1 |
| 1800 UTC 11 Sep | 54.0 | -32.0 | 75 | 968 | Post-Tropical Cyclone | 1 |
| 0000 UTC 12 Sep | 55.5 | -31.0 | 75 | 962 | Post-Tropical Cyclone | 1 |
| 0600 UTC 12 Sep | 57.0 | -29.0 | 75 | 967 | Post-Tropical Cyclone | 1 |
| 1200 UTC 12 Sep | 58.5 | -26.0 | 75 | 970 | Post-Tropical Cyclone | 1 |
| 1800 UTC 12 Sep | 61.0 | -23.0 | 70 | 972 | Post-Tropical Cyclone | - |
| 0000 UTC 13 Sep | 62.0 | -21.0 | 65 | 974 | Post-Tropical Cyclone | - |
| 0600 UTC 13 Sep | 62.9 | -19.0 | 60 | 976 | Post-Tropical Cyclone | - |
| 1200 UTC 13 Sep | 63.5 | -16.0 | 50 | 980 | Post-Tropical Cyclone | - |
| 1800 UTC 13 Sep | 63.0 | -10.0 | 50 | 983 | Post-Tropical Cyclone | - |
| 0000 UTC 14 Sep | 63.0 | -0.0 | 50 | 984 | Post-Tropical Cyclone | - |
Summary Plot
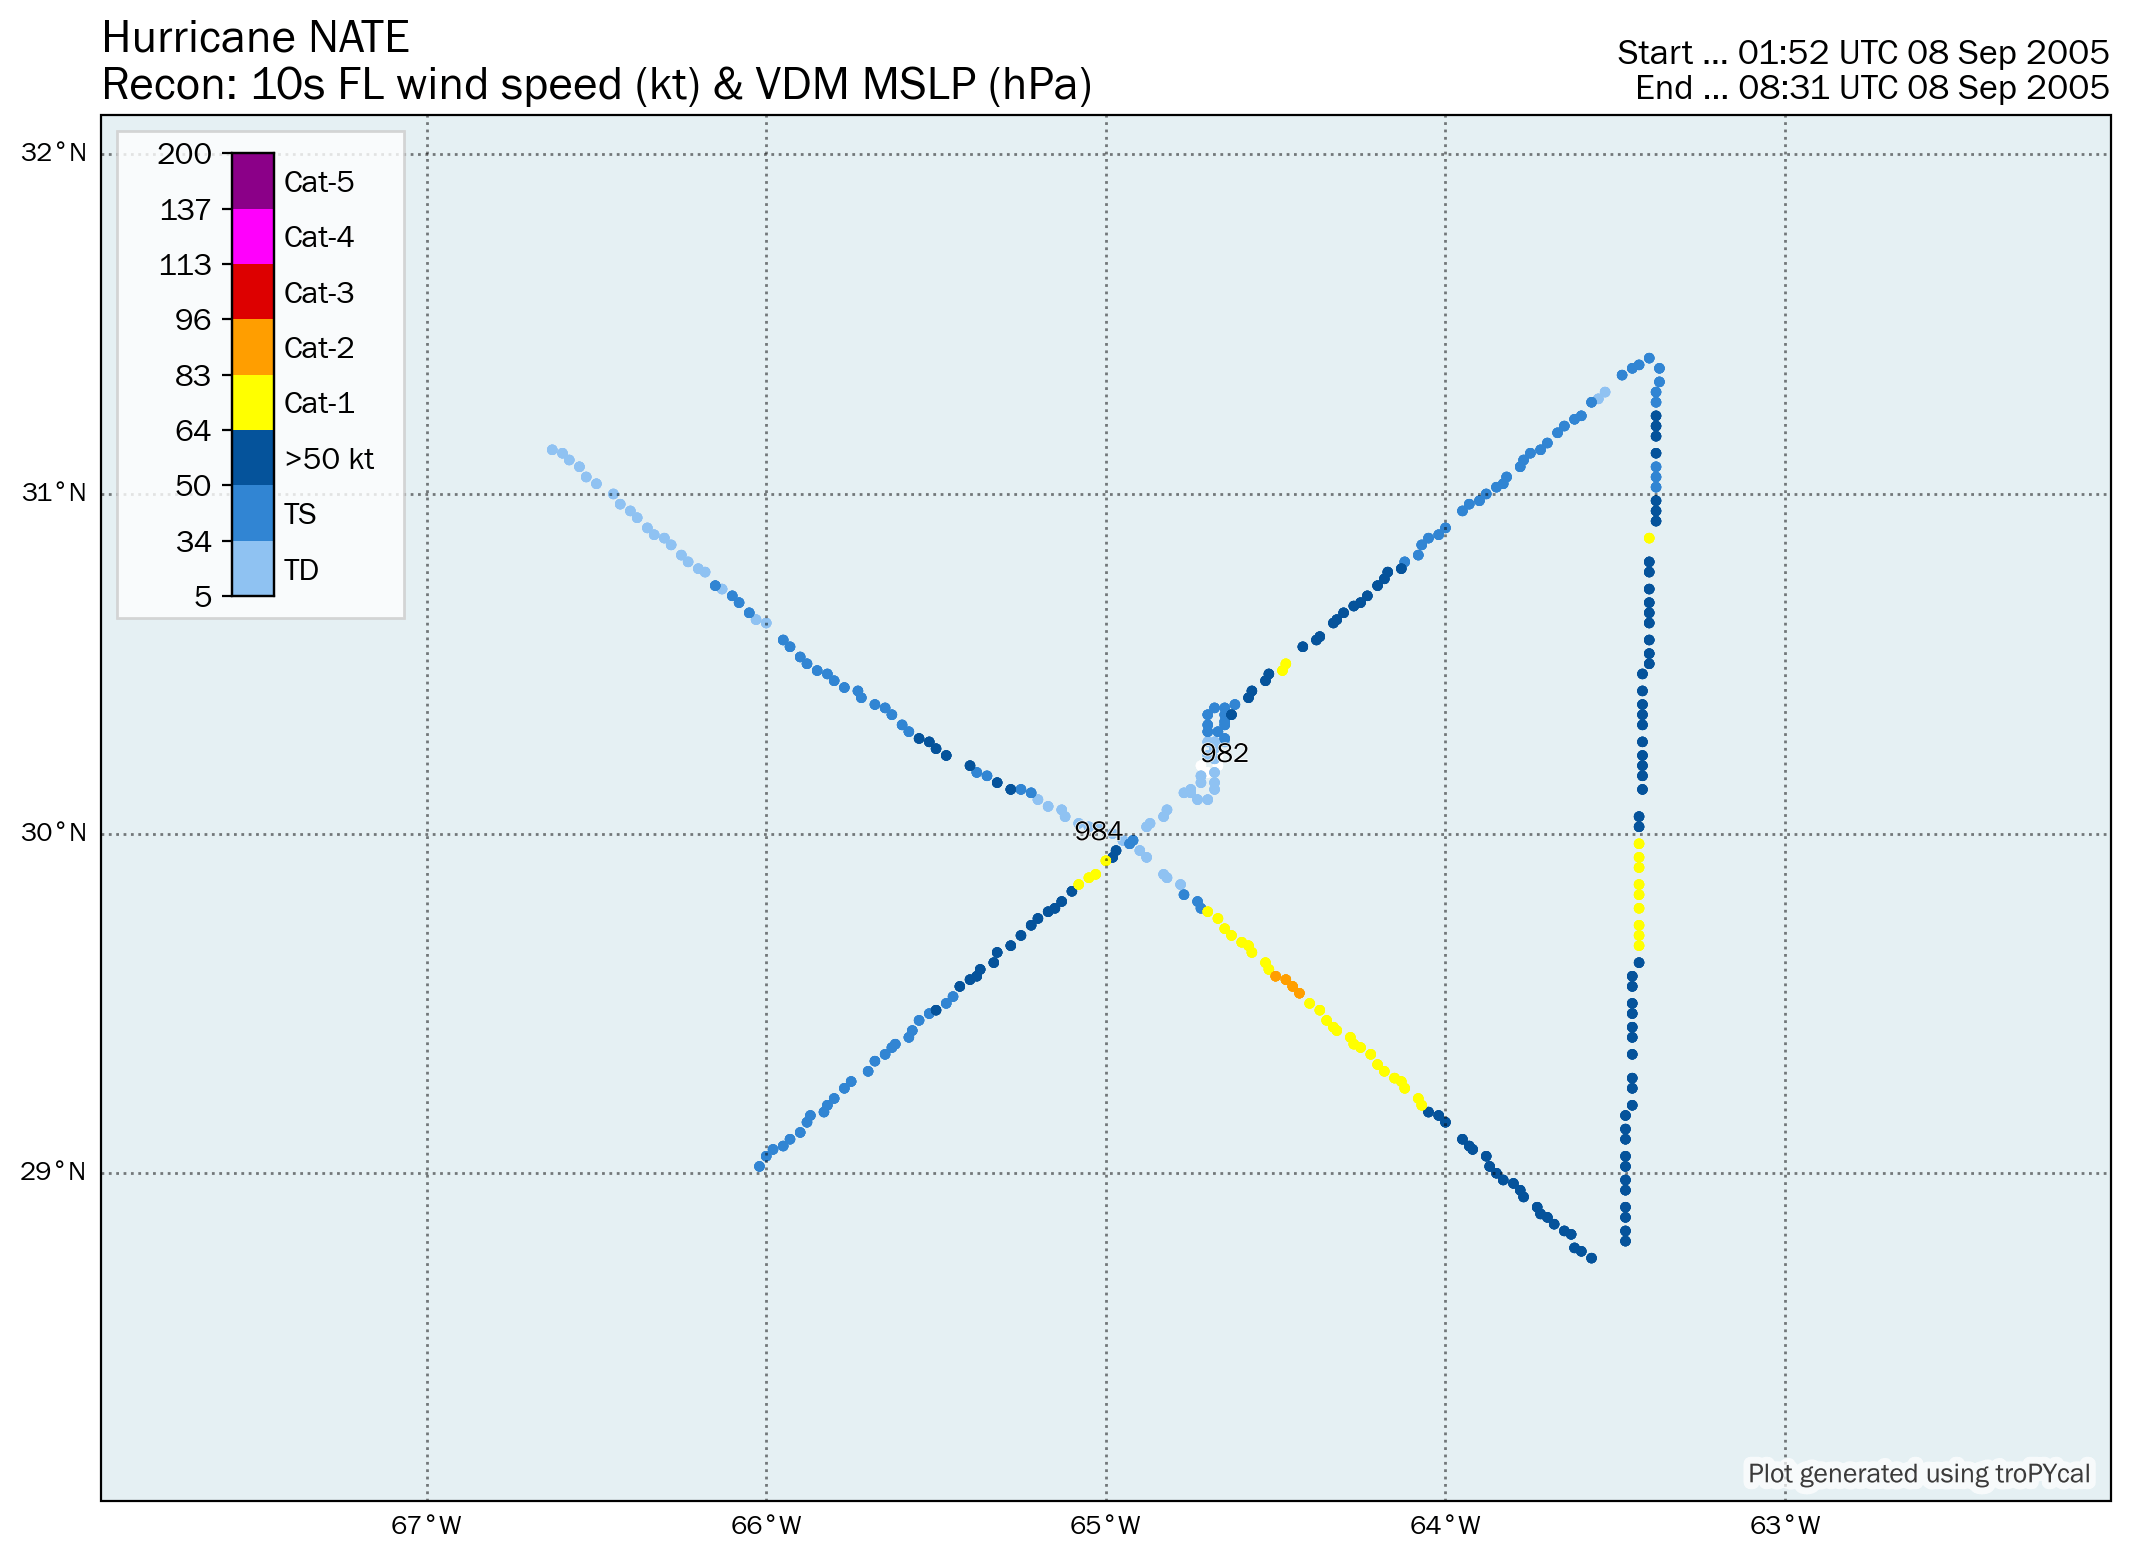
Recon-Derived Wind Swath
| Time (UTC) | Lat | Lon | Wind (mph) | Pressure | Storm Type | Category |
|---|---|---|---|---|---|---|
| 1800 UTC 05 Sep | 28.4 | -67.0 | 35 | 1008 | Tropical Depression | - |
| 0000 UTC 06 Sep | 28.4 | -66.6 | 40 | 1005 | Tropical Storm | - |
| 0600 UTC 06 Sep | 28.5 | -66.5 | 45 | 1002 | Tropical Storm | - |
| 1200 UTC 06 Sep | 28.5 | -66.5 | 60 | 1000 | Tropical Storm | - |
| 1800 UTC 06 Sep | 28.6 | -66.4 | 60 | 997 | Tropical Storm | - |
| 0000 UTC 07 Sep | 28.7 | -66.3 | 65 | 994 | Tropical Storm | - |
| 0600 UTC 07 Sep | 28.7 | -66.3 | 70 | 990 | Tropical Storm | - |
| 1200 UTC 07 Sep | 28.9 | -66.2 | 75 | 987 | Hurricane | 1 |
| 1800 UTC 07 Sep | 29.3 | -66.0 | 80 | 985 | Hurricane | 1 |
| 0000 UTC 08 Sep | 29.6 | -65.7 | 85 | 984 | Hurricane | 1 |
| 0600 UTC 08 Sep | 30.0 | -65.0 | 85 | 982 | Hurricane | 1 |
| 1200 UTC 08 Sep | 30.5 | -63.8 | 85 | 982 | Hurricane | 1 |
| 1800 UTC 08 Sep | 31.4 | -62.7 | 85 | 982 | Hurricane | 1 |
| 0000 UTC 09 Sep | 32.6 | -61.1 | 90 | 979 | Hurricane | 1 |
| 0600 UTC 09 Sep | 33.4 | -59.1 | 80 | 985 | Hurricane | 1 |
| 1200 UTC 09 Sep | 34.0 | -55.8 | 75 | 986 | Hurricane | 1 |
| 1800 UTC 09 Sep | 34.5 | -53.4 | 65 | 991 | Tropical Storm | - |
| 0000 UTC 10 Sep | 34.7 | -50.8 | 65 | 997 | Tropical Storm | - |
| 0600 UTC 10 Sep | 34.6 | -49.0 | 50 | 997 | Tropical Storm | - |
| 1200 UTC 10 Sep | 34.5 | -45.9 | 50 | 997 | Tropical Storm | - |
| 1800 UTC 10 Sep | 34.9 | -44.1 | 50 | 997 | Post-Tropical Cyclone | - |
| 0000 UTC 11 Sep | 35.2 | -42.1 | 45 | 999 | Post-Tropical Cyclone | - |
| 0600 UTC 11 Sep | 36.0 | -40.6 | 45 | 1000 | Post-Tropical Cyclone | - |
| 1200 UTC 11 Sep | 37.4 | -38.3 | 45 | 1001 | Post-Tropical Cyclone | - |
| 1800 UTC 11 Sep | 39.2 | -35.6 | 45 | 1001 | Post-Tropical Cyclone | - |
| 0000 UTC 12 Sep | 41.6 | -33.3 | 45 | 1002 | Post-Tropical Cyclone | - |
| 0600 UTC 12 Sep | 43.5 | -32.0 | 40 | 1002 | Post-Tropical Cyclone | - |
| 1200 UTC 12 Sep | 44.0 | -28.1 | 40 | 1003 | Post-Tropical Cyclone | - |
| 1800 UTC 12 Sep | 46.0 | -25.0 | 40 | 1003 | Post-Tropical Cyclone | - |
Summary Map
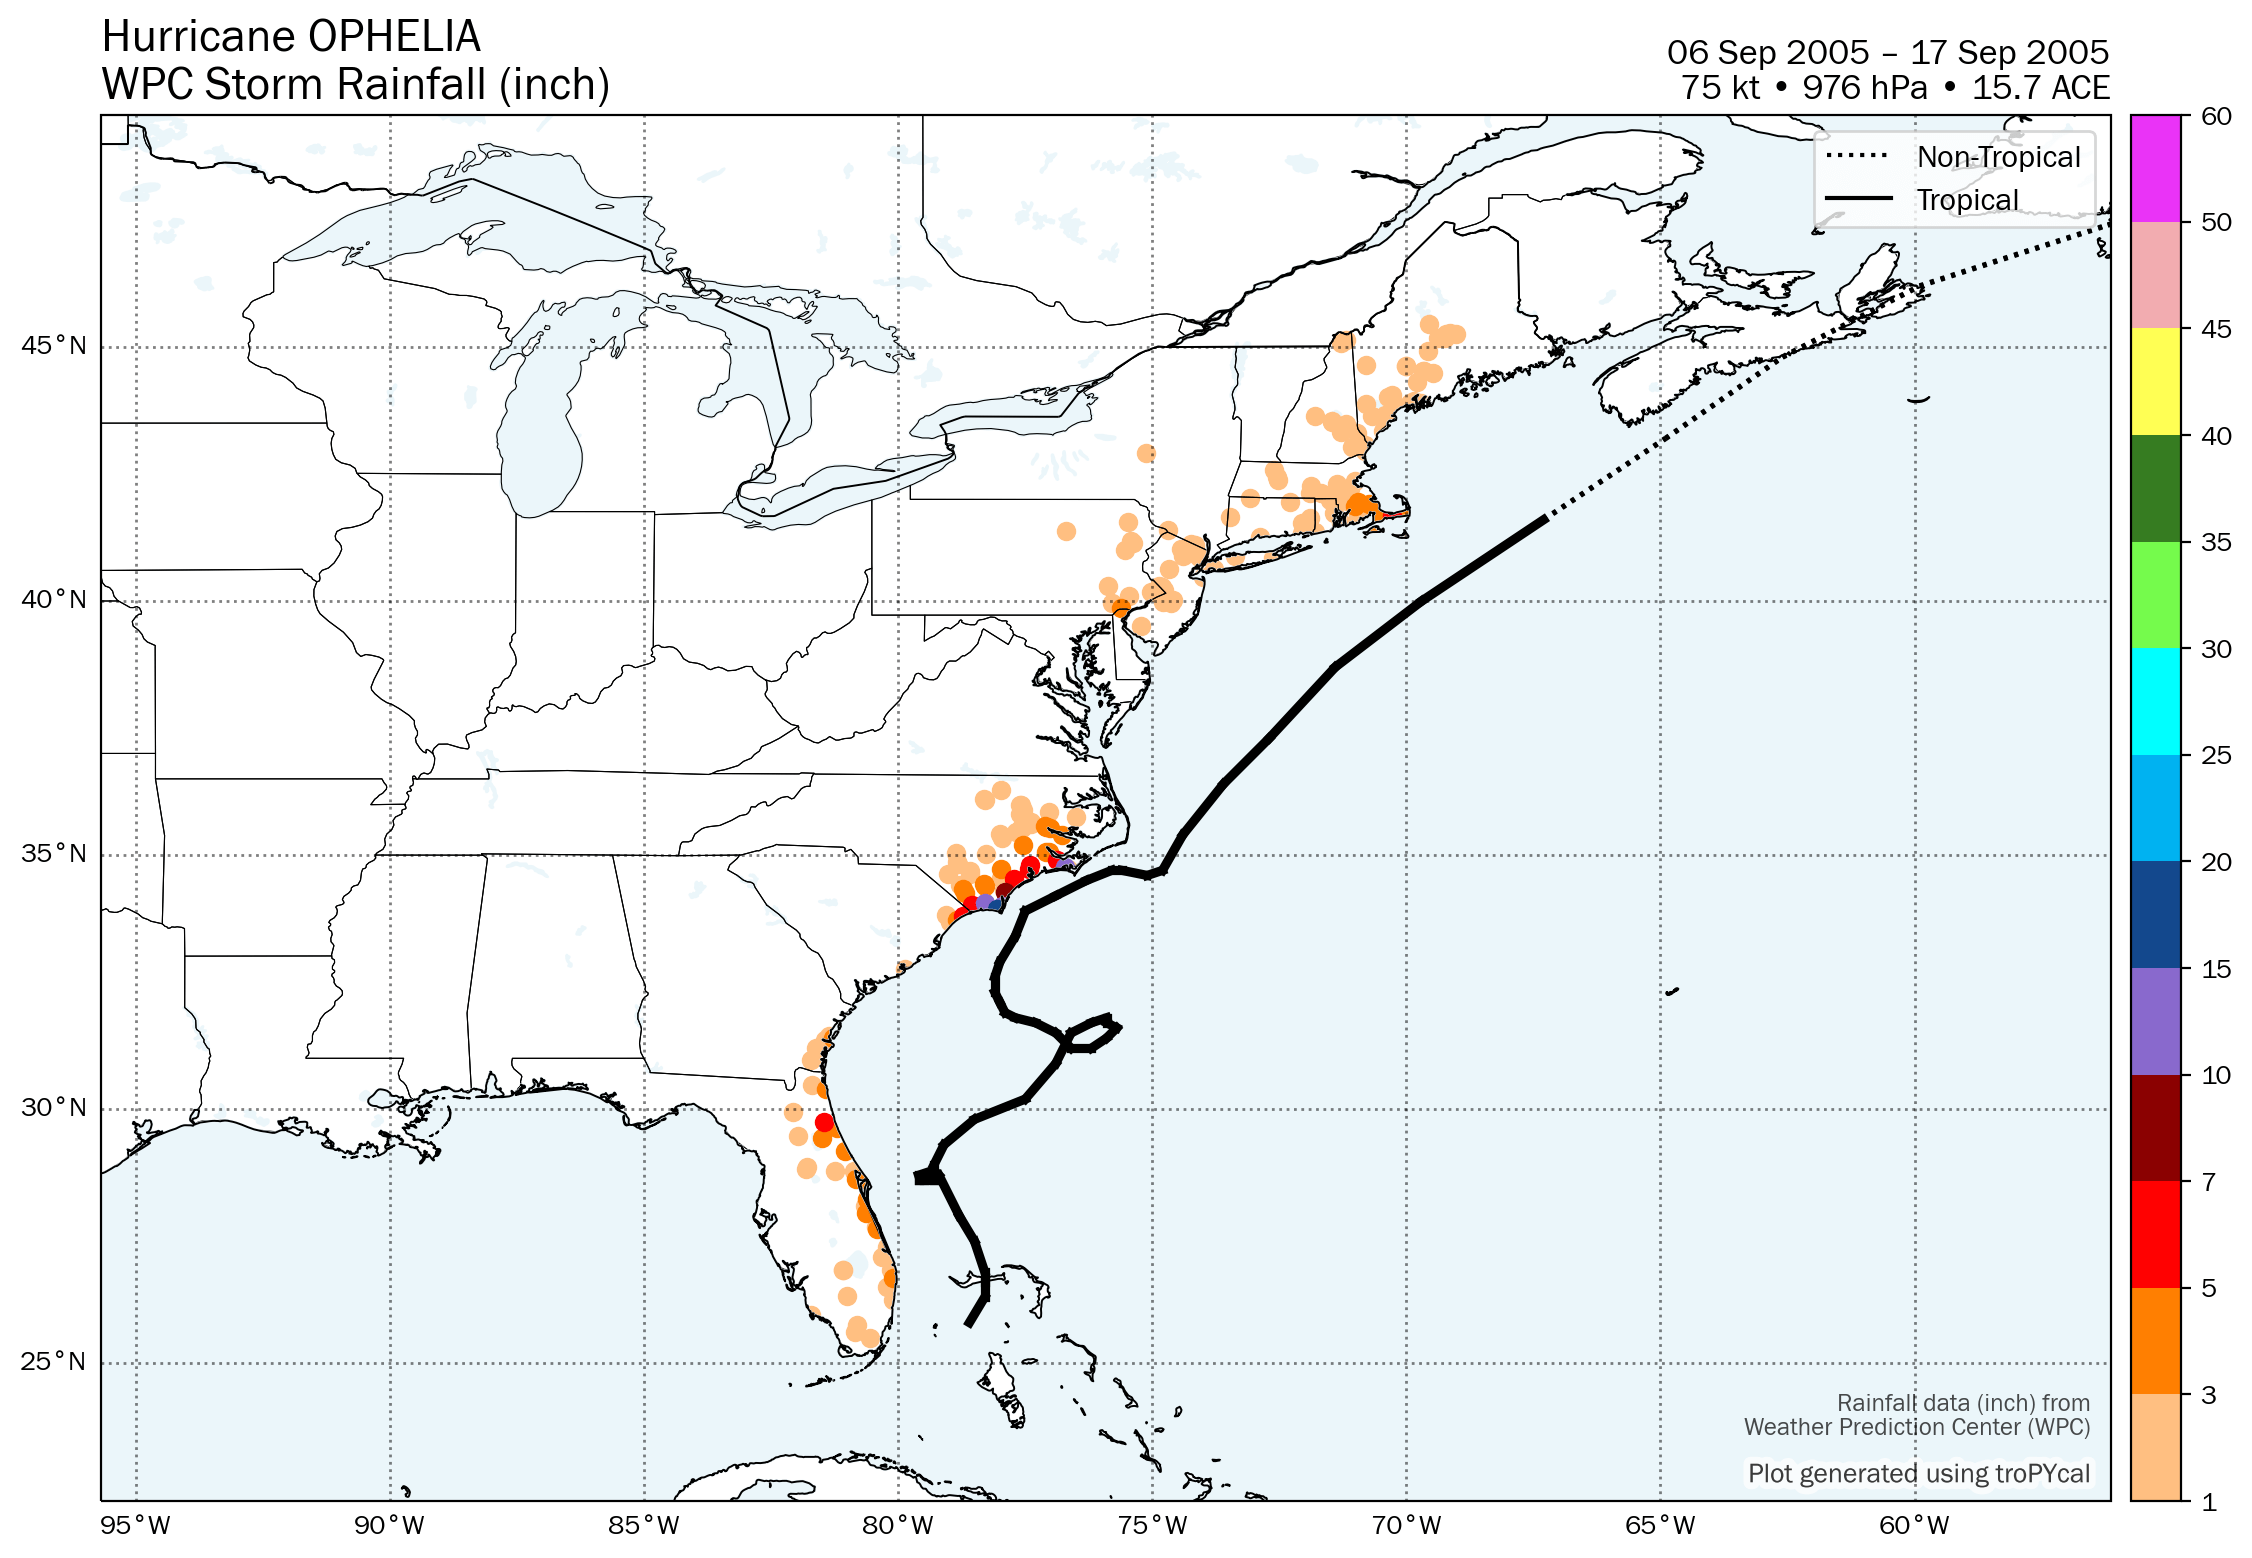
Gridded Rainfall
Summary Plot
Recon-Derived Hovmoller
Recon-Derived Wind Swath
| Time (UTC) | Lat | Lon | Wind (mph) | Pressure | Storm Type | Category |
|---|---|---|---|---|---|---|
| 0600 UTC 06 Sep | 25.8 | -78.6 | 30 | 1009 | Tropical Depression | - |
| 1200 UTC 06 Sep | 26.3 | -78.3 | 30 | 1010 | Tropical Depression | - |
| 1600 UTC 06 Sep | 26.6 | -78.3 | 30 | 1010 | Tropical Depression | - |
| 1800 UTC 06 Sep | 26.8 | -78.3 | 30 | 1010 | Tropical Depression | - |
| 0000 UTC 07 Sep | 27.4 | -78.5 | 35 | 1006 | Tropical Depression | - |
| 0600 UTC 07 Sep | 27.9 | -78.8 | 40 | 1003 | Tropical Storm | - |
| 1200 UTC 07 Sep | 28.7 | -79.2 | 45 | 1000 | Tropical Storm | - |
| 1800 UTC 07 Sep | 28.8 | -79.3 | 50 | 997 | Tropical Storm | - |
| 0000 UTC 08 Sep | 28.8 | -79.3 | 50 | 994 | Tropical Storm | - |
| 0600 UTC 08 Sep | 28.7 | -79.6 | 60 | 994 | Tropical Storm | - |
| 1200 UTC 08 Sep | 28.6 | -79.6 | 65 | 988 | Tropical Storm | - |
| 1800 UTC 08 Sep | 28.6 | -79.5 | 70 | 988 | Tropical Storm | - |
| 0000 UTC 09 Sep | 28.6 | -79.3 | 75 | 990 | Hurricane | 1 |
| 0600 UTC 09 Sep | 28.9 | -79.3 | 65 | 990 | Tropical Storm | - |
| 1200 UTC 09 Sep | 29.3 | -79.1 | 65 | 983 | Tropical Storm | - |
| 1800 UTC 09 Sep | 29.8 | -78.5 | 75 | 983 | Hurricane | 1 |
| 0000 UTC 10 Sep | 30.2 | -77.5 | 70 | 983 | Tropical Storm | - |
| 0600 UTC 10 Sep | 30.9 | -76.9 | 70 | 984 | Tropical Storm | - |
| 1200 UTC 10 Sep | 31.5 | -76.6 | 75 | 976 | Hurricane | 1 |
| 1800 UTC 10 Sep | 31.7 | -76.2 | 80 | 977 | Hurricane | 1 |
| 0000 UTC 11 Sep | 31.8 | -75.9 | 80 | 977 | Hurricane | 1 |
| 0600 UTC 11 Sep | 31.7 | -75.9 | 85 | 978 | Hurricane | 1 |
| 1200 UTC 11 Sep | 31.6 | -75.7 | 80 | 978 | Hurricane | 1 |
| 1800 UTC 11 Sep | 31.4 | -75.9 | 75 | 978 | Hurricane | 1 |
| 0000 UTC 12 Sep | 31.2 | -76.2 | 70 | 980 | Tropical Storm | - |
| 0600 UTC 12 Sep | 31.2 | -76.6 | 70 | 985 | Tropical Storm | - |
| 1200 UTC 12 Sep | 31.5 | -76.9 | 65 | 988 | Tropical Storm | - |
| 1800 UTC 12 Sep | 31.7 | -77.3 | 70 | 989 | Tropical Storm | - |
| 0000 UTC 13 Sep | 31.8 | -77.7 | 70 | 989 | Tropical Storm | - |
| 0600 UTC 13 Sep | 31.9 | -77.9 | 70 | 990 | Tropical Storm | - |
| 1200 UTC 13 Sep | 32.1 | -78.0 | 70 | 989 | Tropical Storm | - |
| 1800 UTC 13 Sep | 32.3 | -78.1 | 70 | 988 | Tropical Storm | - |
| 0000 UTC 14 Sep | 32.6 | -78.1 | 75 | 985 | Hurricane | 1 |
| 0600 UTC 14 Sep | 32.9 | -78.0 | 80 | 980 | Hurricane | 1 |
| 1200 UTC 14 Sep | 33.4 | -77.7 | 85 | 980 | Hurricane | 1 |
| 1800 UTC 14 Sep | 33.9 | -77.5 | 85 | 979 | Hurricane | 1 |
| 0000 UTC 15 Sep | 34.2 | -76.9 | 85 | 979 | Hurricane | 1 |
| 0600 UTC 15 Sep | 34.5 | -76.3 | 80 | 982 | Hurricane | 1 |
| 1200 UTC 15 Sep | 34.7 | -75.8 | 75 | 984 | Hurricane | 1 |
| 1800 UTC 15 Sep | 34.7 | -75.6 | 75 | 986 | Hurricane | 1 |
| 0000 UTC 16 Sep | 34.6 | -75.1 | 70 | 987 | Tropical Storm | - |
| 0600 UTC 16 Sep | 34.7 | -74.8 | 65 | 993 | Tropical Storm | - |
| 1200 UTC 16 Sep | 35.4 | -74.4 | 60 | 995 | Tropical Storm | - |
| 1800 UTC 16 Sep | 36.4 | -73.6 | 65 | 993 | Tropical Storm | - |
| 0000 UTC 17 Sep | 37.3 | -72.7 | 65 | 995 | Tropical Storm | - |
| 0600 UTC 17 Sep | 38.7 | -71.4 | 60 | 1000 | Tropical Storm | - |
| 1200 UTC 17 Sep | 40.0 | -69.7 | 60 | 997 | Tropical Storm | - |
| 1800 UTC 17 Sep | 41.6 | -67.3 | 60 | 995 | Tropical Storm | - |
| 0000 UTC 18 Sep | 43.2 | -64.9 | 50 | 996 | Post-Tropical Cyclone | - |
| 0600 UTC 18 Sep | 44.8 | -62.6 | 50 | 1000 | Post-Tropical Cyclone | - |
| 1200 UTC 18 Sep | 46.2 | -59.9 | 50 | 1000 | Post-Tropical Cyclone | - |
| 1800 UTC 18 Sep | 47.4 | -56.2 | 50 | 999 | Post-Tropical Cyclone | - |
| 0000 UTC 19 Sep | 48.4 | -52.3 | 50 | 1000 | Post-Tropical Cyclone | - |
| 0600 UTC 19 Sep | 49.0 | -48.8 | 50 | 1001 | Post-Tropical Cyclone | - |
| 1200 UTC 19 Sep | 49.5 | -45.7 | 50 | 1000 | Post-Tropical Cyclone | - |
| 1800 UTC 19 Sep | 50.0 | -42.1 | 50 | 999 | Post-Tropical Cyclone | - |
| 0000 UTC 20 Sep | 50.9 | -38.5 | 50 | 998 | Post-Tropical Cyclone | - |
| 0600 UTC 20 Sep | 51.5 | -34.7 | 45 | 1000 | Post-Tropical Cyclone | - |
| 1200 UTC 20 Sep | 52.2 | -30.5 | 45 | 1003 | Post-Tropical Cyclone | - |
| 1800 UTC 20 Sep | 52.8 | -26.5 | 45 | 1001 | Post-Tropical Cyclone | - |
| 0000 UTC 21 Sep | 53.8 | -22.0 | 45 | 998 | Post-Tropical Cyclone | - |
| 0600 UTC 21 Sep | 55.3 | -17.7 | 40 | 998 | Post-Tropical Cyclone | - |
| 1200 UTC 21 Sep | 57.6 | -14.6 | 40 | 998 | Post-Tropical Cyclone | - |
| 1800 UTC 21 Sep | 59.8 | -11.9 | 40 | 996 | Post-Tropical Cyclone | - |
| 0000 UTC 22 Sep | 61.7 | -8.4 | 40 | 993 | Post-Tropical Cyclone | - |
| 0600 UTC 22 Sep | 63.6 | -4.5 | 40 | 993 | Post-Tropical Cyclone | - |
| 1200 UTC 22 Sep | 65.6 | -1.0 | 40 | 994 | Post-Tropical Cyclone | - |
| 1800 UTC 22 Sep | 67.5 | 1.9 | 35 | 995 | Post-Tropical Cyclone | - |
| 0000 UTC 23 Sep | 68.8 | 6.6 | 35 | 997 | Post-Tropical Cyclone | - |
Summary Plot
Recon-Derived Wind Swath
| Time (UTC) | Lat | Lon | Wind (mph) | Pressure | Storm Type | Category |
|---|---|---|---|---|---|---|
| 1200 UTC 17 Sep | 13.3 | -54.5 | 35 | 1008 | Tropical Depression | - |
| 1800 UTC 17 Sep | 13.5 | -54.9 | 40 | 1007 | Tropical Storm | - |
| 0000 UTC 18 Sep | 13.9 | -55.1 | 45 | 1003 | Tropical Storm | - |
| 0600 UTC 18 Sep | 14.4 | -55.3 | 50 | 1000 | Tropical Storm | - |
| 1200 UTC 18 Sep | 14.9 | -55.5 | 60 | 996 | Tropical Storm | - |
| 1800 UTC 18 Sep | 15.6 | -55.7 | 65 | 993 | Tropical Storm | - |
| 0000 UTC 19 Sep | 16.2 | -55.8 | 75 | 987 | Hurricane | 1 |
| 0600 UTC 19 Sep | 16.7 | -55.9 | 75 | 987 | Hurricane | 1 |
| 1200 UTC 19 Sep | 17.2 | -56.2 | 75 | 987 | Hurricane | 1 |
| 1800 UTC 19 Sep | 17.5 | -56.4 | 75 | 987 | Hurricane | 1 |
| 0000 UTC 20 Sep | 17.7 | -56.6 | 80 | 985 | Hurricane | 1 |
| 0600 UTC 20 Sep | 17.9 | -56.8 | 75 | 987 | Hurricane | 1 |
| 1200 UTC 20 Sep | 18.1 | -57.0 | 70 | 990 | Tropical Storm | - |
| 1800 UTC 20 Sep | 18.5 | -57.2 | 65 | 992 | Tropical Storm | - |
| 0000 UTC 21 Sep | 18.9 | -57.2 | 65 | 994 | Tropical Storm | - |
| 0600 UTC 21 Sep | 19.4 | -57.1 | 60 | 997 | Tropical Storm | - |
| 1200 UTC 21 Sep | 19.9 | -57.0 | 50 | 1000 | Tropical Storm | - |
| 1800 UTC 21 Sep | 20.8 | -56.9 | 45 | 1001 | Tropical Storm | - |
| 0000 UTC 22 Sep | 22.4 | -56.7 | 40 | 1002 | Tropical Storm | - |
| 0600 UTC 22 Sep | 23.8 | -56.8 | 40 | 1003 | Tropical Storm | - |
| 1200 UTC 22 Sep | 25.2 | -57.2 | 40 | 1003 | Tropical Storm | - |
| 1800 UTC 22 Sep | 26.7 | -57.6 | 40 | 1003 | Tropical Storm | - |
| 0000 UTC 23 Sep | 28.3 | -58.2 | 40 | 1003 | Tropical Storm | - |
| 0600 UTC 23 Sep | 30.2 | -60.1 | 40 | 1003 | Tropical Storm | - |
| 1200 UTC 23 Sep | 30.5 | -62.2 | 35 | 1003 | Tropical Depression | - |
| 1800 UTC 23 Sep | 30.2 | -63.7 | 35 | 1003 | Remnant Low | - |
| 0000 UTC 24 Sep | 29.2 | -63.8 | 35 | 1003 | Remnant Low | - |
| 0600 UTC 24 Sep | 28.6 | -62.8 | 30 | 1004 | Remnant Low | - |
Storm-Relative Tornadoes
Tornado Map
Summary Map
Gridded Rainfall
Summary Plot
Recon-Derived Hovmoller
Recon-Derived Wind Swath
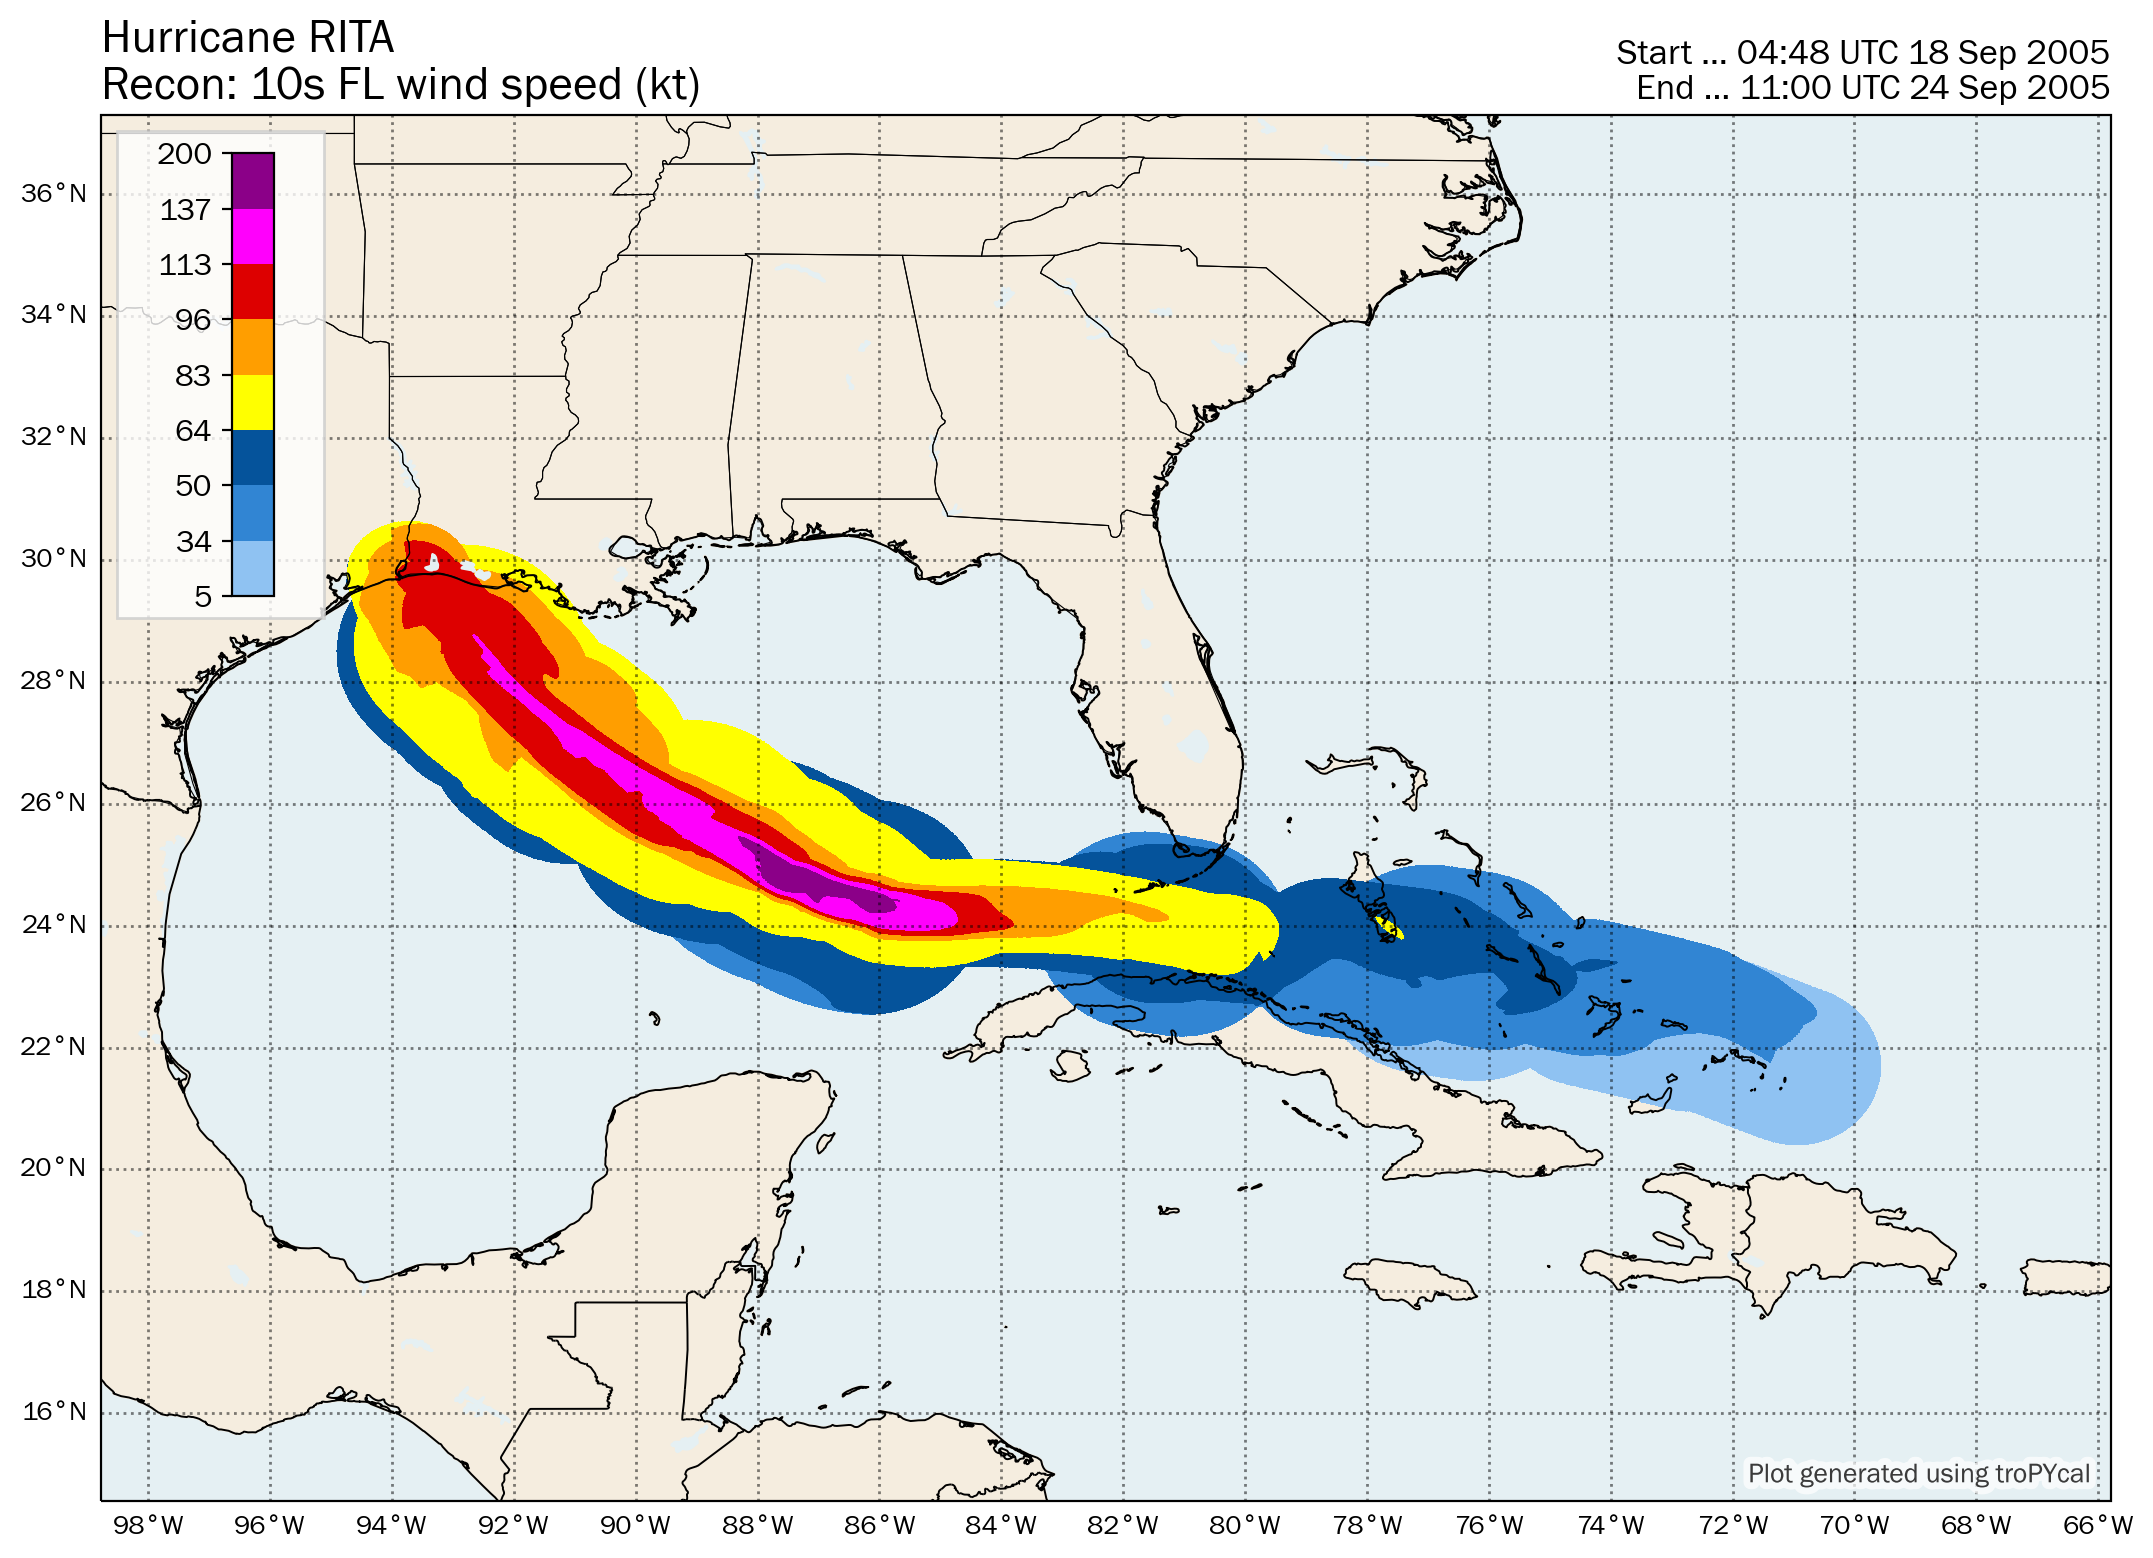
| Time (UTC) | Lat | Lon | Wind (mph) | Pressure | Storm Type | Category |
|---|---|---|---|---|---|---|
| 0000 UTC 18 Sep | 21.3 | -69.9 | 30 | 1009 | Tropical Depression | - |
| 0600 UTC 18 Sep | 21.6 | -70.7 | 30 | 1009 | Tropical Depression | - |
| 1200 UTC 18 Sep | 21.9 | -71.5 | 35 | 1007 | Tropical Depression | - |
| 1800 UTC 18 Sep | 22.2 | -72.3 | 40 | 1005 | Tropical Storm | - |
| 0000 UTC 19 Sep | 22.4 | -73.0 | 50 | 1002 | Tropical Storm | - |
| 0600 UTC 19 Sep | 22.6 | -73.8 | 60 | 999 | Tropical Storm | - |
| 1200 UTC 19 Sep | 22.8 | -74.7 | 65 | 997 | Tropical Storm | - |
| 1800 UTC 19 Sep | 23.1 | -75.9 | 70 | 994 | Tropical Storm | - |
| 0000 UTC 20 Sep | 23.3 | -77.2 | 70 | 992 | Tropical Storm | - |
| 0600 UTC 20 Sep | 23.5 | -78.8 | 70 | 990 | Tropical Storm | - |
| 1200 UTC 20 Sep | 23.7 | -80.3 | 80 | 985 | Hurricane | 1 |
| 1800 UTC 20 Sep | 23.9 | -81.6 | 100 | 975 | Hurricane | 2 |
| 0000 UTC 21 Sep | 24.1 | -82.7 | 110 | 967 | Hurricane | 2 |
| 0600 UTC 21 Sep | 24.2 | -84.0 | 125 | 955 | Hurricane | 3 |
| 1200 UTC 21 Sep | 24.2 | -85.2 | 140 | 941 | Hurricane | 4 |
| 1800 UTC 21 Sep | 24.3 | -86.2 | 165 | 920 | Hurricane | 5 |
| 0000 UTC 22 Sep | 24.5 | -86.9 | 175 | 897 | Hurricane | 5 |
| 0300 UTC 22 Sep | 24.7 | -87.3 | 180 | 895 | Hurricane | 5 |
| 0600 UTC 22 Sep | 24.8 | -87.6 | 180 | 897 | Hurricane | 5 |
| 1200 UTC 22 Sep | 25.2 | -88.3 | 160 | 908 | Hurricane | 5 |
| 1800 UTC 22 Sep | 25.6 | -89.1 | 145 | 913 | Hurricane | 4 |
| 0000 UTC 23 Sep | 26.0 | -89.9 | 140 | 915 | Hurricane | 4 |
| 0600 UTC 23 Sep | 26.5 | -90.7 | 130 | 924 | Hurricane | 4 |
| 1200 UTC 23 Sep | 27.1 | -91.5 | 130 | 927 | Hurricane | 4 |
| 1800 UTC 23 Sep | 27.8 | -92.3 | 125 | 930 | Hurricane | 3 |
| 0000 UTC 24 Sep | 28.6 | -93.0 | 120 | 931 | Hurricane | 3 |
| 0600 UTC 24 Sep | 29.4 | -93.6 | 115 | 935 | Hurricane | 3 |
| 0740 UTC 24 Sep | 29.7 | -93.7 | 115 | 937 | Hurricane | 3 |
| 1200 UTC 24 Sep | 30.5 | -94.1 | 75 | 949 | Hurricane | 1 |
| 1800 UTC 24 Sep | 31.6 | -94.1 | 50 | 974 | Tropical Storm | - |
| 0000 UTC 25 Sep | 32.7 | -94.0 | 40 | 982 | Tropical Storm | - |
| 0600 UTC 25 Sep | 33.7 | -93.6 | 35 | 989 | Tropical Depression | - |
| 1200 UTC 25 Sep | 34.7 | -92.5 | 30 | 995 | Tropical Depression | - |
| 1800 UTC 25 Sep | 35.8 | -91.4 | 30 | 1000 | Tropical Depression | - |
| 0000 UTC 26 Sep | 37.0 | -90.1 | 25 | 1003 | Tropical Depression | - |
| 0600 UTC 26 Sep | 39.5 | -88.0 | 25 | 1006 | Remnant Low | - |
| Time (UTC) | Lat | Lon | Wind (mph) | Pressure | Storm Type | Category |
|---|---|---|---|---|---|---|
| 1200 UTC 30 Sep | 11.8 | -32.7 | 30 | 1009 | Tropical Depression | - |
| 1800 UTC 30 Sep | 12.2 | -33.0 | 35 | 1007 | Tropical Depression | - |
| 0000 UTC 01 Oct | 12.7 | -33.3 | 35 | 1006 | Tropical Depression | - |
| 0600 UTC 01 Oct | 13.3 | -33.5 | 35 | 1008 | Tropical Depression | - |
| 1200 UTC 01 Oct | 13.8 | -33.7 | 35 | 1008 | Tropical Depression | - |
| 1800 UTC 01 Oct | 14.4 | -33.9 | 35 | 1008 | Tropical Depression | - |
| 0000 UTC 02 Oct | 15.0 | -33.8 | 35 | 1008 | Tropical Depression | - |
| 0600 UTC 02 Oct | 15.7 | -34.3 | 30 | 1008 | Tropical Depression | - |
| 1200 UTC 02 Oct | 16.6 | -35.3 | 30 | 1009 | Tropical Depression | - |
Summary Plot
Recon-Derived Hovmoller
Recon-Derived Wind Swath
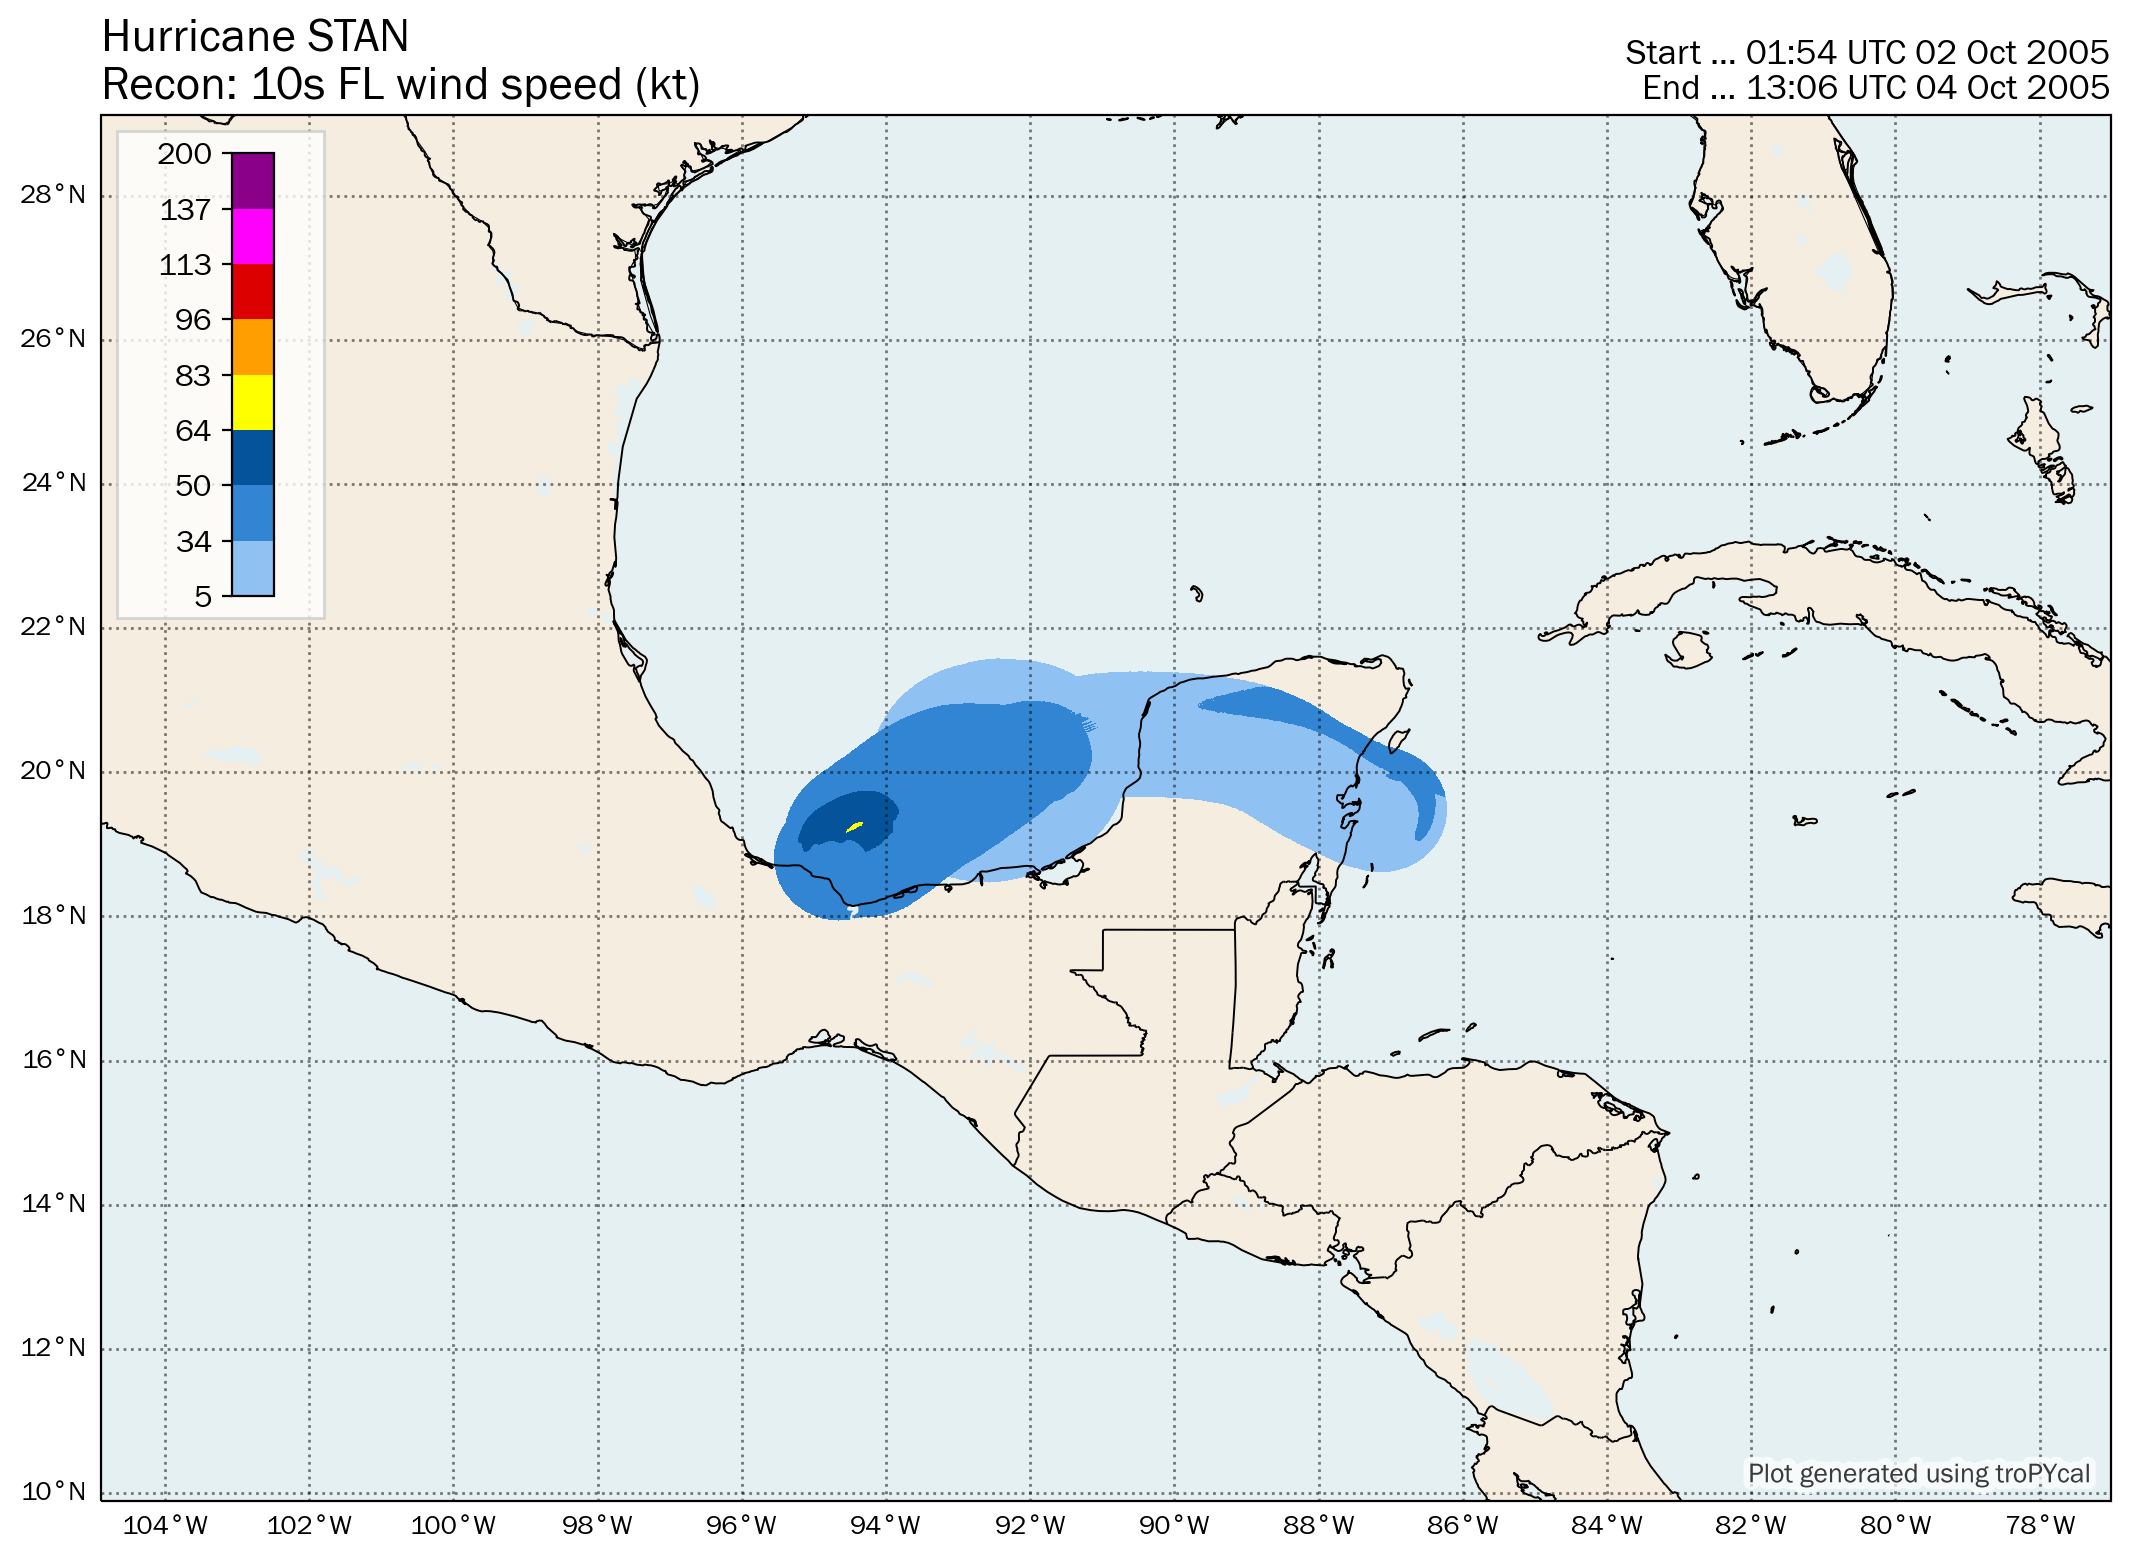
| Time (UTC) | Lat | Lon | Wind (mph) | Pressure | Storm Type | Category |
|---|---|---|---|---|---|---|
| 1200 UTC 01 Oct | 18.9 | -85.6 | 30 | 1007 | Tropical Depression | - |
| 1800 UTC 01 Oct | 19.1 | -86.2 | 35 | 1005 | Tropical Depression | - |
| 0000 UTC 02 Oct | 19.3 | -86.7 | 35 | 1004 | Tropical Depression | - |
| 0600 UTC 02 Oct | 19.5 | -87.2 | 45 | 1003 | Tropical Storm | - |
| 1000 UTC 02 Oct | 19.6 | -87.5 | 40 | 1003 | Tropical Storm | - |
| 1200 UTC 02 Oct | 19.8 | -87.9 | 40 | 1003 | Tropical Storm | - |
| 1800 UTC 02 Oct | 20.3 | -88.8 | 40 | 1004 | Tropical Storm | - |
| 0000 UTC 03 Oct | 20.5 | -89.8 | 35 | 1003 | Tropical Depression | - |
| 0600 UTC 03 Oct | 20.5 | -91.0 | 40 | 1003 | Tropical Storm | - |
| 1200 UTC 03 Oct | 20.3 | -91.7 | 45 | 1000 | Tropical Storm | - |
| 1800 UTC 03 Oct | 20.1 | -92.2 | 60 | 997 | Tropical Storm | - |
| 0000 UTC 04 Oct | 19.8 | -93.2 | 65 | 990 | Tropical Storm | - |
| 0600 UTC 04 Oct | 19.2 | -94.1 | 75 | 987 | Hurricane | 1 |
| 1200 UTC 04 Oct | 18.6 | -94.9 | 80 | 977 | Hurricane | 1 |
| 1800 UTC 04 Oct | 17.9 | -95.6 | 50 | 988 | Tropical Storm | - |
| 0000 UTC 05 Oct | 17.2 | -96.4 | 35 | 1000 | Tropical Depression | - |
| 0600 UTC 05 Oct | 16.9 | -97.0 | 30 | 1004 | Tropical Depression | - |
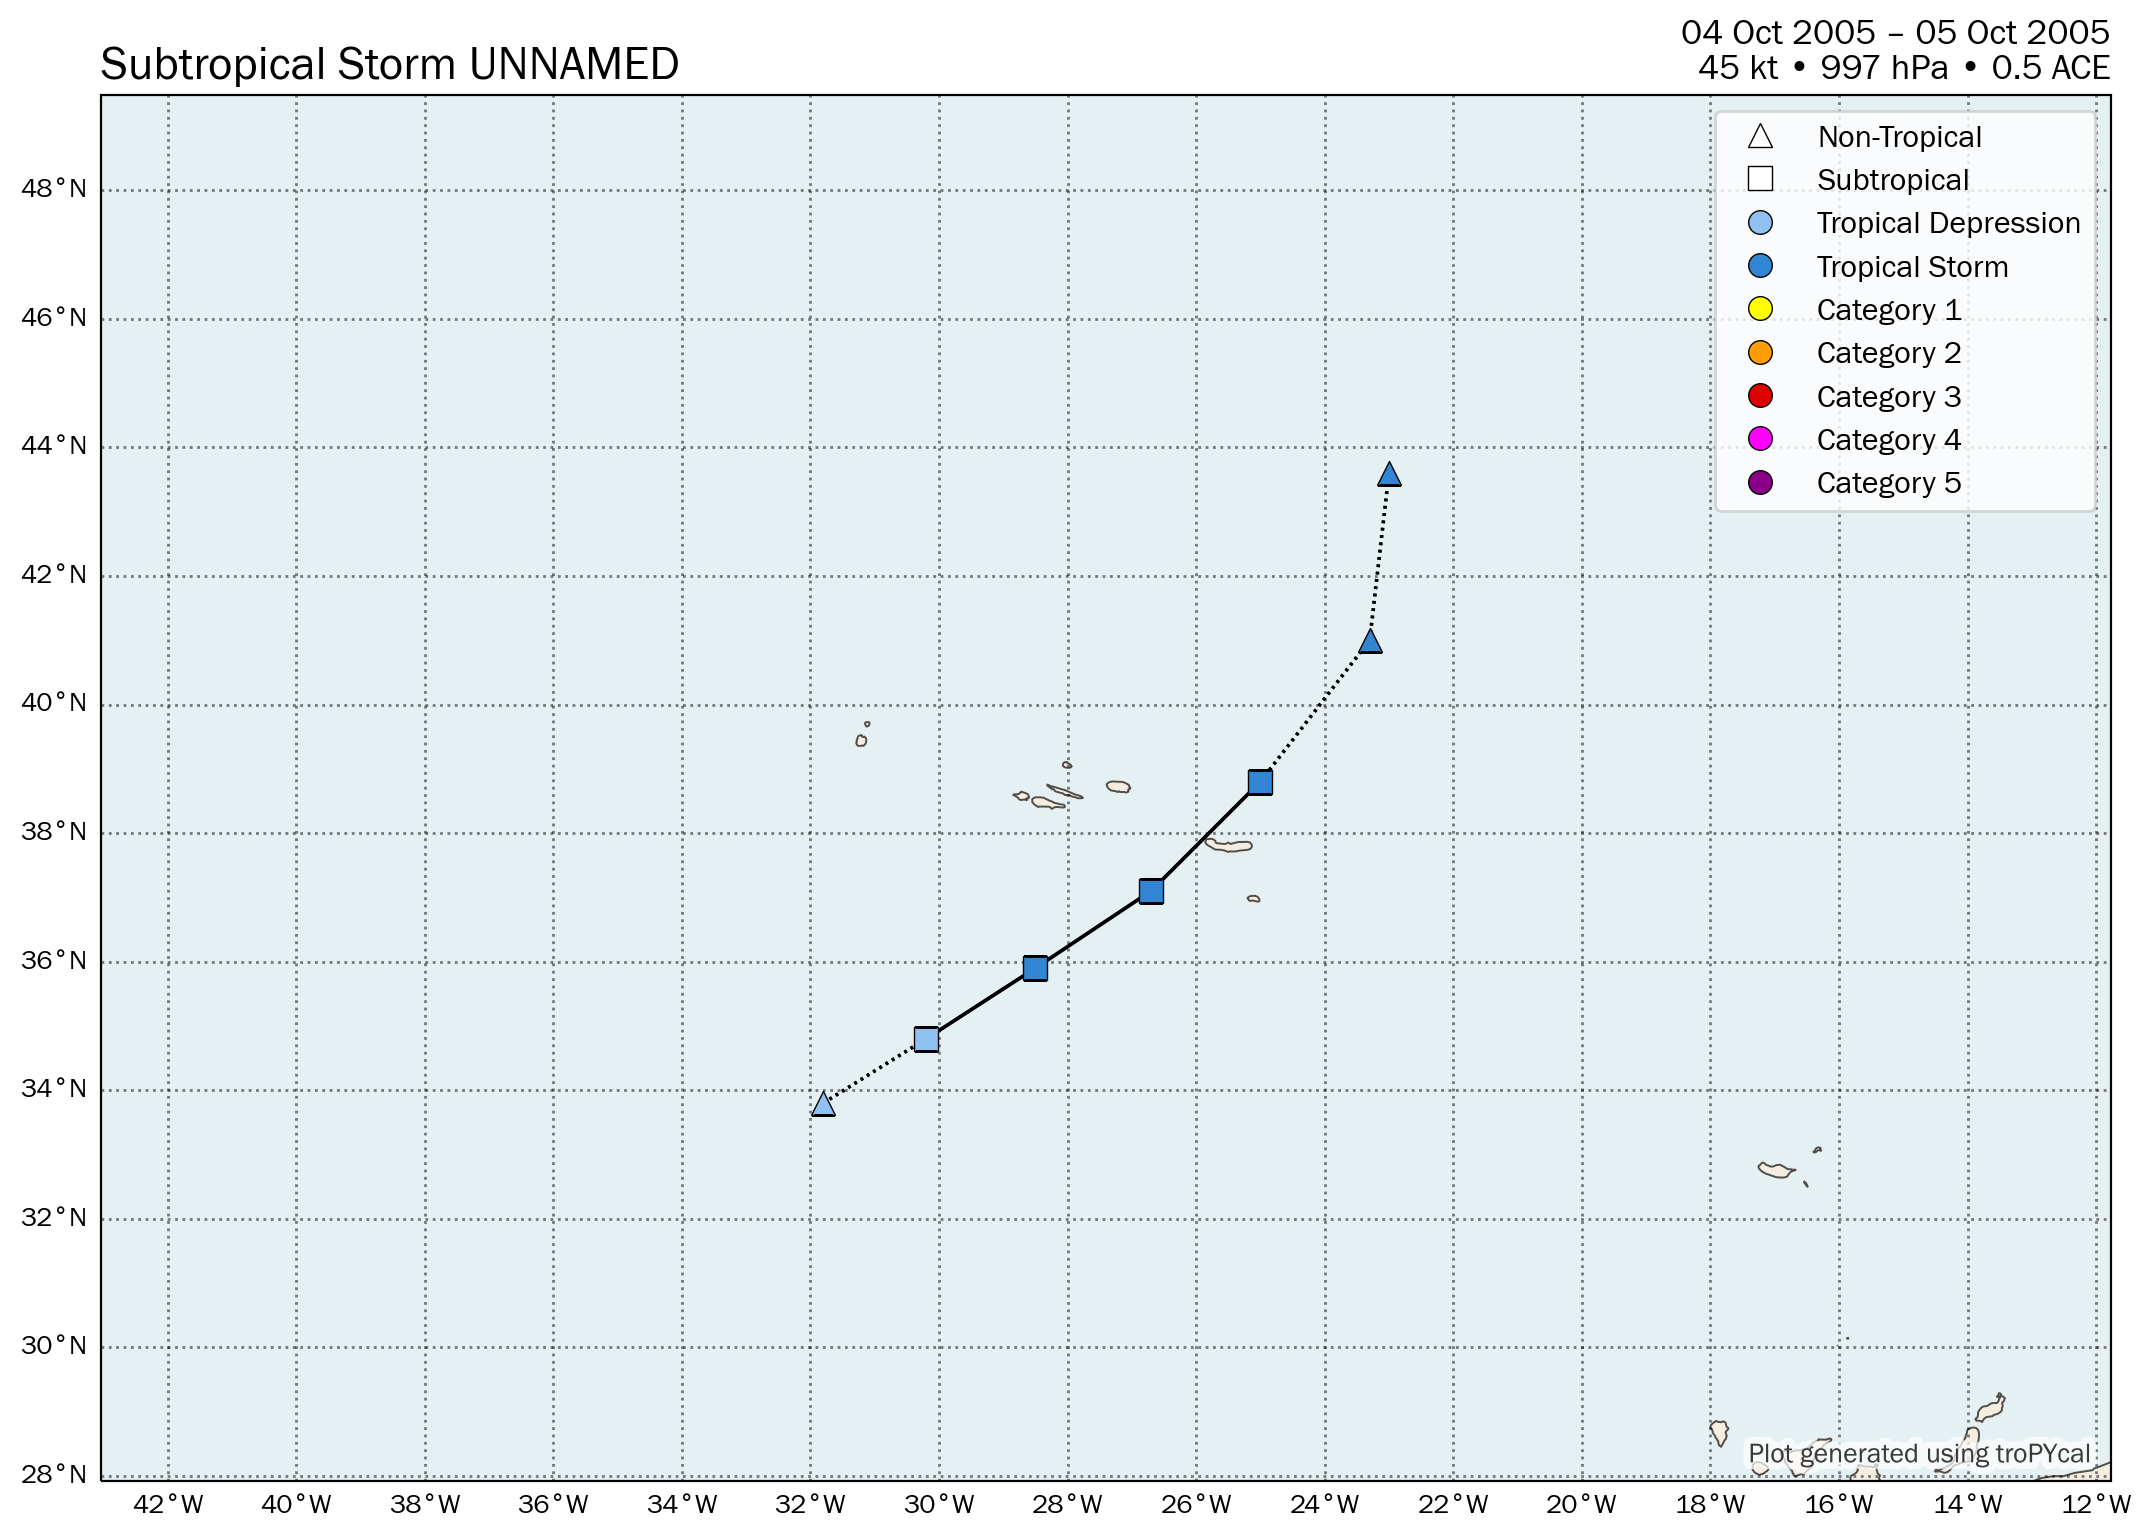
| Time (UTC) | Lat | Lon | Wind (mph) | Pressure | Storm Type | Category |
|---|---|---|---|---|---|---|
| 0000 UTC 04 Oct | 33.8 | -31.8 | 35 | 1012 | Disturbance | - |
| 0600 UTC 04 Oct | 34.8 | -30.2 | 35 | 1009 | Subtropical Depression | - |
| 1200 UTC 04 Oct | 35.9 | -28.5 | 40 | 1004 | Subtropical Storm | - |
| 1800 UTC 04 Oct | 37.1 | -26.7 | 50 | 997 | Subtropical Storm | - |
| 0000 UTC 05 Oct | 38.8 | -25.0 | 50 | 997 | Subtropical Storm | - |
| 0600 UTC 05 Oct | 41.0 | -23.3 | 45 | 1000 | Post-Tropical Cyclone | - |
| 1200 UTC 05 Oct | 43.6 | -23.0 | 45 | 1002 | Post-Tropical Cyclone | - |
Storm-Relative Tornadoes

Tornado Map
Summary Map
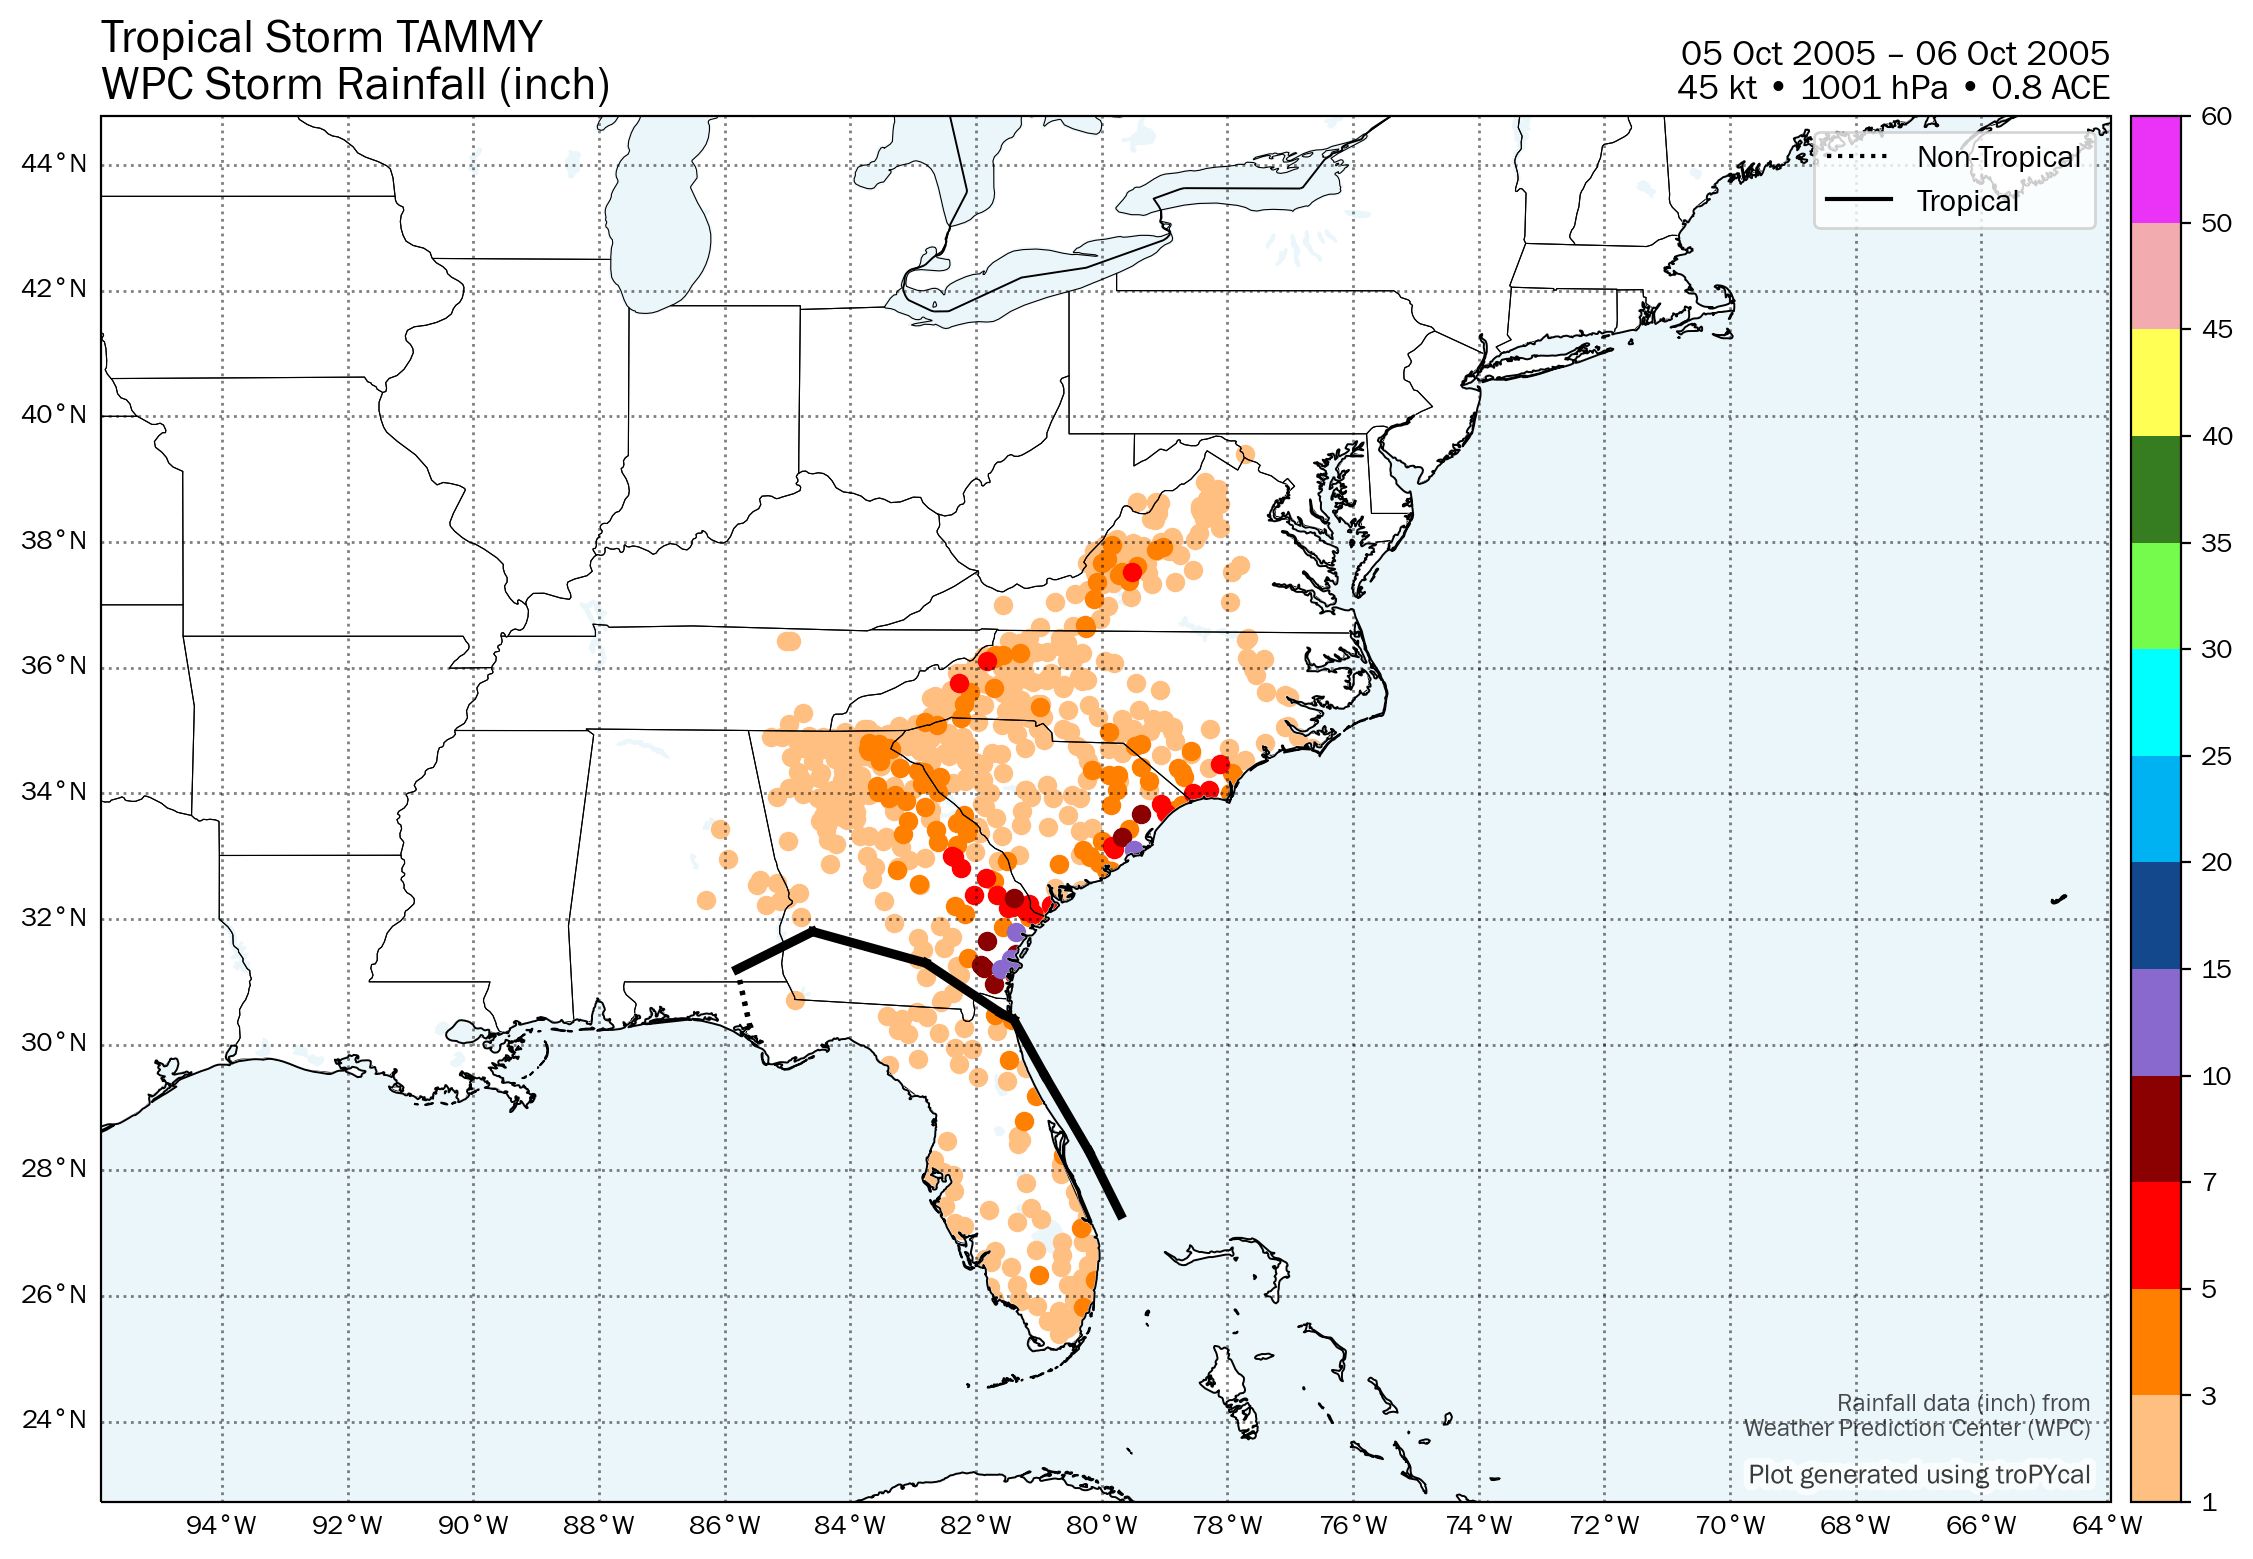
Gridded Rainfall
| Time (UTC) | Lat | Lon | Wind (mph) | Pressure | Storm Type | Category |
|---|---|---|---|---|---|---|
| 0600 UTC 05 Oct | 27.3 | -79.7 | 40 | 1006 | Tropical Storm | - |
| 1200 UTC 05 Oct | 28.3 | -80.2 | 45 | 1004 | Tropical Storm | - |
| 1800 UTC 05 Oct | 29.5 | -80.9 | 50 | 1001 | Tropical Storm | - |
| 2300 UTC 05 Oct | 30.4 | -81.4 | 50 | 1002 | Tropical Storm | - |
| 0000 UTC 06 Oct | 30.5 | -81.6 | 50 | 1002 | Tropical Storm | - |
| 0600 UTC 06 Oct | 31.3 | -82.8 | 40 | 1005 | Tropical Storm | - |
| 1200 UTC 06 Oct | 31.8 | -84.6 | 30 | 1005 | Tropical Depression | - |
| 1800 UTC 06 Oct | 31.2 | -85.8 | 20 | 1006 | Tropical Depression | - |
| 0000 UTC 07 Oct | 30.3 | -85.6 | 15 | 1005 | Remnant Low | - |
| Time (UTC) | Lat | Lon | Wind (mph) | Pressure | Storm Type | Category |
|---|---|---|---|---|---|---|
| 0600 UTC 08 Oct | 26.1 | -57.4 | 35 | 1009 | Subtropical Depression | - |
| 1200 UTC 08 Oct | 27.7 | -58.5 | 35 | 1008 | Subtropical Depression | - |
| 1800 UTC 08 Oct | 28.8 | -60.1 | 35 | 1009 | Subtropical Depression | - |
| 0000 UTC 09 Oct | 29.3 | -62.0 | 30 | 1009 | Subtropical Depression | - |
| 0600 UTC 09 Oct | 29.3 | -63.3 | 30 | 1009 | Subtropical Depression | - |
| 1200 UTC 09 Oct | 29.5 | -64.5 | 30 | 1009 | Subtropical Depression | - |
| 1800 UTC 09 Oct | 30.0 | -65.2 | 30 | 1009 | Subtropical Depression | - |
| 0000 UTC 10 Oct | 30.7 | -66.0 | 30 | 1009 | Subtropical Depression | - |
| 0600 UTC 10 Oct | 31.6 | -67.5 | 30 | 1009 | Remnant Low | - |
| 1200 UTC 10 Oct | 32.5 | -68.9 | 35 | 1009 | Remnant Low | - |
| 1800 UTC 10 Oct | 33.5 | -70.0 | 35 | 1008 | Remnant Low | - |
| 0000 UTC 11 Oct | 34.3 | -71.0 | 35 | 1008 | Remnant Low | - |
| 0600 UTC 11 Oct | 35.5 | -71.7 | 35 | 1008 | Remnant Low | - |
| 1200 UTC 11 Oct | 36.7 | -71.8 | 35 | 1008 | Post-Tropical Cyclone | - |
| 1800 UTC 11 Oct | 37.8 | -71.7 | 35 | 1008 | Post-Tropical Cyclone | - |
| 0000 UTC 12 Oct | 38.5 | -71.9 | 35 | 1009 | Post-Tropical Cyclone | - |
| 0600 UTC 12 Oct | 38.8 | -72.4 | 35 | 1010 | Post-Tropical Cyclone | - |
| 1200 UTC 12 Oct | 38.9 | -73.0 | 40 | 1011 | Post-Tropical Cyclone | - |
| 1800 UTC 12 Oct | 38.7 | -73.5 | 45 | 1011 | Post-Tropical Cyclone | - |
| 0000 UTC 13 Oct | 38.3 | -73.5 | 45 | 1010 | Post-Tropical Cyclone | - |
| 0600 UTC 13 Oct | 37.7 | -73.5 | 45 | 1010 | Post-Tropical Cyclone | - |
| 1200 UTC 13 Oct | 37.2 | -73.0 | 45 | 1008 | Post-Tropical Cyclone | - |
| 1800 UTC 13 Oct | 37.8 | -73.0 | 45 | 1006 | Post-Tropical Cyclone | - |
| 0000 UTC 14 Oct | 38.0 | -73.4 | 45 | 1006 | Post-Tropical Cyclone | - |
| 0600 UTC 14 Oct | 37.6 | -73.8 | 45 | 1005 | Post-Tropical Cyclone | - |
| 1200 UTC 14 Oct | 38.6 | -73.8 | 40 | 1005 | Post-Tropical Cyclone | - |
| 1800 UTC 14 Oct | 39.6 | -73.8 | 35 | 1005 | Post-Tropical Cyclone | - |
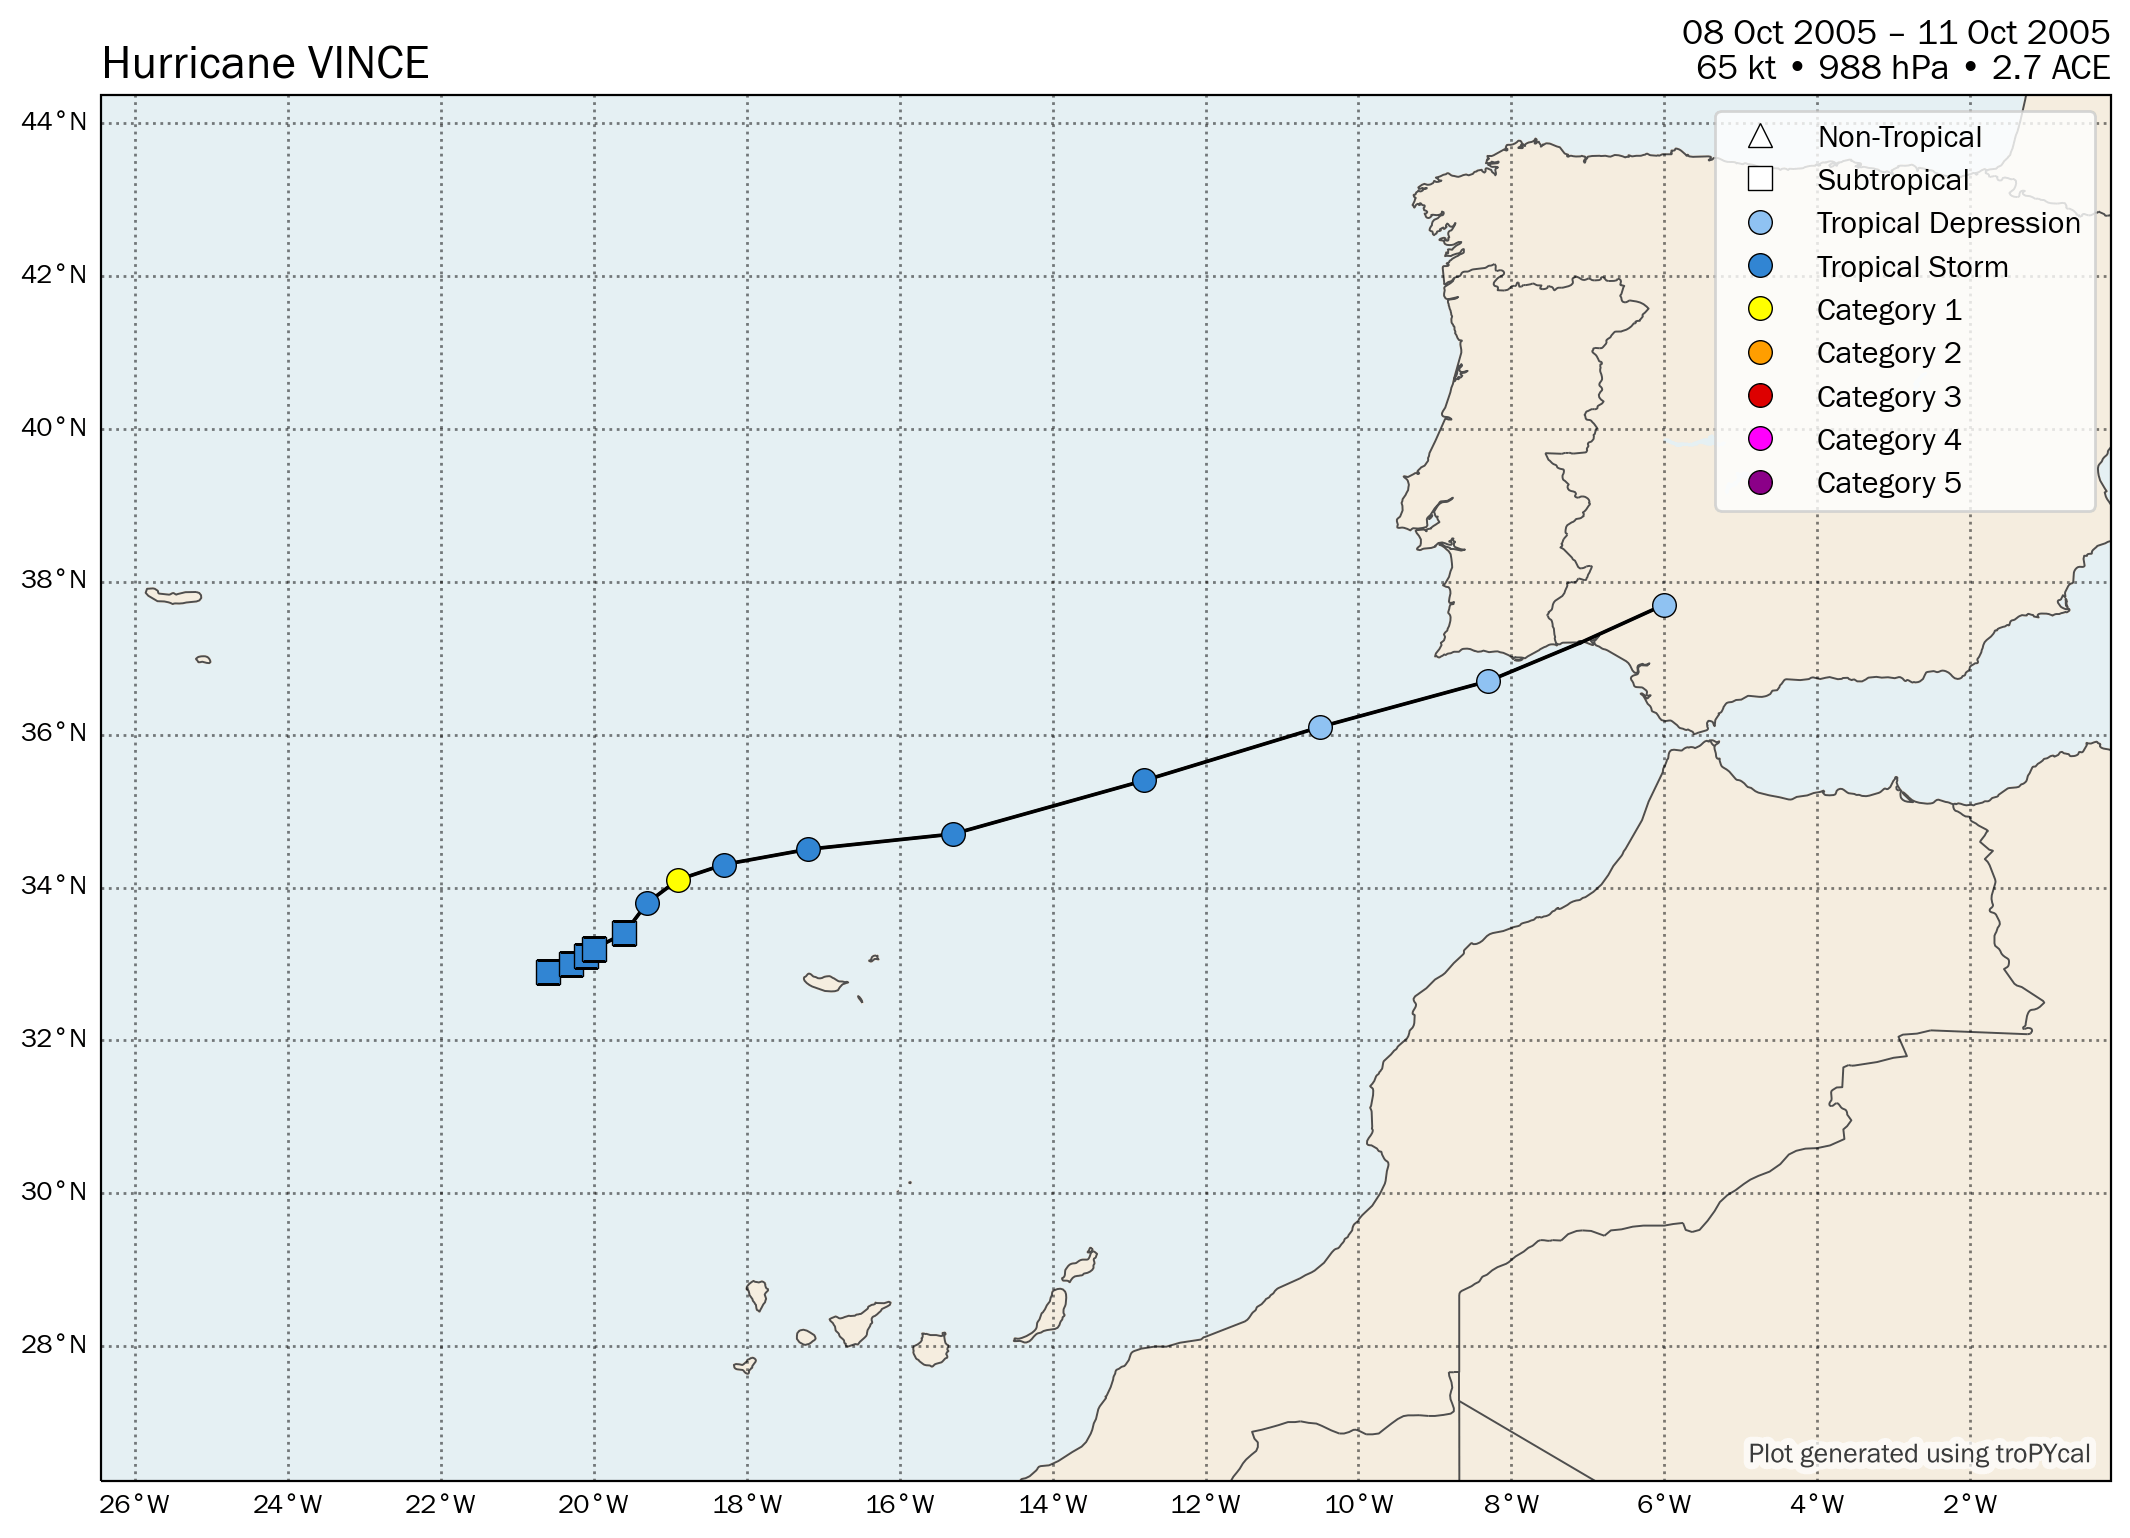
| Time (UTC) | Lat | Lon | Wind (mph) | Pressure | Storm Type | Category |
|---|---|---|---|---|---|---|
| 0600 UTC 08 Oct | 32.9 | -20.6 | 45 | 1001 | Subtropical Storm | - |
| 1200 UTC 08 Oct | 33.0 | -20.3 | 50 | 1000 | Subtropical Storm | - |
| 1800 UTC 08 Oct | 33.1 | -20.1 | 50 | 1000 | Subtropical Storm | - |
| 0000 UTC 09 Oct | 33.2 | -20.0 | 50 | 999 | Subtropical Storm | - |
| 0600 UTC 09 Oct | 33.4 | -19.6 | 60 | 998 | Subtropical Storm | - |
| 1200 UTC 09 Oct | 33.8 | -19.3 | 65 | 995 | Tropical Storm | - |
| 1800 UTC 09 Oct | 34.1 | -18.9 | 75 | 988 | Hurricane | 1 |
| 0000 UTC 10 Oct | 34.3 | -18.3 | 70 | 990 | Tropical Storm | - |
| 0600 UTC 10 Oct | 34.5 | -17.2 | 60 | 992 | Tropical Storm | - |
| 1200 UTC 10 Oct | 34.7 | -15.3 | 50 | 995 | Tropical Storm | - |
| 1800 UTC 10 Oct | 35.4 | -12.8 | 40 | 998 | Tropical Storm | - |
| 0000 UTC 11 Oct | 36.1 | -10.5 | 35 | 1000 | Tropical Depression | - |
| 0600 UTC 11 Oct | 36.7 | -8.3 | 35 | 1002 | Tropical Depression | - |
| 0900 UTC 11 Oct | 37.2 | -7.1 | 35 | 1002 | Tropical Depression | - |
| 1200 UTC 11 Oct | 37.7 | -6.0 | 35 | 1003 | Tropical Depression | - |
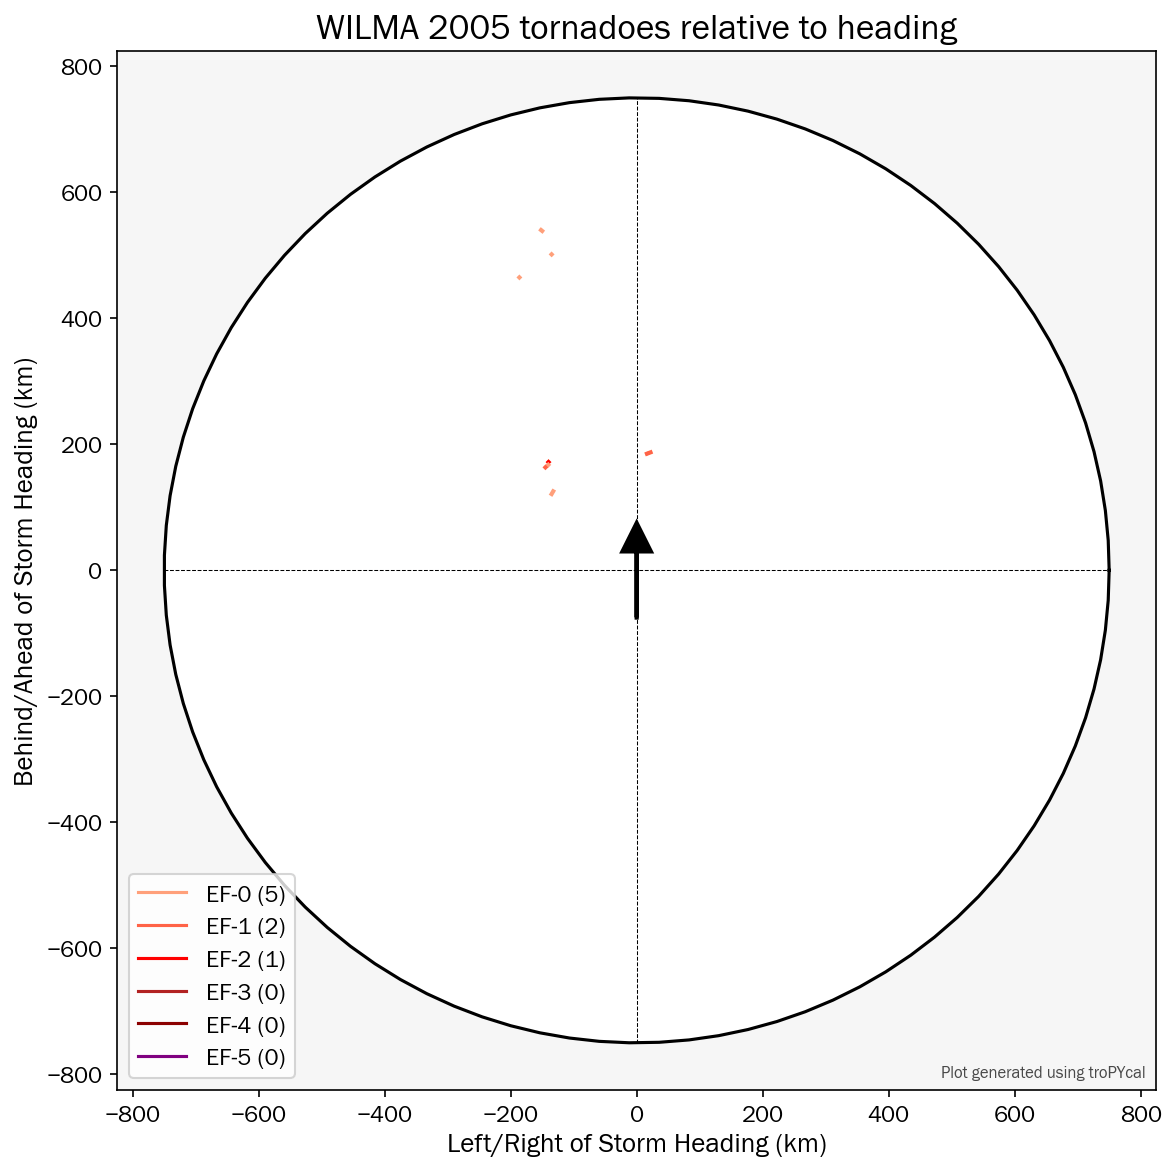
Storm-Relative Tornadoes
Tornado Map
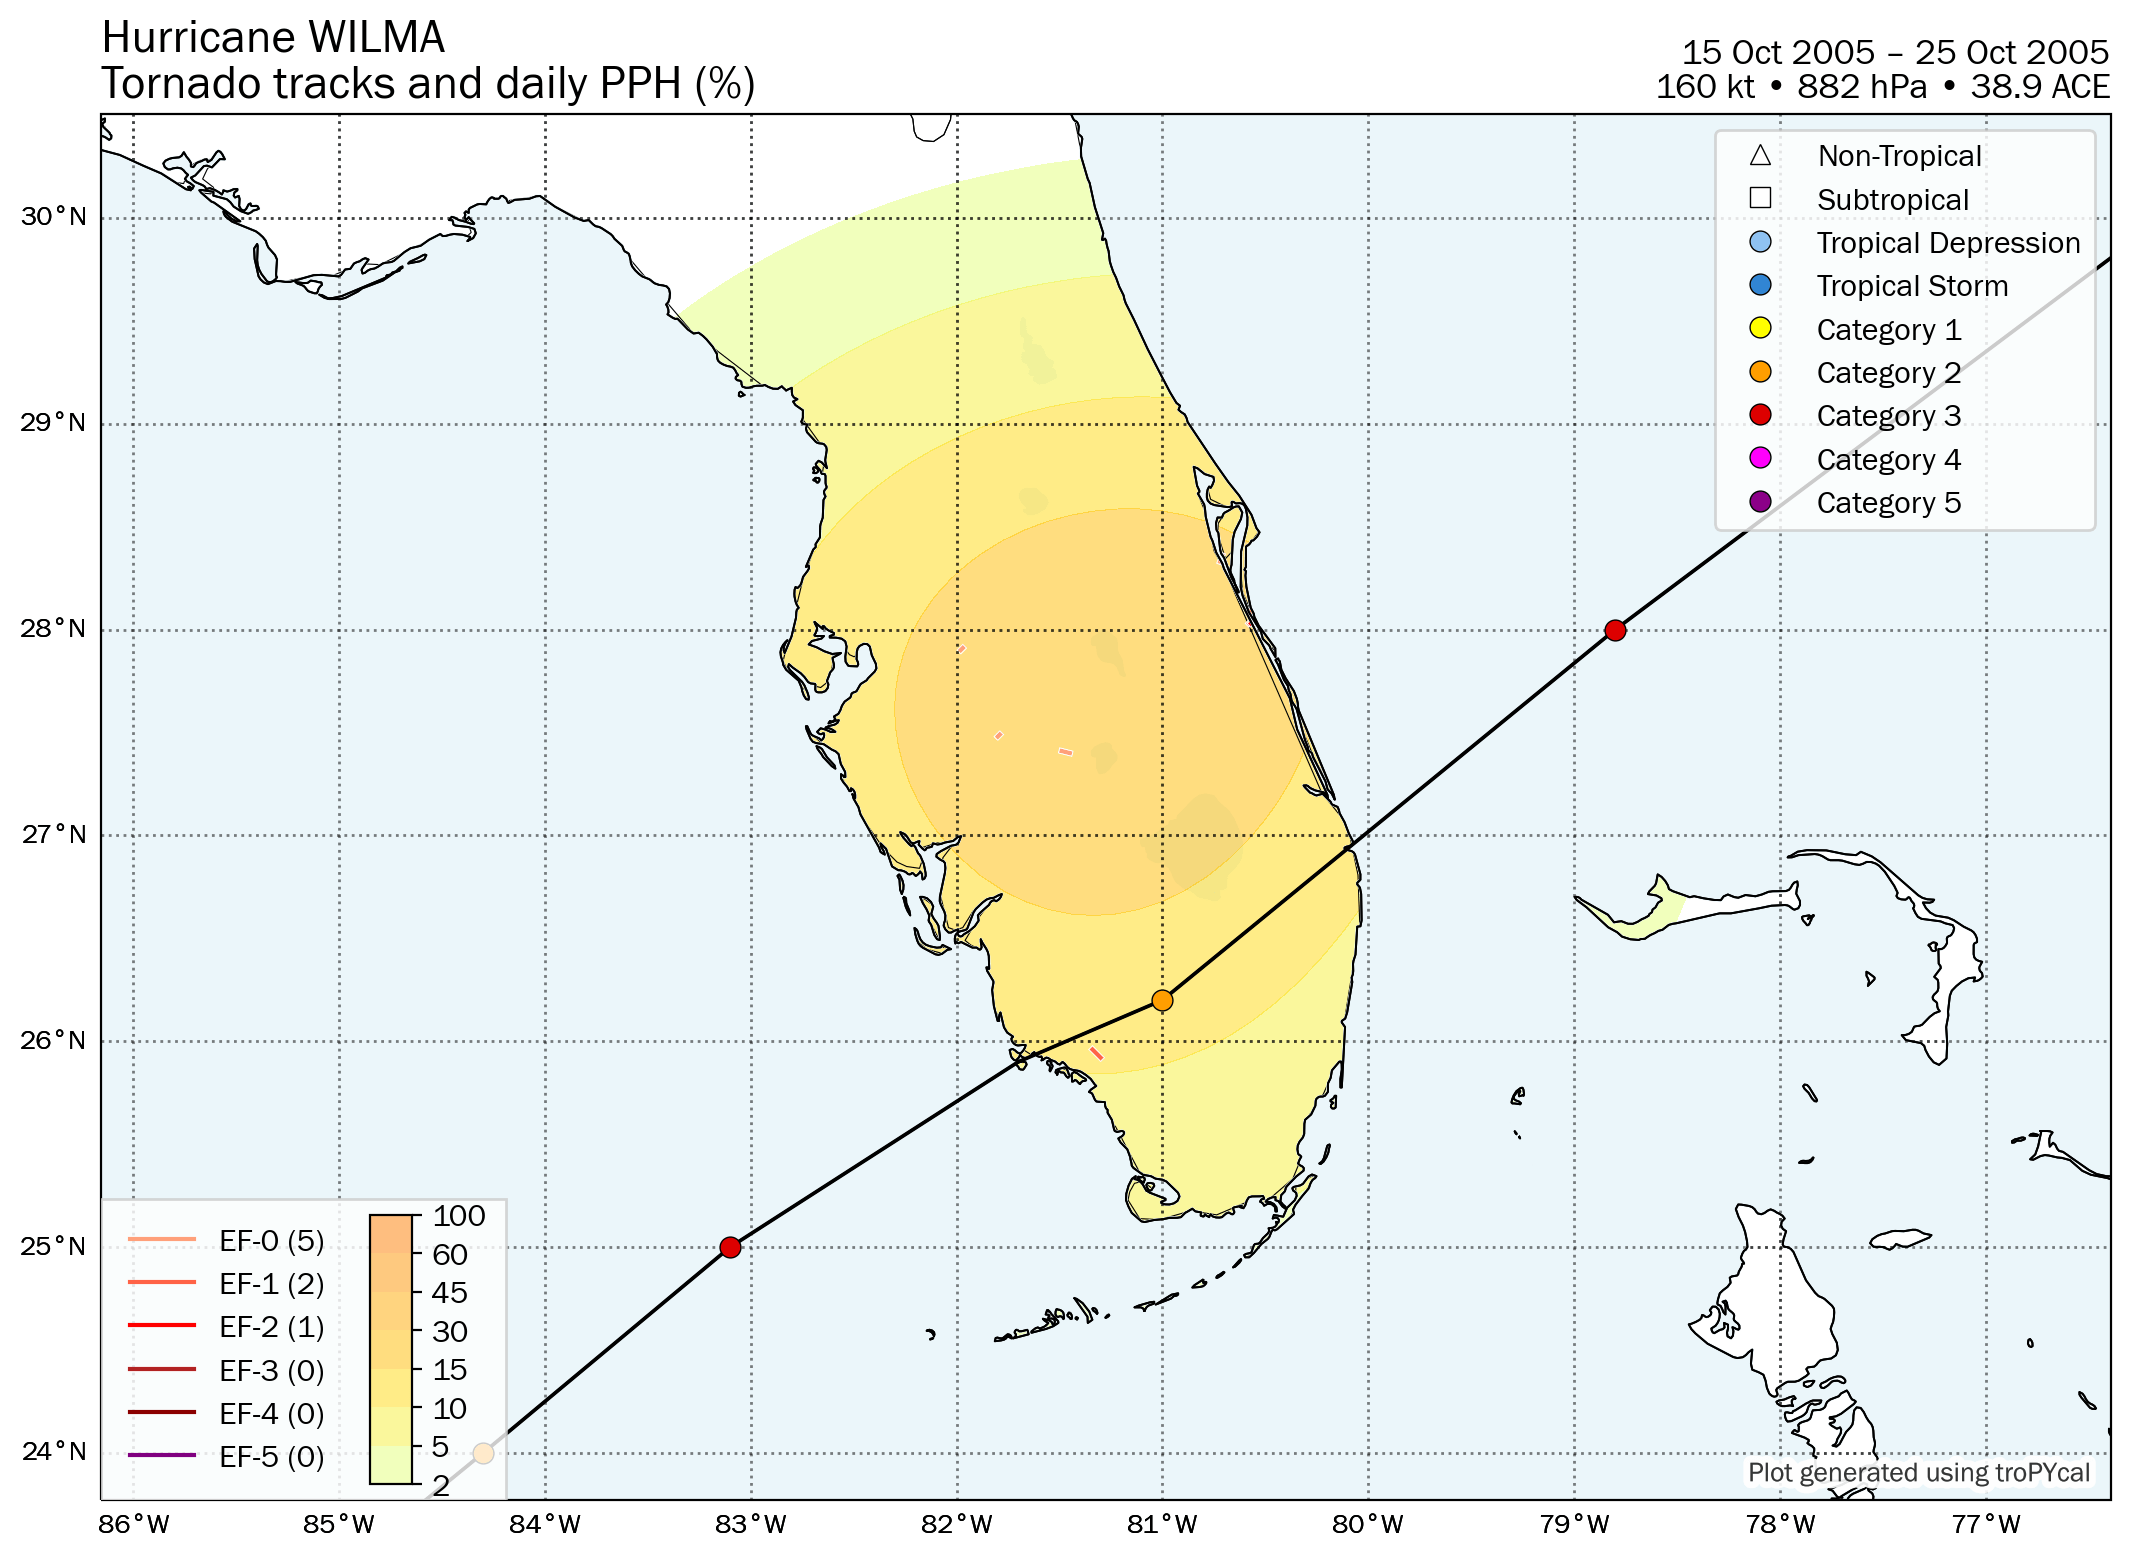
Summary Map
Gridded Rainfall
Summary Plot
Recon-Derived Hovmoller
Recon-Derived Wind Swath
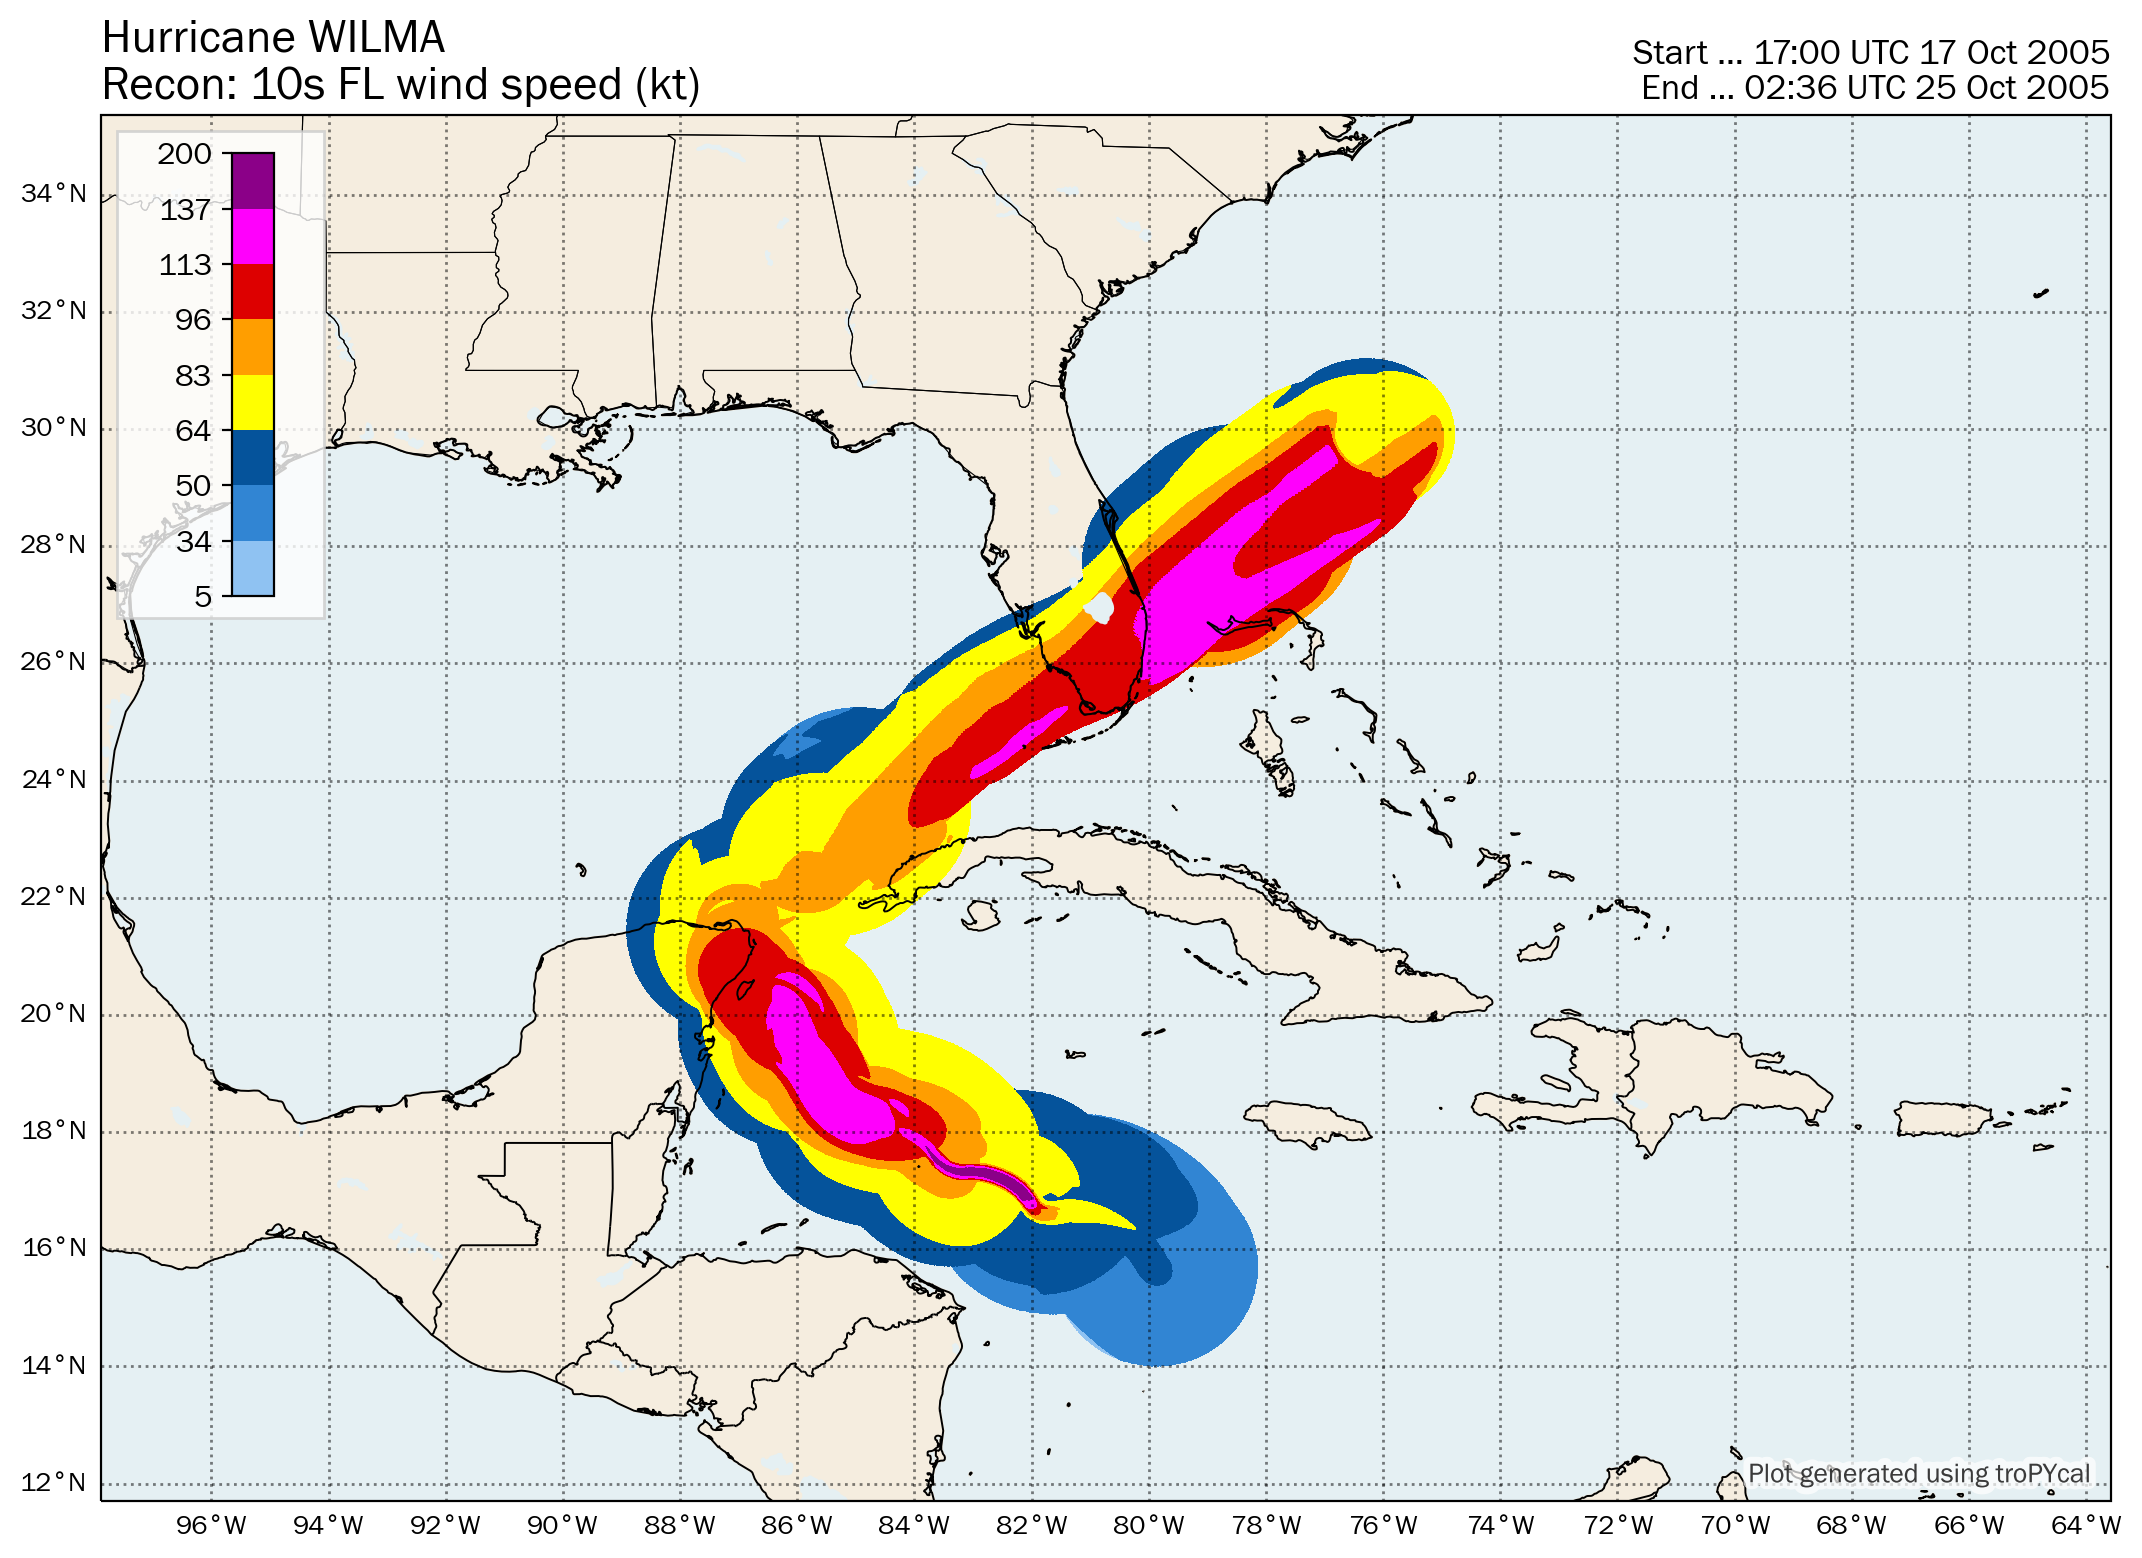
| Time (UTC) | Lat | Lon | Wind (mph) | Pressure | Storm Type | Category |
|---|---|---|---|---|---|---|
| 1800 UTC 15 Oct | 17.6 | -78.5 | 30 | 1004 | Tropical Depression | - |
| 0000 UTC 16 Oct | 17.6 | -78.8 | 30 | 1004 | Tropical Depression | - |
| 0600 UTC 16 Oct | 17.5 | -79.0 | 35 | 1003 | Tropical Depression | - |
| 1200 UTC 16 Oct | 17.5 | -79.2 | 35 | 1003 | Tropical Depression | - |
| 1800 UTC 16 Oct | 17.5 | -79.4 | 35 | 1002 | Tropical Depression | - |
| 0000 UTC 17 Oct | 17.4 | -79.6 | 35 | 1001 | Tropical Depression | - |
| 0600 UTC 17 Oct | 16.9 | -79.6 | 40 | 1000 | Tropical Storm | - |
| 1200 UTC 17 Oct | 16.3 | -79.7 | 45 | 999 | Tropical Storm | - |
| 1800 UTC 17 Oct | 16.0 | -79.8 | 50 | 997 | Tropical Storm | - |
| 0000 UTC 18 Oct | 15.8 | -79.9 | 65 | 988 | Tropical Storm | - |
| 0600 UTC 18 Oct | 15.7 | -79.9 | 70 | 982 | Tropical Storm | - |
| 1200 UTC 18 Oct | 16.2 | -80.3 | 75 | 979 | Hurricane | 1 |
| 1800 UTC 18 Oct | 16.6 | -81.1 | 85 | 975 | Hurricane | 1 |
| 0000 UTC 19 Oct | 16.6 | -81.8 | 150 | 946 | Hurricane | 4 |
| 0600 UTC 19 Oct | 17.0 | -82.2 | 175 | 892 | Hurricane | 5 |
| 1200 UTC 19 Oct | 17.3 | -82.8 | 185 | 882 | Hurricane | 5 |
| 1800 UTC 19 Oct | 17.4 | -83.4 | 160 | 892 | Hurricane | 5 |
| 0000 UTC 20 Oct | 17.9 | -84.0 | 155 | 892 | Hurricane | 4 |
| 0600 UTC 20 Oct | 18.1 | -84.7 | 150 | 901 | Hurricane | 4 |
| 1200 UTC 20 Oct | 18.3 | -85.2 | 150 | 910 | Hurricane | 4 |
| 1800 UTC 20 Oct | 18.6 | -85.5 | 150 | 917 | Hurricane | 4 |
| 0000 UTC 21 Oct | 19.1 | -85.8 | 150 | 924 | Hurricane | 4 |
| 0600 UTC 21 Oct | 19.5 | -86.1 | 150 | 930 | Hurricane | 4 |
| 1200 UTC 21 Oct | 20.1 | -86.4 | 145 | 929 | Hurricane | 4 |
| 1800 UTC 21 Oct | 20.3 | -86.7 | 140 | 926 | Hurricane | 4 |
| 2145 UTC 21 Oct | 20.6 | -86.8 | 150 | 927 | Hurricane | 4 |
| 0000 UTC 22 Oct | 20.6 | -86.8 | 140 | 930 | Hurricane | 4 |
| 0330 UTC 22 Oct | 20.8 | -86.9 | 130 | 933 | Hurricane | 4 |
| 0600 UTC 22 Oct | 20.8 | -87.0 | 125 | 935 | Hurricane | 3 |
| 1200 UTC 22 Oct | 21.0 | -87.1 | 115 | 947 | Hurricane | 3 |
| 1800 UTC 22 Oct | 21.3 | -87.1 | 100 | 958 | Hurricane | 2 |
| 0000 UTC 23 Oct | 21.6 | -87.0 | 100 | 960 | Hurricane | 2 |
| 0600 UTC 23 Oct | 21.8 | -86.8 | 100 | 962 | Hurricane | 2 |
| 1200 UTC 23 Oct | 22.4 | -86.1 | 100 | 961 | Hurricane | 2 |
| 1800 UTC 23 Oct | 23.1 | -85.4 | 105 | 963 | Hurricane | 2 |
| 0000 UTC 24 Oct | 24.0 | -84.3 | 110 | 958 | Hurricane | 2 |
| 0600 UTC 24 Oct | 25.0 | -83.1 | 125 | 953 | Hurricane | 3 |
| 1030 UTC 24 Oct | 25.9 | -81.7 | 120 | 950 | Hurricane | 3 |
| 1200 UTC 24 Oct | 26.2 | -81.0 | 110 | 950 | Hurricane | 2 |
| 1800 UTC 24 Oct | 28.0 | -78.8 | 120 | 955 | Hurricane | 3 |
| 0000 UTC 25 Oct | 30.1 | -76.0 | 125 | 955 | Hurricane | 3 |
| 0600 UTC 25 Oct | 33.3 | -72.0 | 115 | 963 | Hurricane | 3 |
| 1200 UTC 25 Oct | 36.8 | -67.9 | 105 | 970 | Hurricane | 2 |
| 1800 UTC 25 Oct | 40.5 | -63.5 | 85 | 976 | Hurricane | 1 |
| 0000 UTC 26 Oct | 42.5 | -60.0 | 70 | 978 | Post-Tropical Cyclone | - |
| 0600 UTC 26 Oct | 44.0 | -57.5 | 65 | 982 | Post-Tropical Cyclone | - |
| 1200 UTC 26 Oct | 45.0 | -55.0 | 60 | 986 | Post-Tropical Cyclone | - |
| 1800 UTC 26 Oct | 45.5 | -52.0 | 45 | 990 | Post-Tropical Cyclone | - |
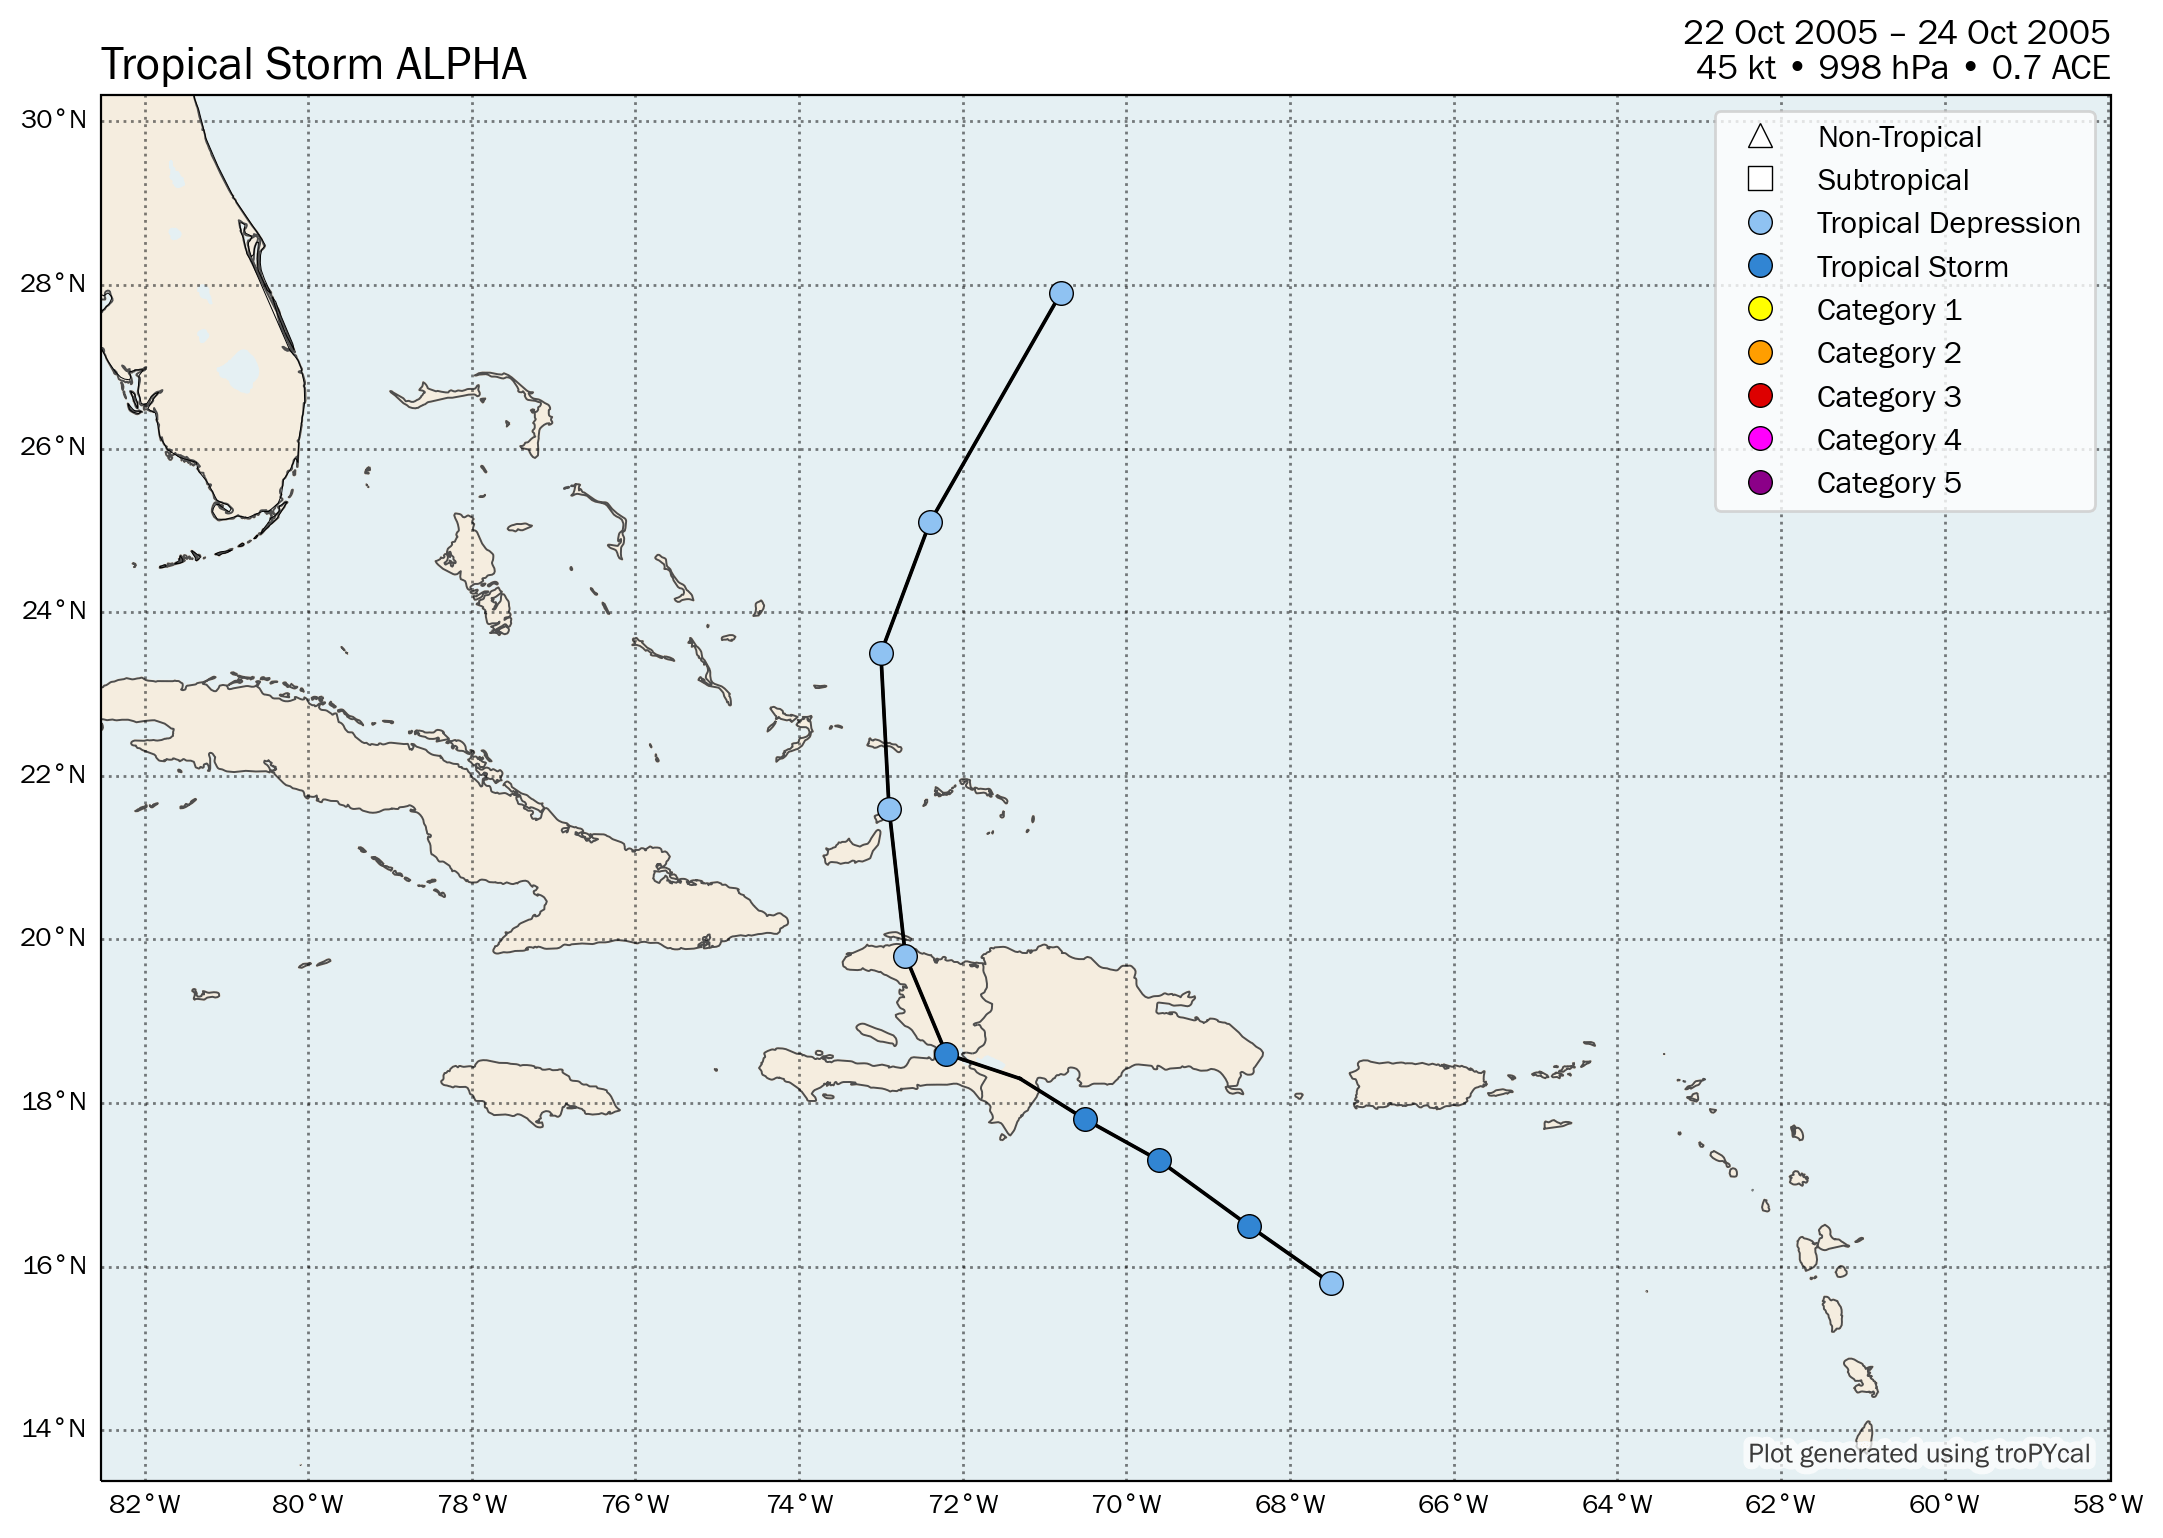
| Time (UTC) | Lat | Lon | Wind (mph) | Pressure | Storm Type | Category |
|---|---|---|---|---|---|---|
| 1200 UTC 22 Oct | 15.8 | -67.5 | 35 | 1007 | Tropical Depression | - |
| 1800 UTC 22 Oct | 16.5 | -68.5 | 40 | 1005 | Tropical Storm | - |
| 0000 UTC 23 Oct | 17.3 | -69.6 | 50 | 1000 | Tropical Storm | - |
| 0600 UTC 23 Oct | 17.8 | -70.5 | 50 | 998 | Tropical Storm | - |
| 1000 UTC 23 Oct | 18.3 | -71.3 | 50 | 1000 | Tropical Storm | - |
| 1200 UTC 23 Oct | 18.6 | -72.2 | 40 | 1002 | Tropical Storm | - |
| 1800 UTC 23 Oct | 19.8 | -72.7 | 35 | 1004 | Tropical Depression | - |
| 0000 UTC 24 Oct | 21.6 | -72.9 | 35 | 1004 | Tropical Depression | - |
| 0600 UTC 24 Oct | 23.5 | -73.0 | 35 | 1004 | Tropical Depression | - |
| 1200 UTC 24 Oct | 25.1 | -72.4 | 35 | 1004 | Tropical Depression | - |
| 1800 UTC 24 Oct | 27.9 | -70.8 | 35 | 1004 | Tropical Depression | - |
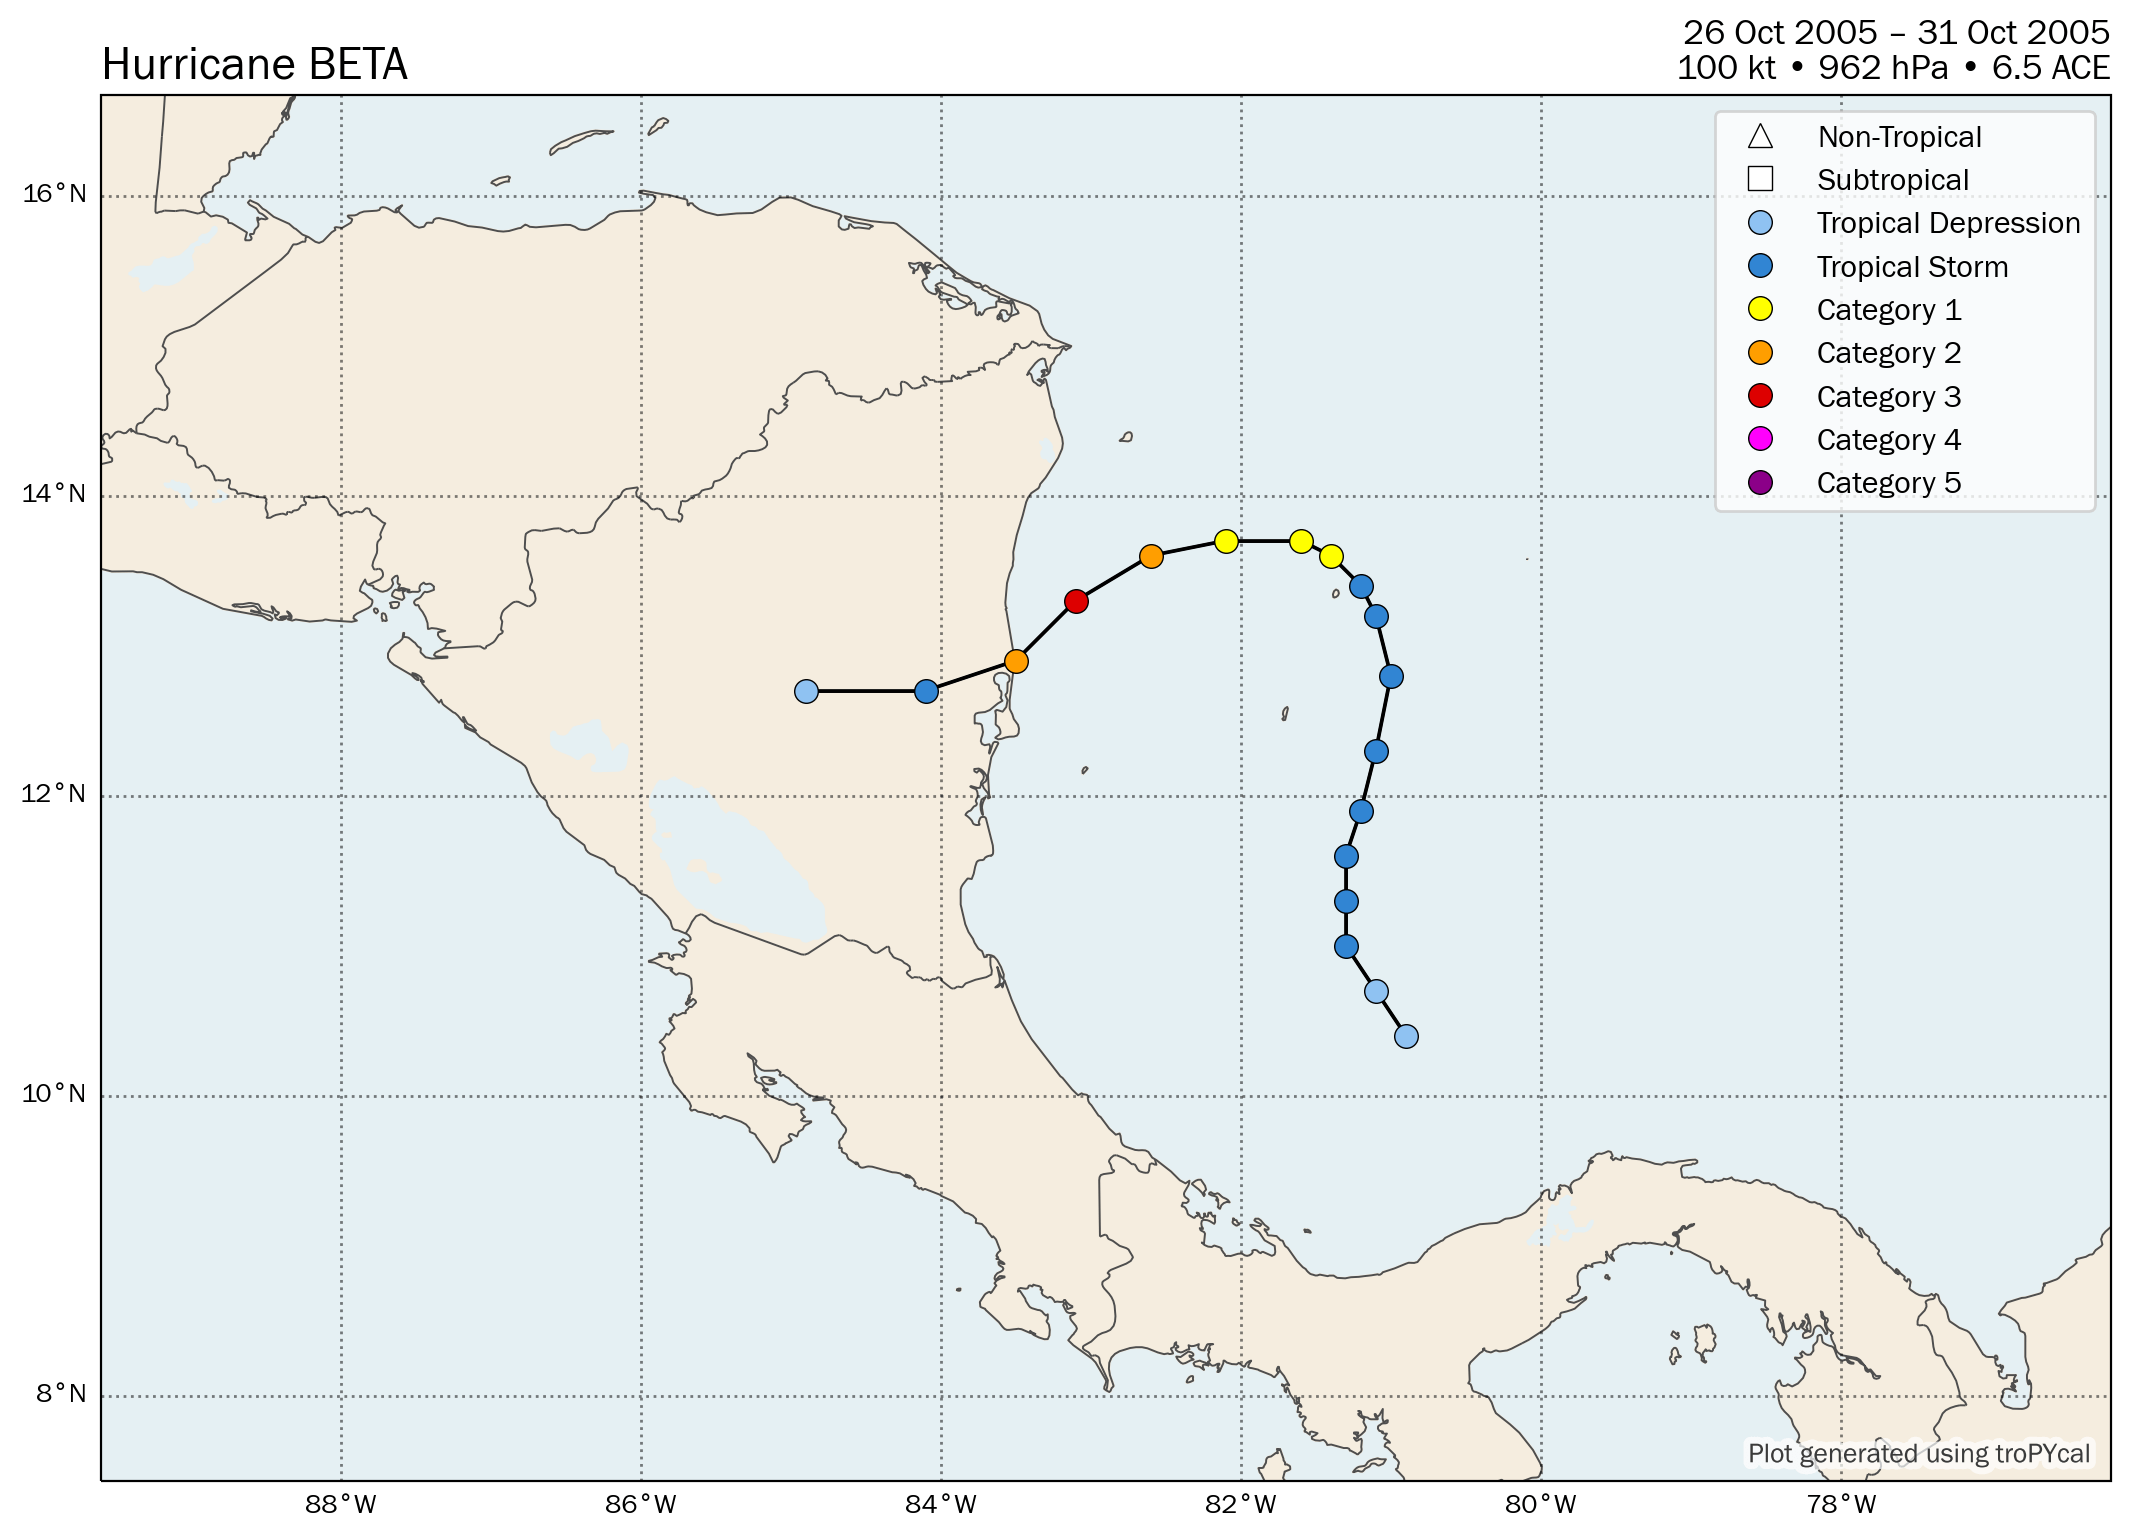
| Time (UTC) | Lat | Lon | Wind (mph) | Pressure | Storm Type | Category |
|---|---|---|---|---|---|---|
| 1800 UTC 26 Oct | 10.4 | -80.9 | 35 | 1007 | Tropical Depression | - |
| 0000 UTC 27 Oct | 10.7 | -81.1 | 35 | 1007 | Tropical Depression | - |
| 0600 UTC 27 Oct | 11.0 | -81.3 | 40 | 1005 | Tropical Storm | - |
| 1200 UTC 27 Oct | 11.3 | -81.3 | 50 | 1000 | Tropical Storm | - |
| 1800 UTC 27 Oct | 11.6 | -81.3 | 60 | 997 | Tropical Storm | - |
| 0000 UTC 28 Oct | 11.9 | -81.2 | 60 | 995 | Tropical Storm | - |
| 0600 UTC 28 Oct | 12.3 | -81.1 | 60 | 994 | Tropical Storm | - |
| 1200 UTC 28 Oct | 12.8 | -81.0 | 60 | 993 | Tropical Storm | - |
| 1800 UTC 28 Oct | 13.2 | -81.1 | 60 | 991 | Tropical Storm | - |
| 0000 UTC 29 Oct | 13.4 | -81.2 | 70 | 988 | Tropical Storm | - |
| 0600 UTC 29 Oct | 13.6 | -81.4 | 80 | 985 | Hurricane | 1 |
| 1200 UTC 29 Oct | 13.7 | -81.6 | 85 | 982 | Hurricane | 1 |
| 1800 UTC 29 Oct | 13.7 | -82.1 | 85 | 980 | Hurricane | 1 |
| 0000 UTC 30 Oct | 13.6 | -82.6 | 105 | 970 | Hurricane | 2 |
| 0600 UTC 30 Oct | 13.3 | -83.1 | 115 | 962 | Hurricane | 3 |
| 1200 UTC 30 Oct | 12.9 | -83.5 | 105 | 970 | Hurricane | 2 |
| 1800 UTC 30 Oct | 12.7 | -84.1 | 65 | 990 | Tropical Storm | - |
| 0000 UTC 31 Oct | 12.7 | -84.9 | 25 | 1000 | Tropical Depression | - |
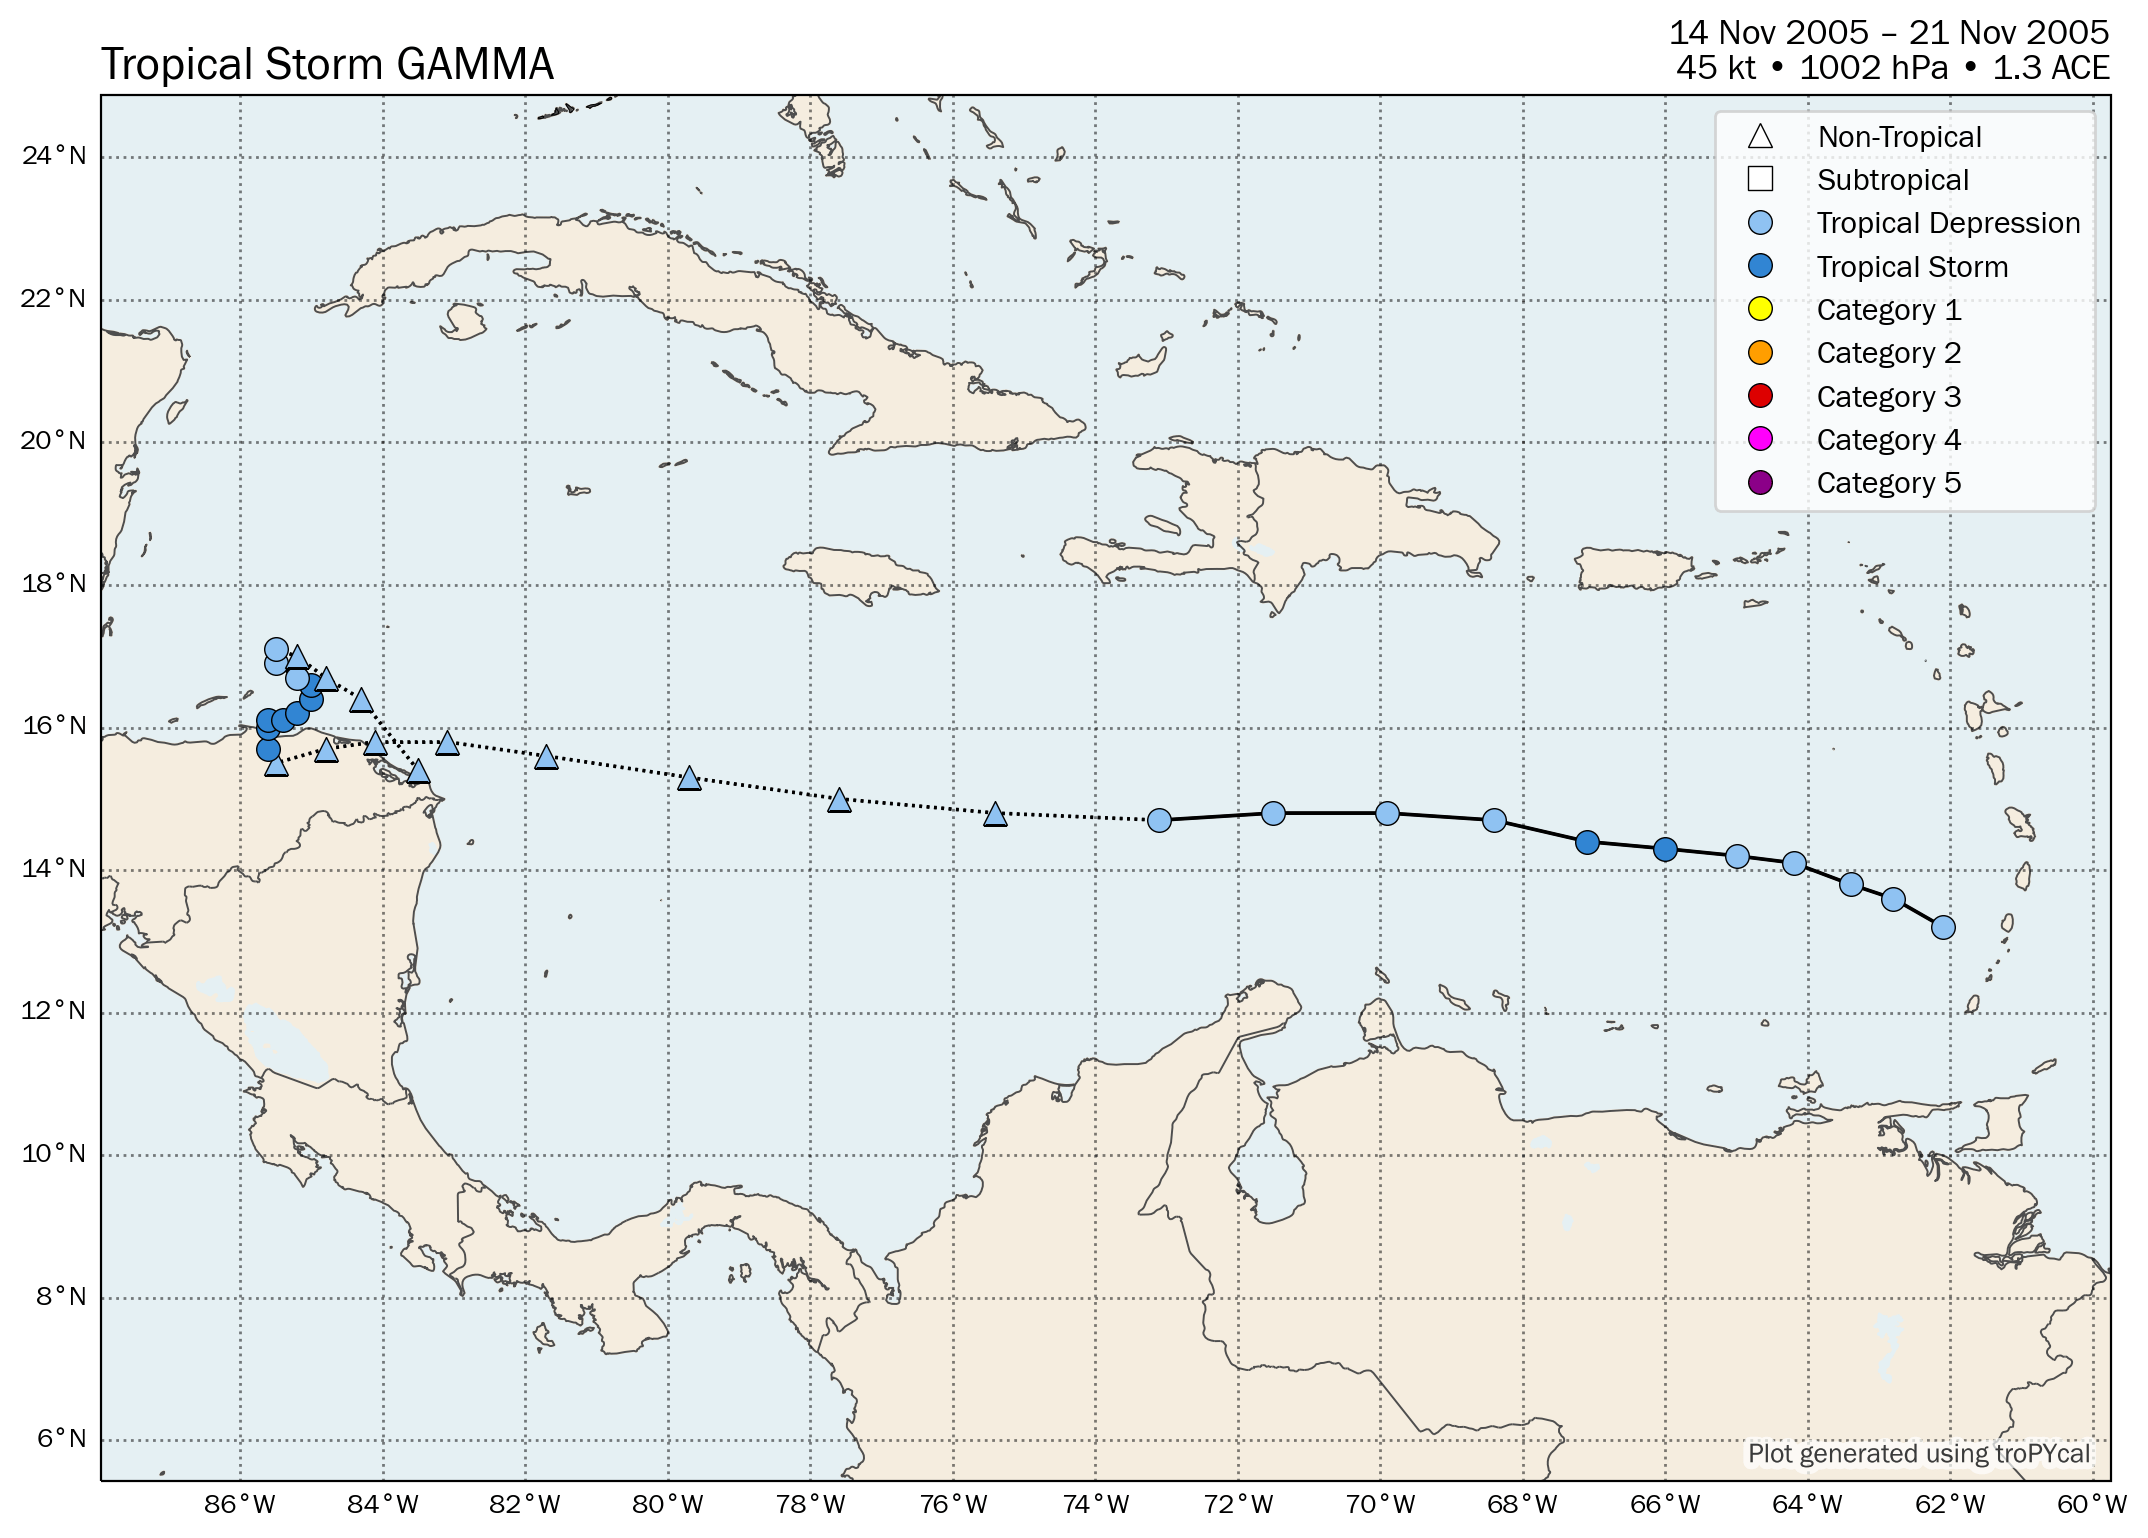
| Time (UTC) | Lat | Lon | Wind (mph) | Pressure | Storm Type | Category |
|---|---|---|---|---|---|---|
| 0000 UTC 14 Nov | 13.2 | -62.1 | 35 | 1007 | Tropical Depression | - |
| 0600 UTC 14 Nov | 13.6 | -62.8 | 35 | 1006 | Tropical Depression | - |
| 1200 UTC 14 Nov | 13.8 | -63.4 | 35 | 1006 | Tropical Depression | - |
| 1800 UTC 14 Nov | 14.1 | -64.2 | 35 | 1005 | Tropical Depression | - |
| 0000 UTC 15 Nov | 14.2 | -65.0 | 35 | 1004 | Tropical Depression | - |
| 0600 UTC 15 Nov | 14.3 | -66.0 | 40 | 1004 | Tropical Storm | - |
| 1200 UTC 15 Nov | 14.4 | -67.1 | 40 | 1004 | Tropical Storm | - |
| 1800 UTC 15 Nov | 14.7 | -68.4 | 35 | 1005 | Tropical Depression | - |
| 0000 UTC 16 Nov | 14.8 | -69.9 | 35 | 1006 | Tropical Depression | - |
| 0600 UTC 16 Nov | 14.8 | -71.5 | 35 | 1006 | Tropical Depression | - |
| 1200 UTC 16 Nov | 14.7 | -73.1 | 30 | 1006 | Tropical Depression | - |
| 1800 UTC 16 Nov | 14.8 | -75.4 | 30 | 1006 | Remnant Low | - |
| 0000 UTC 17 Nov | 15.0 | -77.6 | 30 | 1007 | Remnant Low | - |
| 0600 UTC 17 Nov | 15.3 | -79.7 | 30 | 1008 | Remnant Low | - |
| 1200 UTC 17 Nov | 15.6 | -81.7 | 35 | 1007 | Remnant Low | - |
| 1800 UTC 17 Nov | 15.8 | -83.1 | 35 | 1007 | Remnant Low | - |
| 0000 UTC 18 Nov | 15.8 | -84.1 | 35 | 1007 | Remnant Low | - |
| 0600 UTC 18 Nov | 15.7 | -84.8 | 35 | 1006 | Remnant Low | - |
| 1200 UTC 18 Nov | 15.5 | -85.5 | 35 | 1006 | Remnant Low | - |
| 1800 UTC 18 Nov | 15.7 | -85.6 | 40 | 1006 | Tropical Storm | - |
| 0000 UTC 19 Nov | 16.0 | -85.6 | 45 | 1005 | Tropical Storm | - |
| 0600 UTC 19 Nov | 16.1 | -85.6 | 45 | 1004 | Tropical Storm | - |
| 1200 UTC 19 Nov | 16.1 | -85.4 | 50 | 1002 | Tropical Storm | - |
| 1800 UTC 19 Nov | 16.2 | -85.2 | 45 | 1004 | Tropical Storm | - |
| 0000 UTC 20 Nov | 16.4 | -85.0 | 45 | 1005 | Tropical Storm | - |
| 0600 UTC 20 Nov | 16.6 | -85.0 | 40 | 1006 | Tropical Storm | - |
| 1200 UTC 20 Nov | 16.7 | -85.2 | 35 | 1007 | Tropical Depression | - |
| 1800 UTC 20 Nov | 16.9 | -85.5 | 35 | 1007 | Tropical Depression | - |
| 0000 UTC 21 Nov | 17.1 | -85.5 | 30 | 1008 | Tropical Depression | - |
| 0600 UTC 21 Nov | 17.0 | -85.2 | 30 | 1008 | Remnant Low | - |
| 1200 UTC 21 Nov | 16.7 | -84.8 | 30 | 1008 | Remnant Low | - |
| 1800 UTC 21 Nov | 16.4 | -84.3 | 30 | 1009 | Remnant Low | - |
| 0000 UTC 22 Nov | 15.4 | -83.5 | 30 | 1009 | Remnant Low | - |
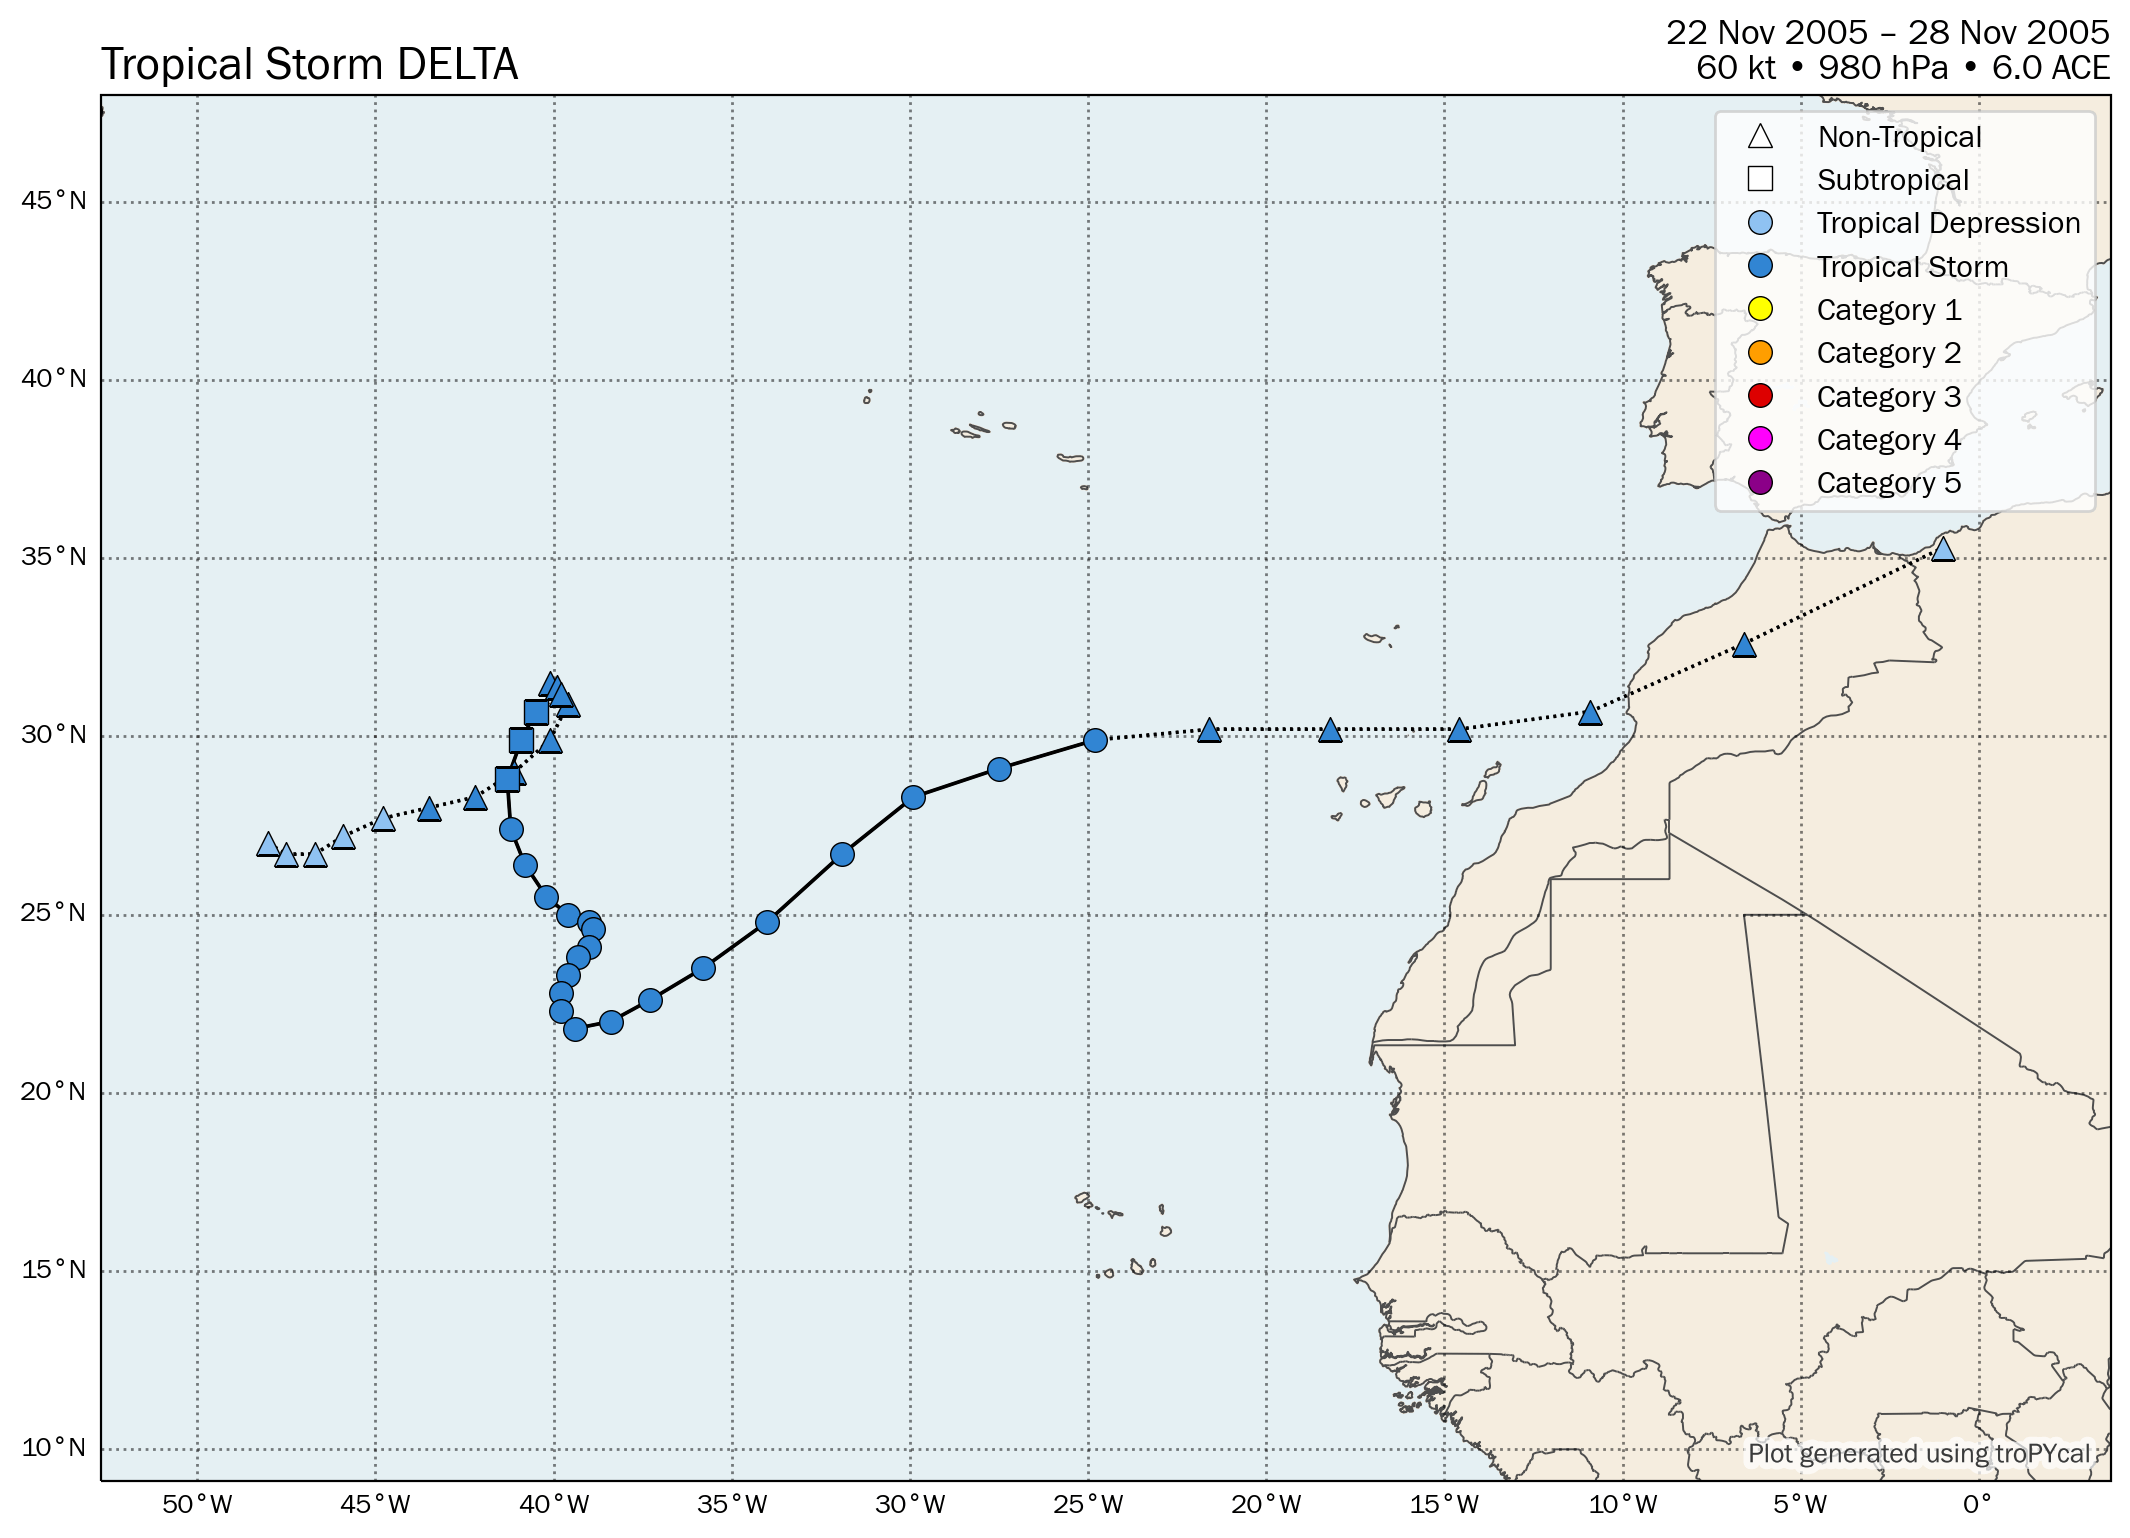
| Time (UTC) | Lat | Lon | Wind (mph) | Pressure | Storm Type | Category |
|---|---|---|---|---|---|---|
| 1200 UTC 19 Nov | 27.0 | -48.0 | 30 | 1010 | Disturbance | - |
| 1800 UTC 19 Nov | 26.7 | -47.5 | 30 | 1009 | Disturbance | - |
| 0000 UTC 20 Nov | 26.7 | -46.7 | 30 | 1008 | Disturbance | - |
| 0600 UTC 20 Nov | 27.2 | -45.9 | 30 | 1008 | Disturbance | - |
| 1200 UTC 20 Nov | 27.7 | -44.8 | 35 | 1007 | Disturbance | - |
| 1800 UTC 20 Nov | 28.0 | -43.5 | 40 | 1003 | Disturbance | - |
| 0000 UTC 21 Nov | 28.3 | -42.2 | 40 | 1000 | Disturbance | - |
| 0600 UTC 21 Nov | 29.0 | -41.1 | 40 | 998 | Disturbance | - |
| 1200 UTC 21 Nov | 29.9 | -40.1 | 40 | 996 | Disturbance | - |
| 1800 UTC 21 Nov | 30.9 | -39.6 | 45 | 994 | Disturbance | - |
| 0000 UTC 22 Nov | 31.5 | -40.1 | 45 | 992 | Disturbance | - |
| 0600 UTC 22 Nov | 31.4 | -39.9 | 50 | 990 | Disturbance | - |
| 1200 UTC 22 Nov | 31.2 | -39.8 | 50 | 988 | Disturbance | - |
| 1800 UTC 22 Nov | 30.7 | -40.5 | 50 | 986 | Subtropical Storm | - |
| 0000 UTC 23 Nov | 29.9 | -40.9 | 50 | 984 | Subtropical Storm | - |
| 0600 UTC 23 Nov | 28.8 | -41.3 | 50 | 983 | Subtropical Storm | - |
| 1200 UTC 23 Nov | 27.4 | -41.2 | 60 | 983 | Tropical Storm | - |
| 1800 UTC 23 Nov | 26.4 | -40.8 | 60 | 983 | Tropical Storm | - |
| 0000 UTC 24 Nov | 25.5 | -40.2 | 65 | 982 | Tropical Storm | - |
| 0600 UTC 24 Nov | 25.0 | -39.6 | 65 | 981 | Tropical Storm | - |
| 1200 UTC 24 Nov | 24.8 | -39.0 | 70 | 980 | Tropical Storm | - |
| 1800 UTC 24 Nov | 24.6 | -38.9 | 70 | 980 | Tropical Storm | - |
| 0000 UTC 25 Nov | 24.1 | -39.0 | 70 | 980 | Tropical Storm | - |
| 0600 UTC 25 Nov | 23.8 | -39.3 | 65 | 982 | Tropical Storm | - |
| 1200 UTC 25 Nov | 23.3 | -39.6 | 65 | 982 | Tropical Storm | - |
| 1800 UTC 25 Nov | 22.8 | -39.8 | 60 | 985 | Tropical Storm | - |
| 0000 UTC 26 Nov | 22.3 | -39.8 | 50 | 989 | Tropical Storm | - |
| 0600 UTC 26 Nov | 21.8 | -39.4 | 45 | 993 | Tropical Storm | - |
| 1200 UTC 26 Nov | 22.0 | -38.4 | 40 | 997 | Tropical Storm | - |
| 1800 UTC 26 Nov | 22.6 | -37.3 | 40 | 997 | Tropical Storm | - |
| 0000 UTC 27 Nov | 23.5 | -35.8 | 40 | 998 | Tropical Storm | - |
| 0600 UTC 27 Nov | 24.8 | -34.0 | 50 | 993 | Tropical Storm | - |
| 1200 UTC 27 Nov | 26.7 | -31.9 | 70 | 982 | Tropical Storm | - |
| 1800 UTC 27 Nov | 28.3 | -29.9 | 70 | 982 | Tropical Storm | - |
| 0000 UTC 28 Nov | 29.1 | -27.5 | 70 | 983 | Tropical Storm | - |
| 0600 UTC 28 Nov | 29.9 | -24.8 | 70 | 984 | Tropical Storm | - |
| 1200 UTC 28 Nov | 30.2 | -21.6 | 70 | 985 | Post-Tropical Cyclone | - |
| 1800 UTC 28 Nov | 30.2 | -18.2 | 70 | 986 | Post-Tropical Cyclone | - |
| 0000 UTC 29 Nov | 30.2 | -14.6 | 65 | 988 | Post-Tropical Cyclone | - |
| 0600 UTC 29 Nov | 30.7 | -10.9 | 60 | 992 | Post-Tropical Cyclone | - |
| 1200 UTC 29 Nov | 32.6 | -6.6 | 40 | 1000 | Post-Tropical Cyclone | - |
| 1800 UTC 29 Nov | 35.3 | -1.0 | 35 | 1003 | Post-Tropical Cyclone | - |
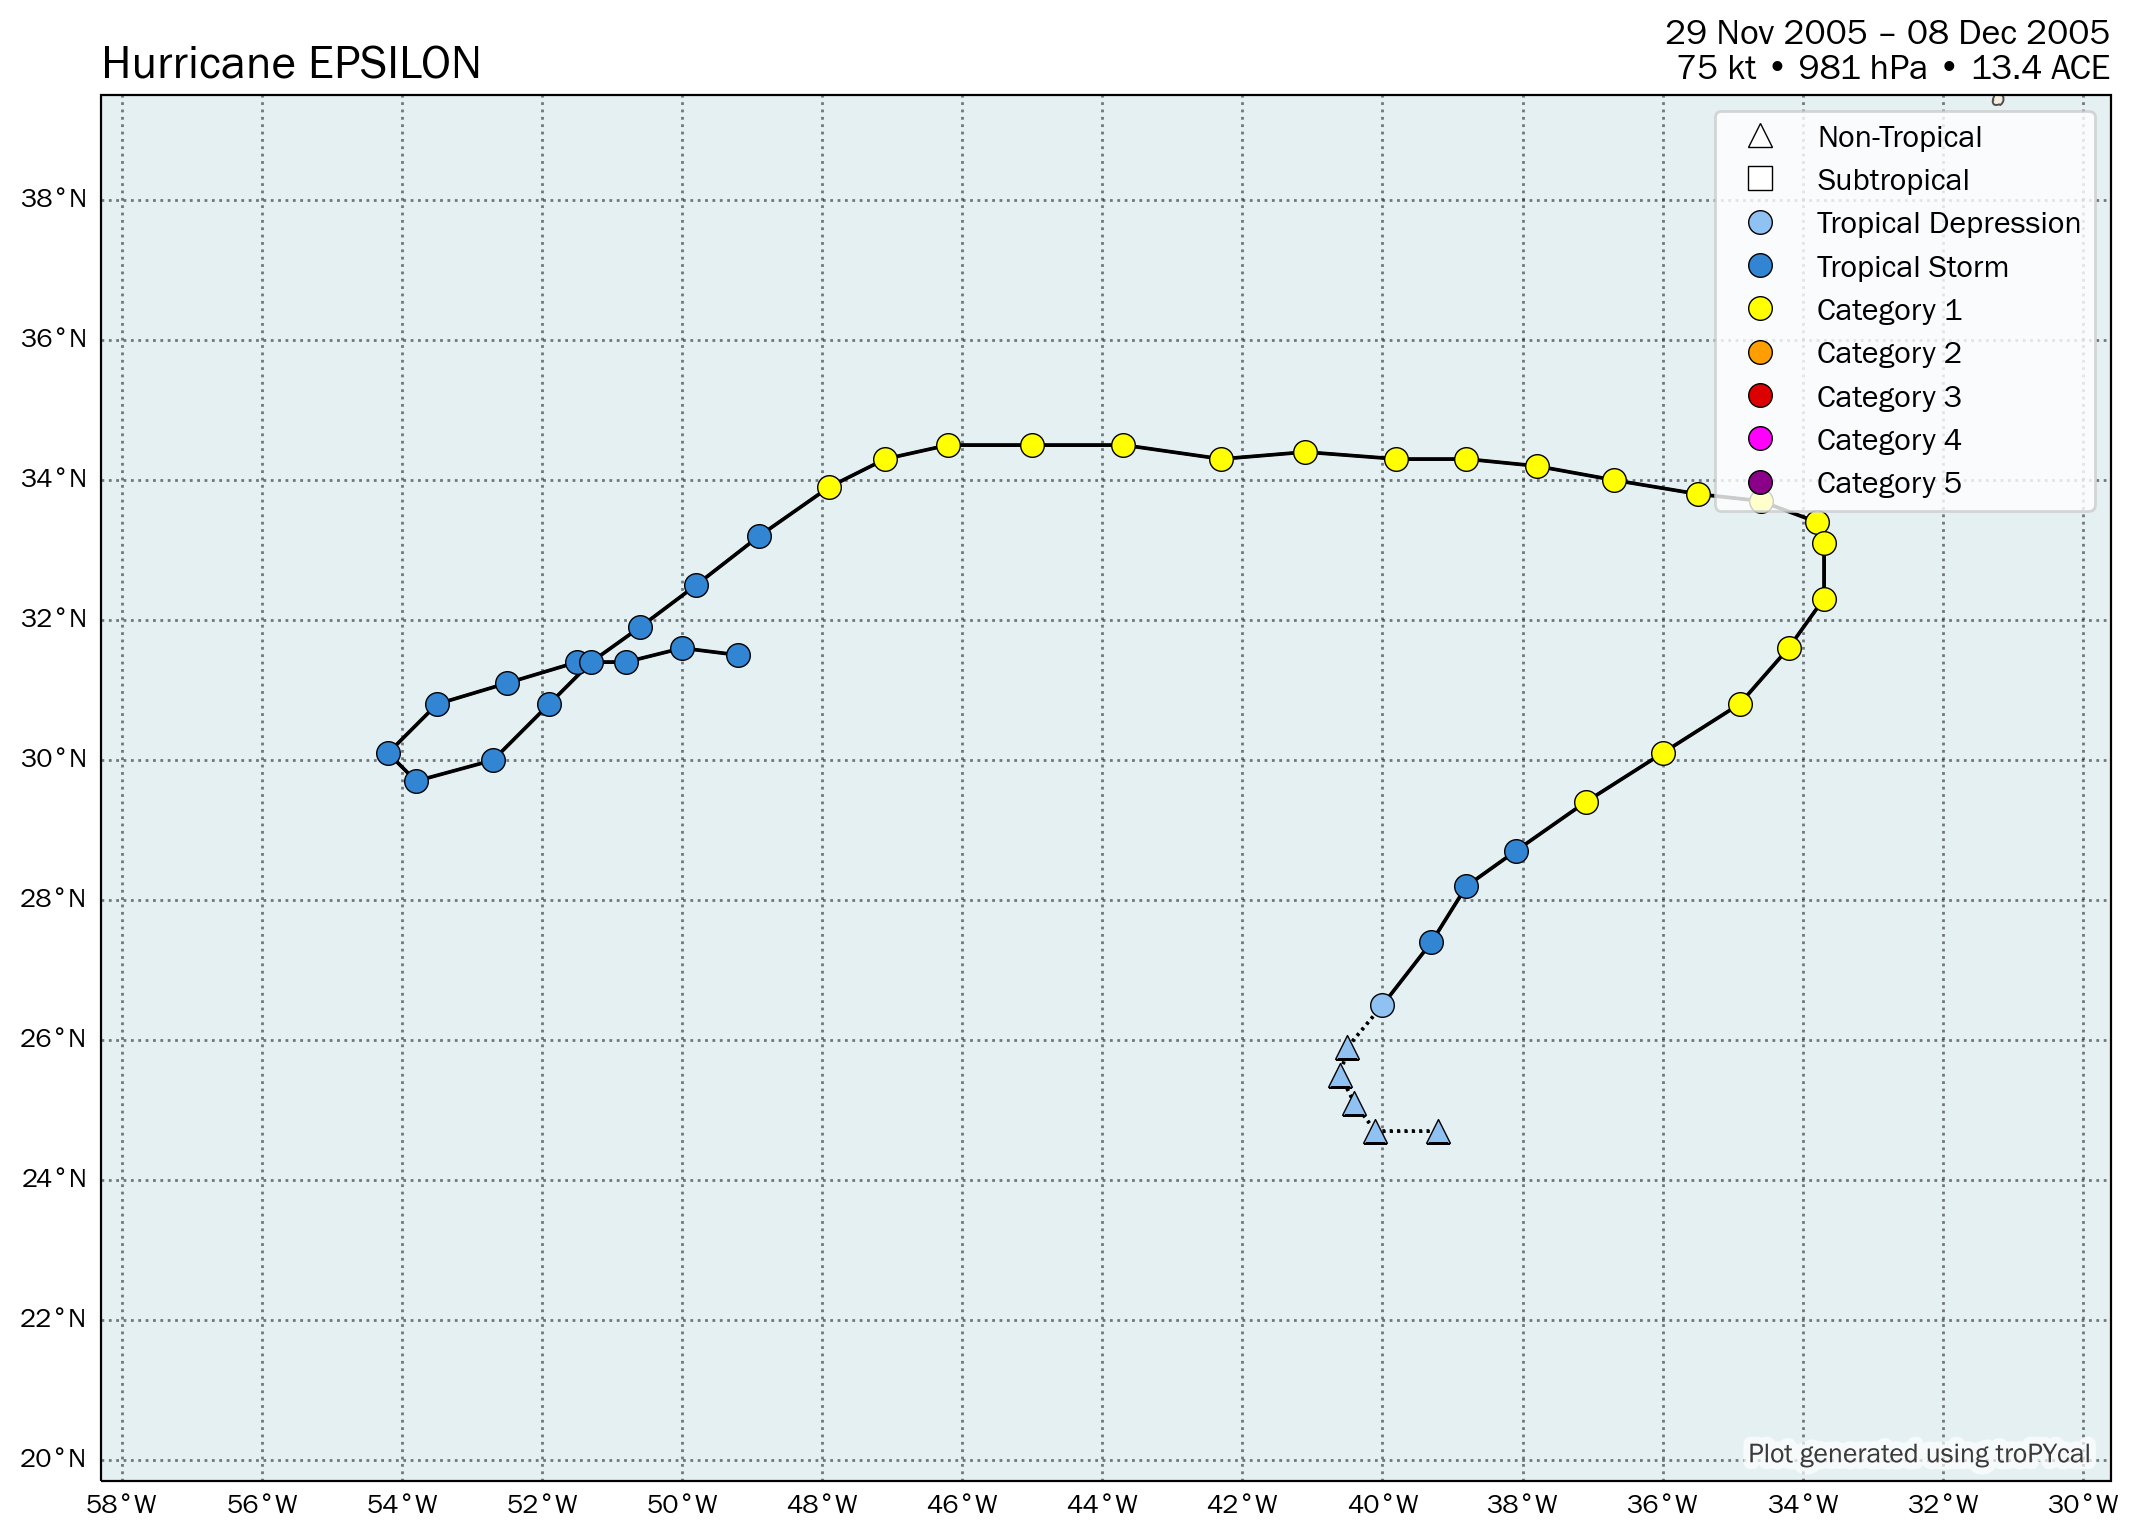
| Time (UTC) | Lat | Lon | Wind (mph) | Pressure | Storm Type | Category |
|---|---|---|---|---|---|---|
| 0600 UTC 29 Nov | 31.5 | -49.2 | 50 | 993 | Tropical Storm | - |
| 1200 UTC 29 Nov | 31.6 | -50.0 | 50 | 993 | Tropical Storm | - |
| 1800 UTC 29 Nov | 31.4 | -50.8 | 50 | 993 | Tropical Storm | - |
| 0000 UTC 30 Nov | 31.4 | -51.5 | 50 | 993 | Tropical Storm | - |
| 0600 UTC 30 Nov | 31.1 | -52.5 | 60 | 992 | Tropical Storm | - |
| 1200 UTC 30 Nov | 30.8 | -53.5 | 65 | 991 | Tropical Storm | - |
| 1800 UTC 30 Nov | 30.1 | -54.2 | 60 | 991 | Tropical Storm | - |
| 0000 UTC 01 Dec | 29.7 | -53.8 | 60 | 992 | Tropical Storm | - |
| 0600 UTC 01 Dec | 30.0 | -52.7 | 60 | 992 | Tropical Storm | - |
| 1200 UTC 01 Dec | 30.8 | -51.9 | 60 | 992 | Tropical Storm | - |
| 1800 UTC 01 Dec | 31.4 | -51.3 | 65 | 991 | Tropical Storm | - |
| 0000 UTC 02 Dec | 31.9 | -50.6 | 65 | 991 | Tropical Storm | - |
| 0600 UTC 02 Dec | 32.5 | -49.8 | 65 | 990 | Tropical Storm | - |
| 1200 UTC 02 Dec | 33.2 | -48.9 | 70 | 989 | Tropical Storm | - |
| 1800 UTC 02 Dec | 33.9 | -47.9 | 75 | 987 | Hurricane | 1 |
| 0000 UTC 03 Dec | 34.3 | -47.1 | 75 | 987 | Hurricane | 1 |
| 0600 UTC 03 Dec | 34.5 | -46.2 | 75 | 987 | Hurricane | 1 |
| 1200 UTC 03 Dec | 34.5 | -45.0 | 75 | 987 | Hurricane | 1 |
| 1800 UTC 03 Dec | 34.5 | -43.7 | 75 | 987 | Hurricane | 1 |
| 0000 UTC 04 Dec | 34.3 | -42.3 | 75 | 987 | Hurricane | 1 |
| 0600 UTC 04 Dec | 34.4 | -41.1 | 75 | 987 | Hurricane | 1 |
| 1200 UTC 04 Dec | 34.3 | -39.8 | 80 | 984 | Hurricane | 1 |
| 1800 UTC 04 Dec | 34.3 | -38.8 | 80 | 985 | Hurricane | 1 |
| 0000 UTC 05 Dec | 34.2 | -37.8 | 80 | 985 | Hurricane | 1 |
| 0600 UTC 05 Dec | 34.0 | -36.7 | 85 | 981 | Hurricane | 1 |
| 1200 UTC 05 Dec | 33.8 | -35.5 | 85 | 981 | Hurricane | 1 |
| 1800 UTC 05 Dec | 33.7 | -34.6 | 80 | 985 | Hurricane | 1 |
| 0000 UTC 06 Dec | 33.4 | -33.8 | 75 | 986 | Hurricane | 1 |
| 0600 UTC 06 Dec | 33.1 | -33.7 | 75 | 986 | Hurricane | 1 |
| 1200 UTC 06 Dec | 32.3 | -33.7 | 75 | 987 | Hurricane | 1 |
| 1800 UTC 06 Dec | 31.6 | -34.2 | 75 | 987 | Hurricane | 1 |
| 0000 UTC 07 Dec | 30.8 | -34.9 | 75 | 987 | Hurricane | 1 |
| 0600 UTC 07 Dec | 30.1 | -36.0 | 75 | 987 | Hurricane | 1 |
| 1200 UTC 07 Dec | 29.4 | -37.1 | 75 | 987 | Hurricane | 1 |
| 1800 UTC 07 Dec | 28.7 | -38.1 | 70 | 991 | Tropical Storm | - |
| 0000 UTC 08 Dec | 28.2 | -38.8 | 60 | 997 | Tropical Storm | - |
| 0600 UTC 08 Dec | 27.4 | -39.3 | 40 | 1003 | Tropical Storm | - |
| 1200 UTC 08 Dec | 26.5 | -40.0 | 35 | 1005 | Tropical Depression | - |
| 1800 UTC 08 Dec | 25.9 | -40.5 | 35 | 1006 | Remnant Low | - |
| 0000 UTC 09 Dec | 25.5 | -40.6 | 35 | 1007 | Remnant Low | - |
| 0600 UTC 09 Dec | 25.1 | -40.4 | 30 | 1008 | Remnant Low | - |
| 1200 UTC 09 Dec | 24.7 | -40.1 | 30 | 1009 | Remnant Low | - |
| 1800 UTC 09 Dec | 24.7 | -39.2 | 30 | 1009 | Remnant Low | - |
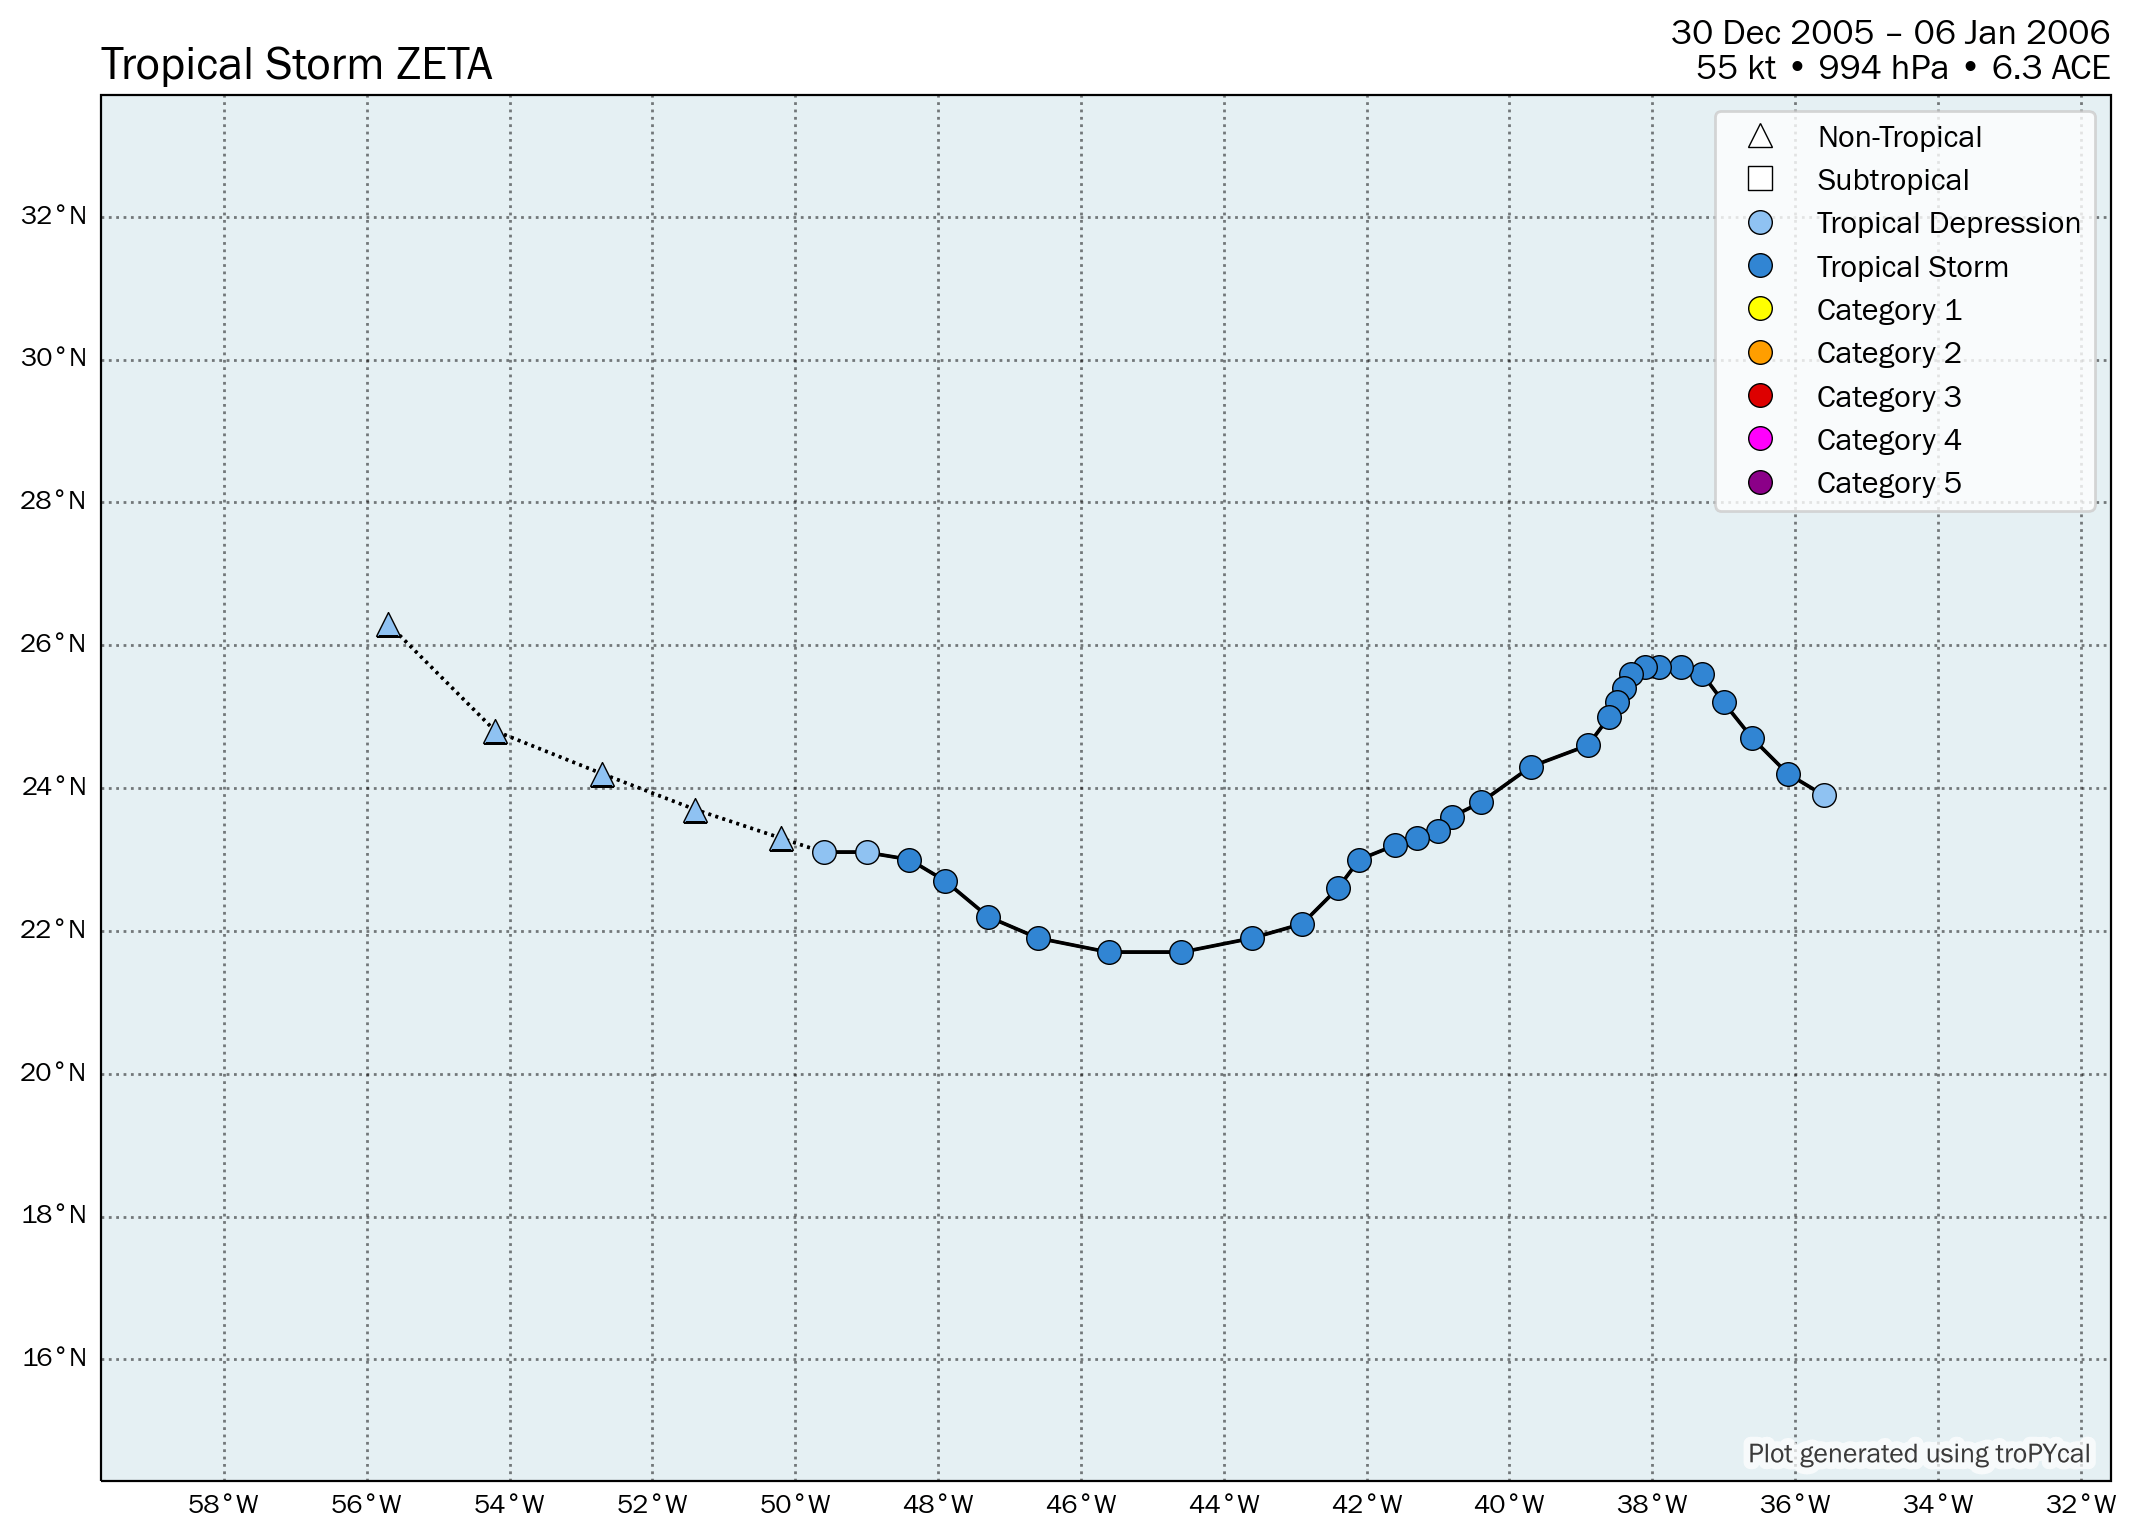
| Time (UTC) | Lat | Lon | Wind (mph) | Pressure | Storm Type | Category |
|---|---|---|---|---|---|---|
| 0000 UTC 30 Dec | 23.9 | -35.6 | 35 | 1009 | Tropical Depression | - |
| 0600 UTC 30 Dec | 24.2 | -36.1 | 45 | 1005 | Tropical Storm | - |
| 1200 UTC 30 Dec | 24.7 | -36.6 | 50 | 1002 | Tropical Storm | - |
| 1800 UTC 30 Dec | 25.2 | -37.0 | 50 | 1000 | Tropical Storm | - |
| 0000 UTC 31 Dec | 25.6 | -37.3 | 50 | 1000 | Tropical Storm | - |
| 0600 UTC 31 Dec | 25.7 | -37.6 | 60 | 997 | Tropical Storm | - |
| 1200 UTC 31 Dec | 25.7 | -37.9 | 60 | 997 | Tropical Storm | - |
| 1800 UTC 31 Dec | 25.7 | -38.1 | 50 | 1000 | Tropical Storm | - |
| 0000 UTC 01 Jan | 25.6 | -38.3 | 60 | 997 | Tropical Storm | - |
| 0600 UTC 01 Jan | 25.4 | -38.4 | 60 | 997 | Tropical Storm | - |
| 1200 UTC 01 Jan | 25.2 | -38.5 | 60 | 997 | Tropical Storm | - |
| 1800 UTC 01 Jan | 25.0 | -38.6 | 65 | 994 | Tropical Storm | - |
| 0000 UTC 02 Jan | 24.6 | -38.9 | 65 | 994 | Tropical Storm | - |
| 0600 UTC 02 Jan | 24.3 | -39.7 | 60 | 997 | Tropical Storm | - |
| 1200 UTC 02 Jan | 23.8 | -40.4 | 50 | 1000 | Tropical Storm | - |
| 1800 UTC 02 Jan | 23.6 | -40.8 | 60 | 997 | Tropical Storm | - |
| 0000 UTC 03 Jan | 23.4 | -41.0 | 65 | 994 | Tropical Storm | - |
| 0600 UTC 03 Jan | 23.3 | -41.3 | 65 | 994 | Tropical Storm | - |
| 1200 UTC 03 Jan | 23.2 | -41.6 | 65 | 994 | Tropical Storm | - |
| 1800 UTC 03 Jan | 23.0 | -42.1 | 65 | 994 | Tropical Storm | - |
| 0000 UTC 04 Jan | 22.6 | -42.4 | 65 | 994 | Tropical Storm | - |
| 0600 UTC 04 Jan | 22.1 | -42.9 | 60 | 997 | Tropical Storm | - |
| 1200 UTC 04 Jan | 21.9 | -43.6 | 50 | 1000 | Tropical Storm | - |
| 1800 UTC 04 Jan | 21.7 | -44.6 | 45 | 1002 | Tropical Storm | - |
| 0000 UTC 05 Jan | 21.7 | -45.6 | 40 | 1005 | Tropical Storm | - |
| 0600 UTC 05 Jan | 21.9 | -46.6 | 40 | 1005 | Tropical Storm | - |
| 1200 UTC 05 Jan | 22.2 | -47.3 | 40 | 1006 | Tropical Storm | - |
| 1800 UTC 05 Jan | 22.7 | -47.9 | 40 | 1007 | Tropical Storm | - |
| 0000 UTC 06 Jan | 23.0 | -48.4 | 40 | 1007 | Tropical Storm | - |
| 0600 UTC 06 Jan | 23.1 | -49.0 | 35 | 1007 | Tropical Depression | - |
| 1200 UTC 06 Jan | 23.1 | -49.6 | 35 | 1008 | Tropical Depression | - |
| 1800 UTC 06 Jan | 23.3 | -50.2 | 30 | 1009 | Remnant Low | - |
| 0000 UTC 07 Jan | 23.7 | -51.4 | 30 | 1009 | Remnant Low | - |
| 0600 UTC 07 Jan | 24.2 | -52.7 | 30 | 1012 | Remnant Low | - |
| 1200 UTC 07 Jan | 24.8 | -54.2 | 30 | 1014 | Remnant Low | - |
| 1800 UTC 07 Jan | 26.3 | -55.7 | 30 | 1016 | Remnant Low | - |