Tomer BurgPhD Student
All Archived Posts
Current Weather
Meteorology Analysis
Non-Weather Posts
January 15-16, 2024: Breaking the I-95 Snow Drought
Tomer Burg • 15 January 2024 • Current Weather

Post Highlights
This winter has been a unique one across the United States – a lot of heavy rain and wind events in the East Coast, anomalous warmth throughout much of December, a challenging forecast for an early January snowstorm that produced heavy snow in parts of the Northeast, severe weather and tornadoes in parts of the country, and as of this week, two consecutive major cyclones with blizzard conditions in the Midwest.

Two aspects have been notably missing until now: widespread cold, and snow in the major I-95 Mid Atlantic cities. The first changed this weekend as a major cold outbreak is underway across North America. The second is about to change tonight, as a minor to moderate snow event brings the first widespread snow event above 1-3 inches to the I-95 corridor in nearly two years, which this post reviews from a synoptic and mesoscale perspective.
Large Picture: Developing Greenland Block

Loop of GFS analyzed and forecast 500-hPa geopotential height anomaly (relative to CFS climatology) valid through 12 – 16 January 2024. Images courtesy of Alicia Bentley's website.

When working on a weather forecast analysis, I personally like to start off looking at the broader picture, before working our way down to the smaller scale details. For many in the Mid Atlantic region, this is the first widespread snow event of the winter; many locations in the region recorded one of their latest first measurable snow event on record on January 6-7, and locations that have yet to receive their first inch of snow that will do so tonight are also for the most part unusually late to do so.

Major ingredients that have been missing until now for a Mid Atlantic snow event are high-latitude blocking and an antecedent cold airmass. Following a minor sudden stratospheric warming (SSW) earlier this month that disrupted the lower stratospheric polar vortex, and frequent cyclonic wavebreaking events in the north Atlantic and subsequently from the recent two major Plains blizzards, a high-latitude block developed north of the United Kingdom and gradually retrograded westward until reaching North America.

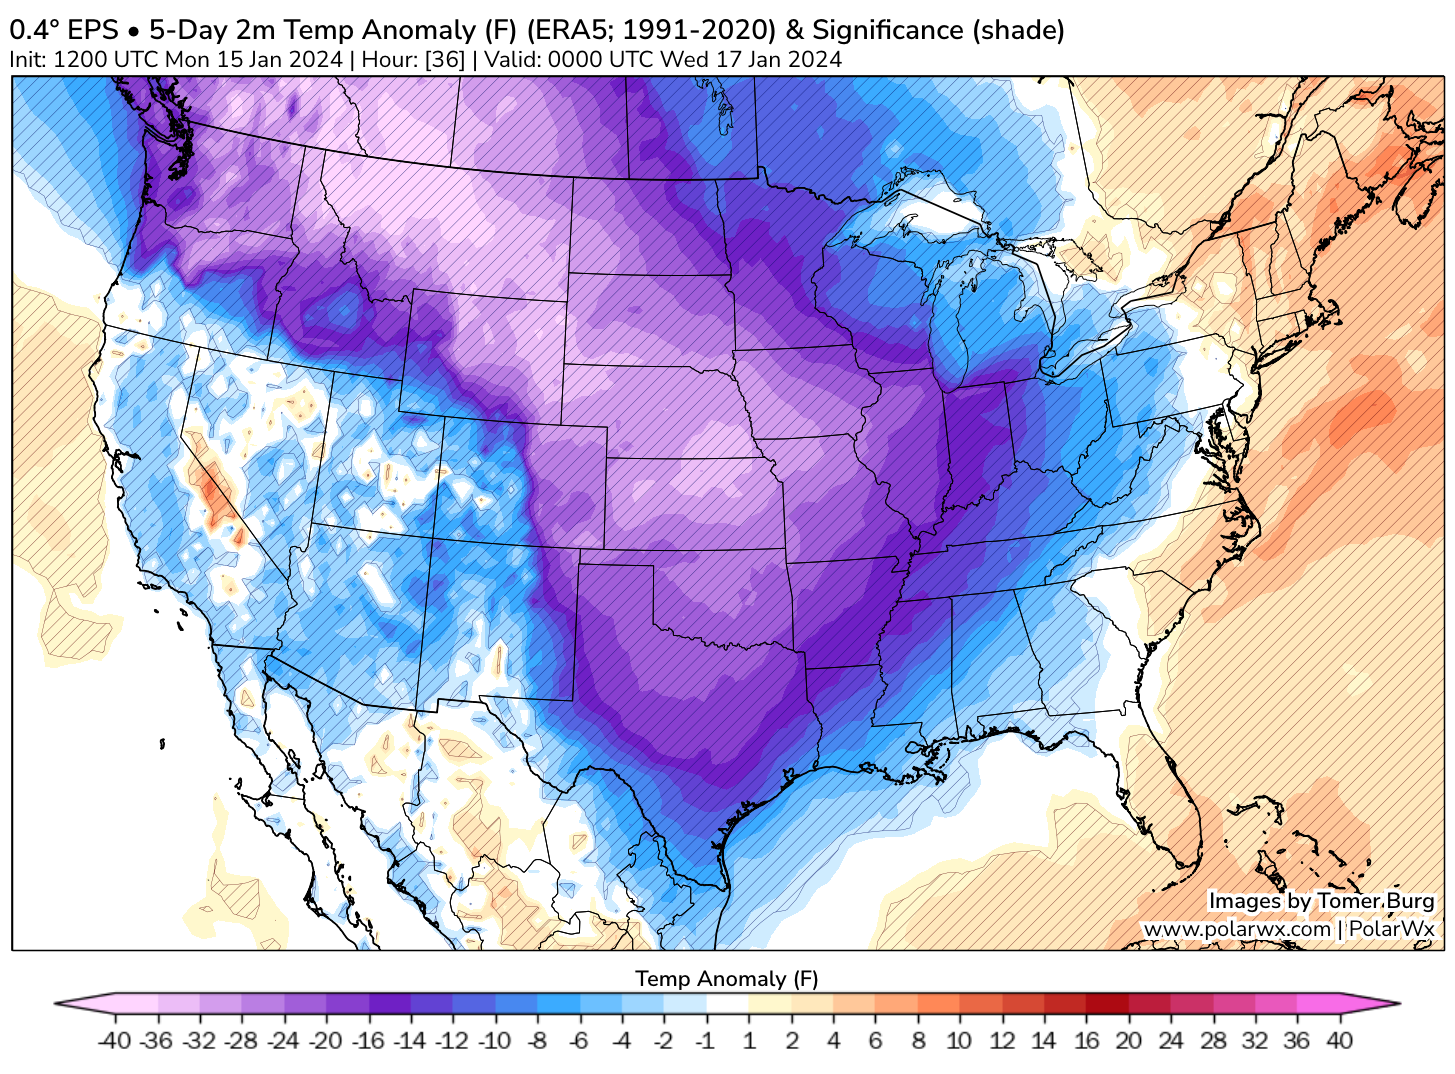
EPS analyzed 5-day averaged 2-meter temperature anomalies (°F) between 12 – 16 January 2024, relative to ERA5 1991-2020 climatology.

The combination of Greenland and Alaskan ridging displaced a lobe of the upper tropospheric polar vortex into north America, which previously had remained over Siberia throughout December, allowing cold air to finally spill southward into North America. A transient West Coast ridge in the previous loop allowed this frigid airmass now displaced over western Canada to spill southward into the United States, resulting in a major cold air outbreak. This is a classic configuration associated with Plains cold outbreaks, as documented in literature (e.g., Millin et al. (2022)).

While the core of this cold airmass was situated over the Plains, with this event approaching but not quite reaching the magnitude and falling well short of the duration of the historic February 2021 cold air outbreak, some of the cold air was advected eastward into the Northeast U.S., resulting in yesterday's snow squalls across much of the region. This established an antecedent cold airmass, which is often an important necessity for snow events down to the coast. Given a western coast ridge, high latitude block, and a cutoff low situated over the Hudson Bay, we finally have the ingredients needed for a Mid Atlantic snow event.
Overview of Model Forecast Trends

Trends in GFS forecast precipitation rate and type, 500-1000 hPa thickness, and mean sea level pressure, for model runs starting from 11 January 2024. Loop courtesy of Tropical Tidbits.

For the last few days, there was abundant uncertainty among deterministic and ensemble model guidance regarding not just snowfall amounts and location, but even whether a cyclone would develop close enough to the Northeast U.S. to produce widespread precipitation. This inconsistency is highlighted well in this loop of trends in deterministic GFS forecasts over the last few days.

Earlier GFS runs, as well as some ECMWF and CMC runs (not shown), produced a major cyclone rapidly deepening near the coast which would have produced a widespread swath of 6-12 inches of snow – or perhaps even higher – across much of the region, potentially including the I-95 corridor. Several model runs around 102-84 hour lead time – especially in the ECMWF model, and to a lesser extent in the GFS and CMC models – failed to show any precipitation across the region. However, we have since seen a short-term amplification trend among global models... but not back to the same major storm shown earlier, but towards a different configuration with a generally widespread minor-moderate snow event.

Trends in GFS forecast 500-hPa relative vorticity, for model runs starting from 11 January 2024. Loop courtesy of Tropical Tidbits.

The trend away from a major snow event can be seen cleanly in trends in forecast 500-hPa vorticity and geopotential heights. Earlier runs that had a major snowstorm across the region had a deep positively tilted trough axis with its base near Oklahoma, which subsequently rapidly became negatively tilted, resulting in widespread strong forcing for ascent and cyclogenesis across the Northeast US. Such a scenario would have led to a major snowstorm peaking early on January 17th.

An abrupt change around the 12 January forecast cycles resulted in this vorticity lobe being modeled almost completely flat and much more progressive. Accordingly, modeled vorticity advection and upper-level ageostrophic divergence was much weaker, and these model runs did not develop much if any precipitation in the region. For the sake of simplicity, I won't show the plots here, but ensemble sensitivity analysis based on operational ensembles at the time indicated a major culprit to this trend away from a major storm was a poorly modeled cutoff low north of Hawaii that ended up more progressive than forecast, resulting in less northeast Pacific ridge amplification and subsequently a less amplified downstream trough.


Loop of run-to-run change in GFS forecast 500-hPa geopotential height over the last 5 GFS cycles.

Over the last two days, however, we've seen global models trend back towards a more impactful event, but still not quite the major snowstorm previously modeled. This loop shows a major source of this trend is the vorticity maximum over Montana & Wyoming being analyzed stronger and farther southwest than previously modeled, in conjunction with higher heights over the SW Canadian Rockies, alongside a less suppressive downstream height field over the Great Lakes.

Going back to the previous loop of 500-hPa vorticity trends, we can see this short-term trend manifest as a more amplified and slower shortwave trough, but with the trough base now over Indiana. Recall that runs that had a major I-95/Northeast snowstorm had the trough base much farther south and west. This explains why this short-term amplification trend is primarily favoring the interior Northeast – especially northeastern parts of the region towards Maine – for the highest snow totals, as the trough only forces rapid cyclogenesis once the surface cyclone is already exiting the region near Maine, as opposed to earlier model cycles when this was modeled to occur near the Mid Atlantic.

Trend in GEFS forecast 48-hour positive snow depth change (inches), with an in-house method to reduce sleet and freezing rain contribution based on post-processed model precipitation types.

Typically, when there is such large inconsistency among deterministic models, a good approach to use is to rely on ensembles as they offer a much broader look at possible outcomes that a single deterministic run alone cannot reveal. Ensembles are in part a necessity given uncertainty in observations that are ingested into models – for example, uncertainty, biases and errors in standard instruments such as thermometers, radiosondes, etc. – and locations with sparse or no in-situ data observations.

A common issue with ensembles, however, is under-dispersiveness – that is, when an ensemble shows too little spread, such that verification often occurs outside of the ensemble distribution. This is a known issue with the GEFS ensembles, and is evident in this loop of trend in ensemble probability for an inch or more of snow. Earlier runs had widespread probabilities over an inch – as well as over 30-40% chances of widespread snow totals over 6 inches of snow (not shown here) – but by the 0600 UTC 13 January cycle (78-90 hour lead time), probability of over an inch of snow was down to only 15% in NYC and 10% in Albany, NY, locations that are now conclusively expected to receive over an inch of snow.

Another issue with the ensembles we currently have is that as they are run on the global scale, they are subject to the same biases as global models in resolving mesoscale details, and in this case mesoscale models (e.g., NAM, RGEM), while too amplified at their longest lead times, did correctly identify the short-term ampliifcation trend. Accordingly, even as it became clear from higher resolution guidance that a more widespread snow event would occur, global ensembles were too slow to catch up, and probability products based on them (e.g., NBM and WPC snow guidance) were too low for interior areas and favored the highest accumulations too far southeast near the I-95 corridor.
Storm Round 1: Warm Air Advection

(Left) Modeled simulated reflectivity and 500-hPa relative vorticity tonight, (middle) Quasi-geostrophic forcing for ascent via differential cyclonic vorticity advection, and (right) overall QG forcing for ascent. Images on the right courtesy of Tom Galarneau's QG Diagnostics.

This snow event can be primarily broken down into two rounds. The first round is tonight through tomorrow morning, with widespread light to moderate snow spreading across the region. The image on the left shows a combination of simulated reflectivity and 500-hPa relative vorticity from NOAA's experimental RRFS-A model valid tonight. Note how the upper-level trough is still far off to the west, over Missouri at the time, despite there being widespread snow over the Mid Atlantic.

We can use the quasi-geostrophic (QG) omega equations to look at contributions to forcing for ascent and precipitation. There are several forms of the QG-omega equation; one of them is the traditional form, which generally has contribution for ascent from two terms:
  • Differential geostrophic vorticity advection by the geostrophic wind: Differences in vorticity advection between levels, typically between 500-hPa and 900-hPa. Positive values (red) indicate that differential cyclonic vorticity advection (DCVA) is contributing to forcing for ascent.
  • Laplacian of temperature advection by the geostrophic wind: While generally a noisy field, this is generally maximized where temperature advection, typically computed on the 700-hPa isobaric level, is maximized. Positive values indicate warm air advection is contributing to forcing for ascent.
The middle panel shows that as expected, given that the trough overnight is still located well to the west of the region, vorticity advection is not a primary contributor to precipitation. The panel on the right uses another simpler form of QG-omega (Sutcliffe-Trenberth), which is simplified to geostrophic vorticity advection by the thermal wind. This clearly does show forcing for ascent across the region, in line with where we expect it to be given the expected snow in the Mid Atlantic.

850-hPa temperature advection (fill), temperatures (°C, blue contours), and frontogenesis (purple contours), valid from 7pm EST tonight to 7am EST tomorrow morning.

The loop above shows that the precipitation tonight is predominantly forced by widespread warm air advection across the region. This warm air advection is forecast to be generally broad in nature, without much of a concentrated axis, and accordingly frontogenesis is likely to remain fairly low. In addition to isentropic advection, or positive pressure advection on constant potential temperature surfaces, this suggests precipitation tonight will be mainly in the form of widespread light to moderate snow across the Mid Atlantic and southern New England regions. While predicting snow bands is always a challenge, this does not appear to be particularly favorable of any single intense snow band, though if one were to materialize, there would be a potential for locally enhanced snow totals especially during the mid-overnight hours when low-level flow is oriented more parallel to the precipitation axis.

HRRR forecast Skew-T profile valid at 1am EST tonight.

Now that we know the expected evolution for tonight, let's look into what snowfall amounts may be. Given the generally weak synoptic forcing and lack of exceptionally strong warm air advection and frontogenesis, precipitation rates are generally expected to be light to moderate. When considering snow accumulations, a wild card is snow to liquid ratios (SLR), which the standard method used is 10:1 (that is, 1 inch of liquid-equivalent precipitation translates to 10 inches of snow) but in reality varies widely across regions and even for the same location throughout an event.

An important consideration is the dendritic growth layer, roughly the region between -12°C to -20°C, which is most conducive for dendritic growth when it is fairly deep and saturated with ascent throughout the layer, and favors ratios above 10:1 assuming surface temperatures are cold enough for it to accumulate efficiently and without too much wind. A sample model sounding from tonight's round shows weak ascent through the lower troposphere with a saturated DGZ, likely favoring ratios above 10:1 with this round of precipitation for much of the region. Given the antecedent cold airmass, this will be cold enough to produce accumulating snow even including coastal locations.
Storm Round 2: Rapid Cyclogenesis

Modeled simulated reflectivity (green shading), 500-hPa vorticity (red shading), 500-hPa geopotential height (gray contours), and mean sea level pressure below 1008 hPa (black contours), from 6am through 8pm EST tomorrow. Images from the RRFS-A experimental model.

The second round of the event occurs tomorrow during the day, as the trough moves into the region and transitions from a positive (southwest to northeast) to neutral (south to north) tilt. This results in greater differential cyclonic vorticity advection across the region, and stronger forcing for ascent. Accordingly, we see precipitation start to quickly blossom across New York state and all of the interior Northeast, and a surface low begins to deepen off the New Jersey coast. This surface low eventually deepens rapidly as it reaches Maine, as a positive feedback cycle between the surface cyclone and upper-level vorticity results in rapid cyclogenesis which continues beyond the cyclone's departure from the region.

850-hPa temperature advection (fill), temperatures (°C, blue contours), and frontogenesis (purple contours), valid from 5am through 10pm EST tomorrow.

As the low-level cyclone begins to deepen with decreasing central minimum pressure, a classic phase of a cyclone's maturing stage includes a strengthening pressure gradient and accordingly stronger low-level wind downstream of the cyclone. This results in strengthening warm air advection and a tightened pressure gradient, and accordingly we see strengthening mid-level frontogenesis axis developing over northeast PA and progressing northeast. This will have several implications, but I'll start off with precipitation types near I-95 first.

While it may sound odd to some, Washington DC may be the only city in the major Northeast I-95 corridor to avoid a substantial period of ice and rain. As the cyclogenesis stage is delayed until it passes DC to the east, precipitation will still be ongoing towards Philadelphia and northeast as mid-level warm air advection strengthens. This will lead to temperatures aloft rising above freezing, and eventually at the surface as well, leading to a transition to freezing rain/sleet and eventually rain tomorrow morning into the afternoon. While many I-95 locations will break their longstanding snow drought, they won't be breaking it by a substantial amount and still won't avoid the dreaded precipitation type changeover.

HRRR forecast cross-section of frontogenesis (purple contour), ascent (blue shading), and the dendritic growth zone highlighted in between the red dotted lines. Image from Tropical Tidbits.

The other consequence of the strengthened mid-level warm air advection and frontogenesis is the anticipated development of a snow band, as strong mid-level frontogensis is documented in literature to be associated with intense snow bands (e.g., Novak et al. (2010), Kenyon et al. (2020)). Even to this day, high-resolution convection allowing models struggle to accurately resolve these bands, if at all, and such bands are often a major contributing factor to short-term snow forecast busts, both in magnitude and location. Snow totals are locally enhanced beneath these snow bands, with subsidence outside of these bands leading to poorer snow growth and lower SLRs.

Modeled cross sections for tomorrow over Upstate NY appear conducive for a snow band to develop, with sloped frontogensis and strong ascent maximized just below the dendritic growth zone. From modeled frontogensis structures, this band may develop near northeast PA and/or central New York, likely near or northwest of Albany, evolving to a pivoting snow band with a pivot axis potentially towards the Adirondacks into northern Vermont and northern Maine. The exact location is still uncertain and can change, especially if the upper-level trough evolves differently than forecast as I'll discuss next.
Observations and Forecasts

MRMS observed reflectivity mosaic (green shading), RRFS 500-hPa vorticity (red shading) and 500-hPa geopotential height (gray contours), valid at 5pm EST this afternoon.

An part of short-term forecasting is to compare current observations to models, but keeping in mind caveats such as systematic differences in datasets. Comparing radiosondes to model geopotential heights is a risk, as not only are individual radiosondes subject to different biases and errors, but even different models initialize geopotential heights differently with systematic differences throughout the grid. Looking at observed reflectivity, so far the precipitation is mostly evolving as modeled, except for more vigorous precipitation over Kentucky and Ohio than modeled. Another notable difference is over Kansas and Missouri, where observed radar reflectivity downstream of the vorticity maximum is stronger than all short-range CAMs depicted.

Even now, the vorticity maximum still appears to be nudging slightly more amplified and slower than modeled just a few runs ago. The very latest HRRR cycles continue slowly adjusting towards a slightly slower and more amplified cyclone than earlier cycles, which would shift the heaviest snow axis farther inland.

Forecast snow map for tonight into tomorrow's storm.

Given all of these considerations, including mesoscale and synoptic forcing, potential for snow banding, and SLRs being above 10:1 for many throughout the event, I made an attempt at a forecast snow map for this event. This tries to factor in tonight's warm air advection driven snowfall, snow banding potential tomorrow, and higher SLRs.

This map of course won't be even close to the exact snow totals for every location; especially when it comes to snow banding, the exact location and intensity of a snow band is a challenge to forecast accurately until it is already occurring. However, I attempted to at least delineate the general areas of snow and potential enhancement due to higher ratios and snow banding, as well as where sleet/freezing rain and rain will limit snow accumulations tomorrow.
Share this post: