Tropical Storm Fiona Today: Disorganized and Sheared
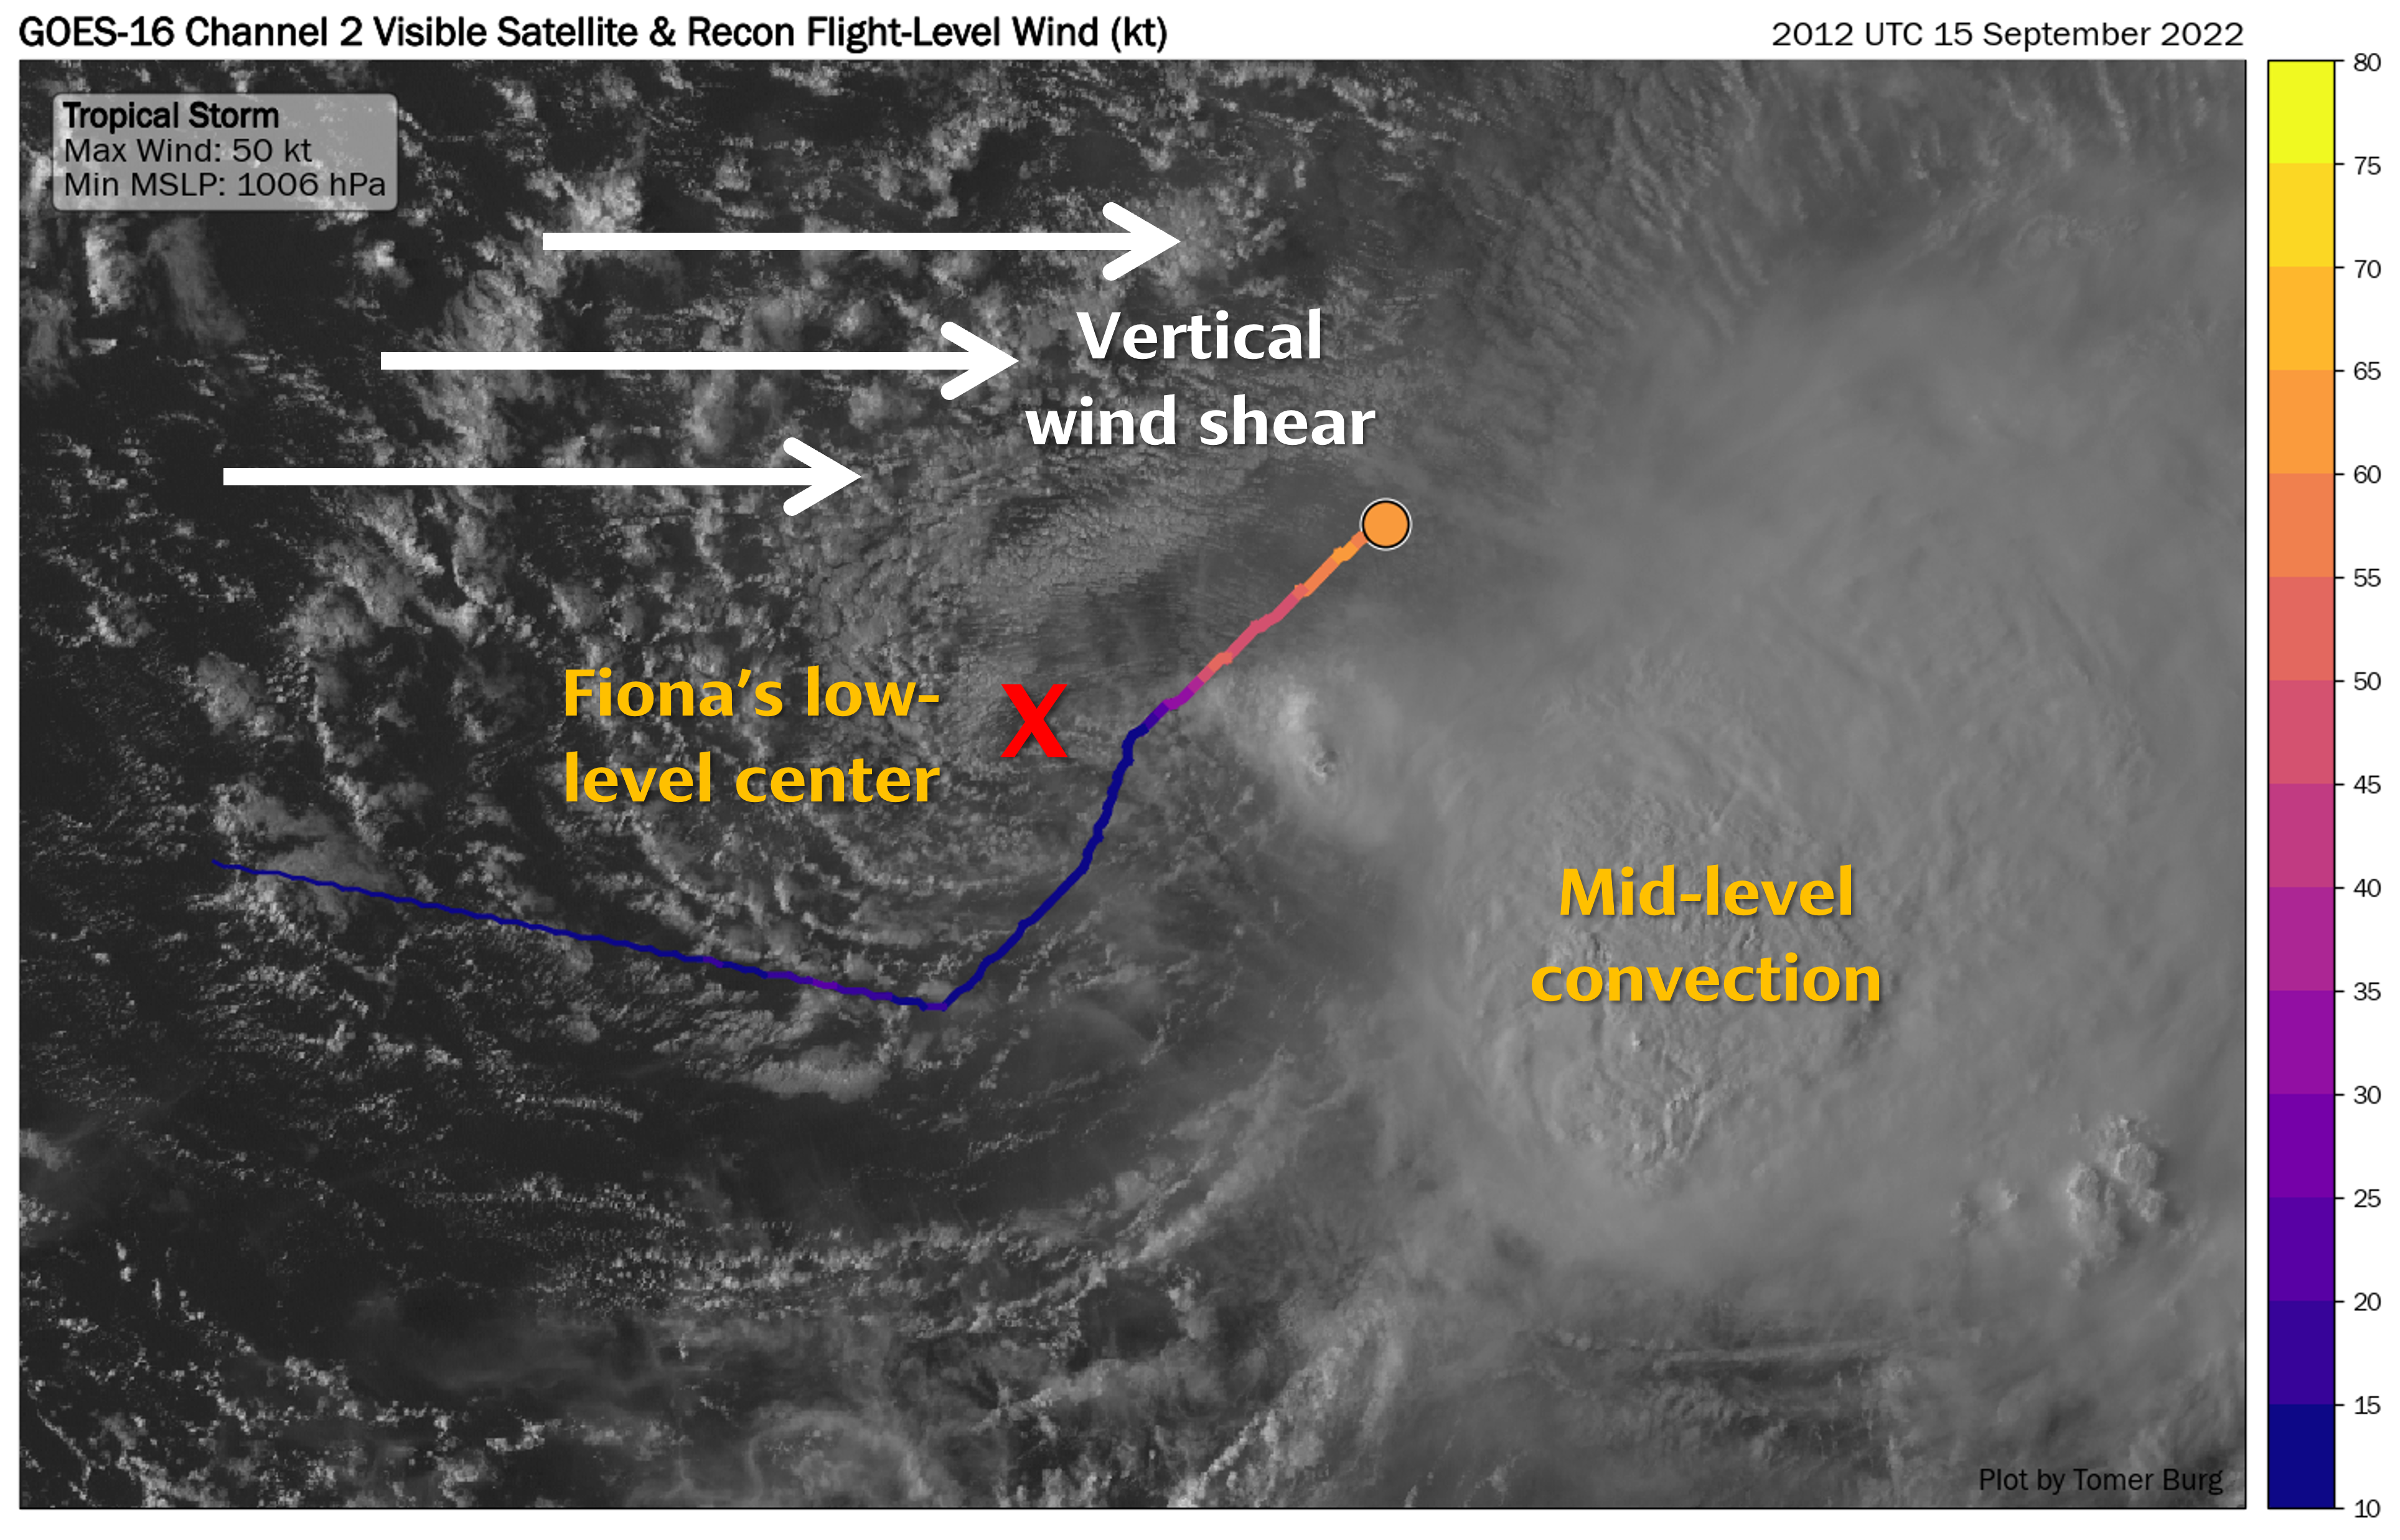 Visible satellite centered over Fiona this afternoon, with aircraft reconnaissance observations in the colored line, and other annotations added for illustrative purposes.
The image above shows visible satellite imagery from the GOES-16 satellite earlier this afternoon, when an aircraft reconnaissance flight from the U.S. Air Force flew into Fiona to observe the inner structure of the storm. You may be wondering – why do we need planes to fly into tropical cyclones when we have plenty of ways to observe tropical cyclones, largely from multiple satellites? While this is true, these are not in-situ observations, meaning they are not being recorded directly within the storm. For storms that are far away from land, intensity is estimated using satellite data, though these estimates can be somewhat inaccurate at times. The hurricane hunters provide much more detailed observations of the storm's inner structure, which not only assist forecasters at the National Hurricane Center, but are also entered into weather forecast models which can help improve the model's representation of the storm's structure, and accordingly improve its forecast.
Looking at the image above, we see that Fiona is a disorganized storm, with an exposed low-level circulation displaced west of the deep convection to its east. While maximum sustained winds are above 50-60 mph, these are not uniform around the storm – notice how winds are much weaker south of Fiona's center than to the north. Along with the overall disorganized structure, this suggests Fiona is still far from becoming a hurricane at the moment.
 Water vapor satellite imagery, with vertical wind shear (knots) in contours. Image from CIMSS.
Stronger wind shear (generally 20 knots or higher) is typically detrimental to tropical cyclone intensification, especially after a tropical cyclone has formed. This is not always the case – some tropical cyclones do intensify in spite of deep-layer vertical wind shear, which is a more complex subject and is still an area of ongoing research. For this case, however, the wind shear is aiding to prevent more substantial intensification in the short term.
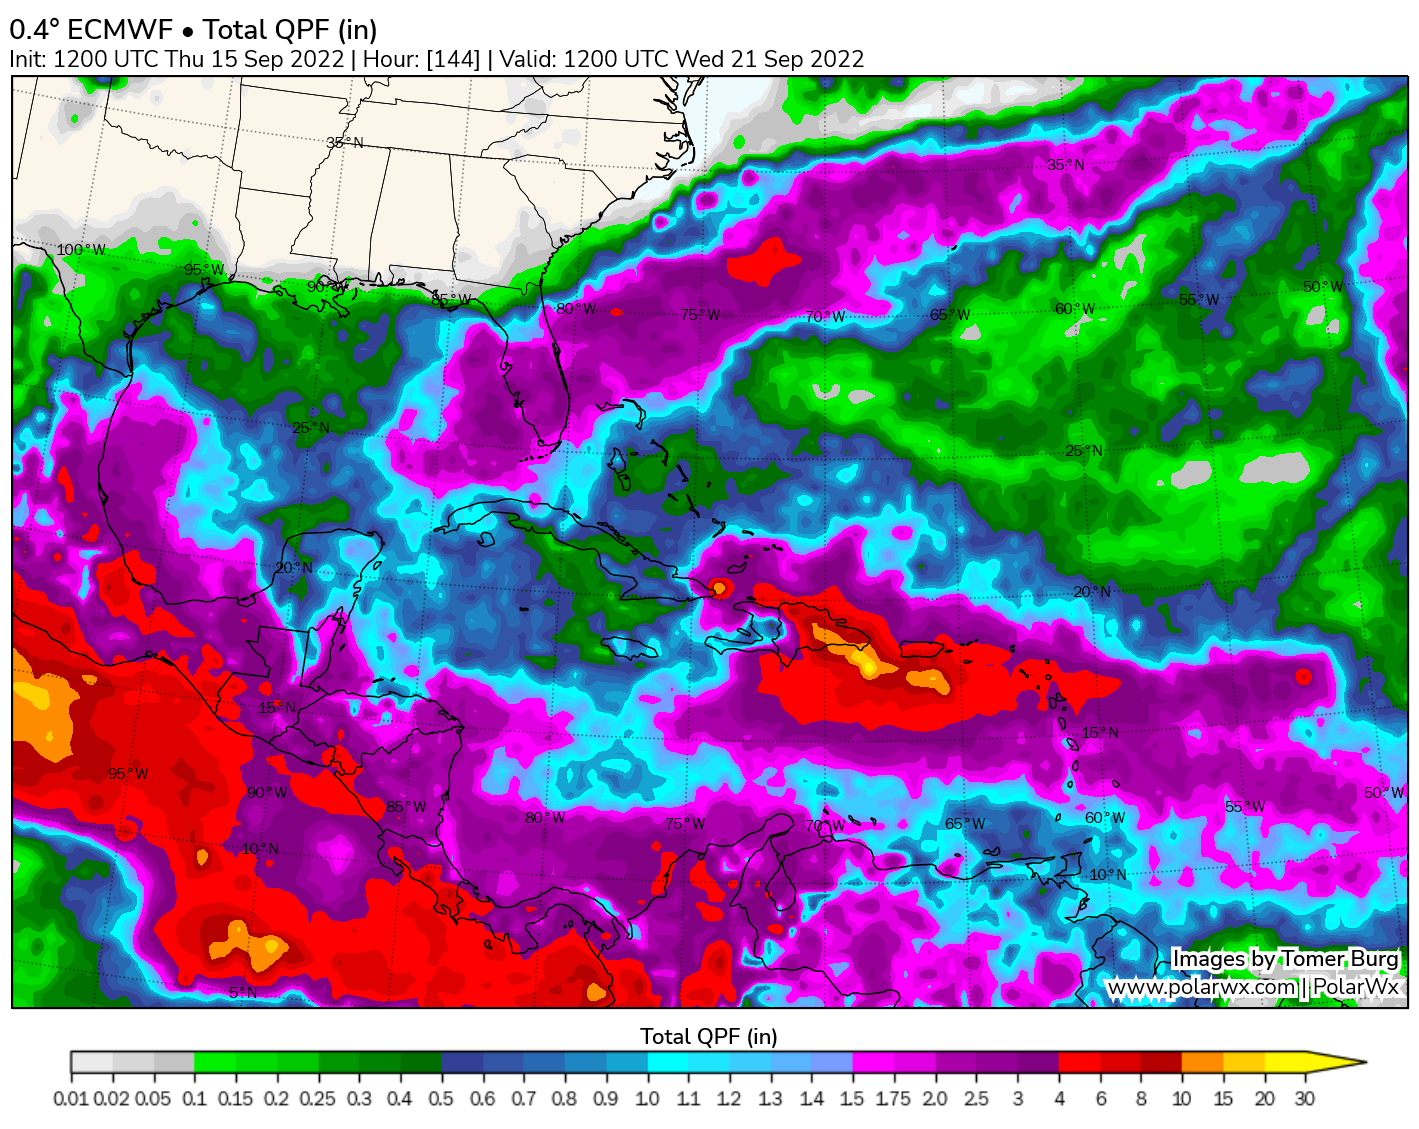 ECMWF model forecast total rainfall (inches) over the next 6 days.
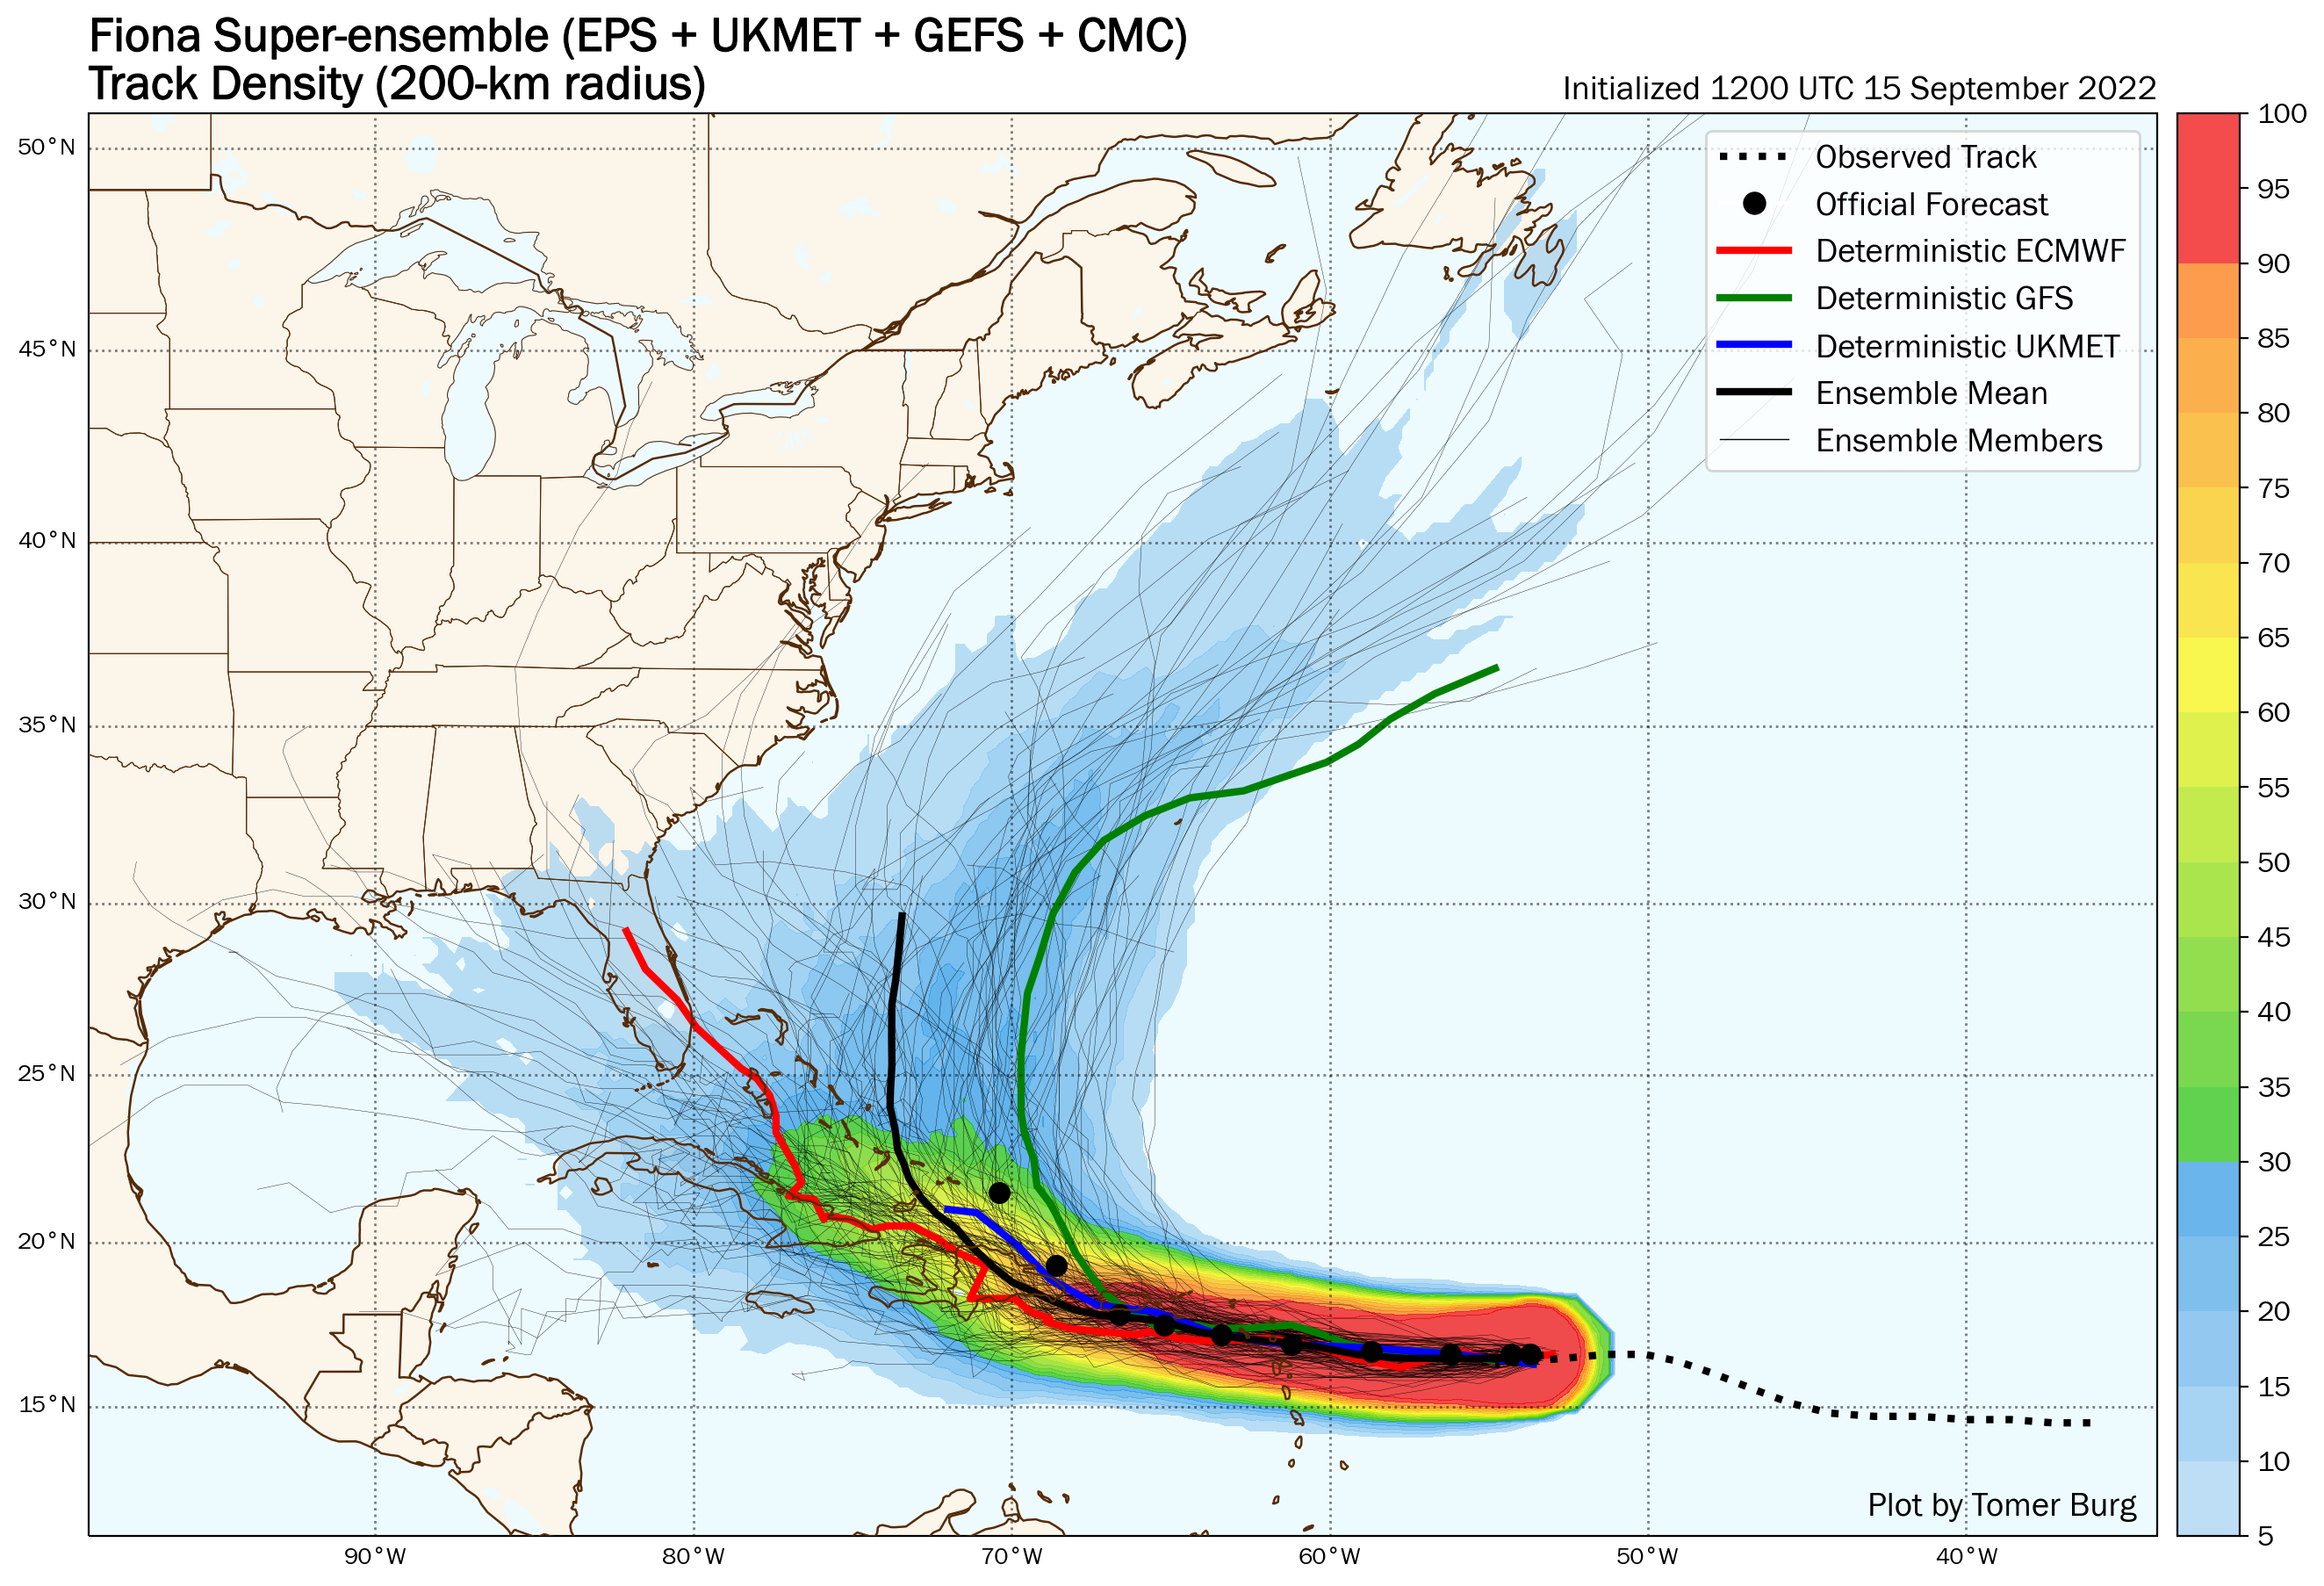 Forecast track density for a 139-member multi-model ensemble.
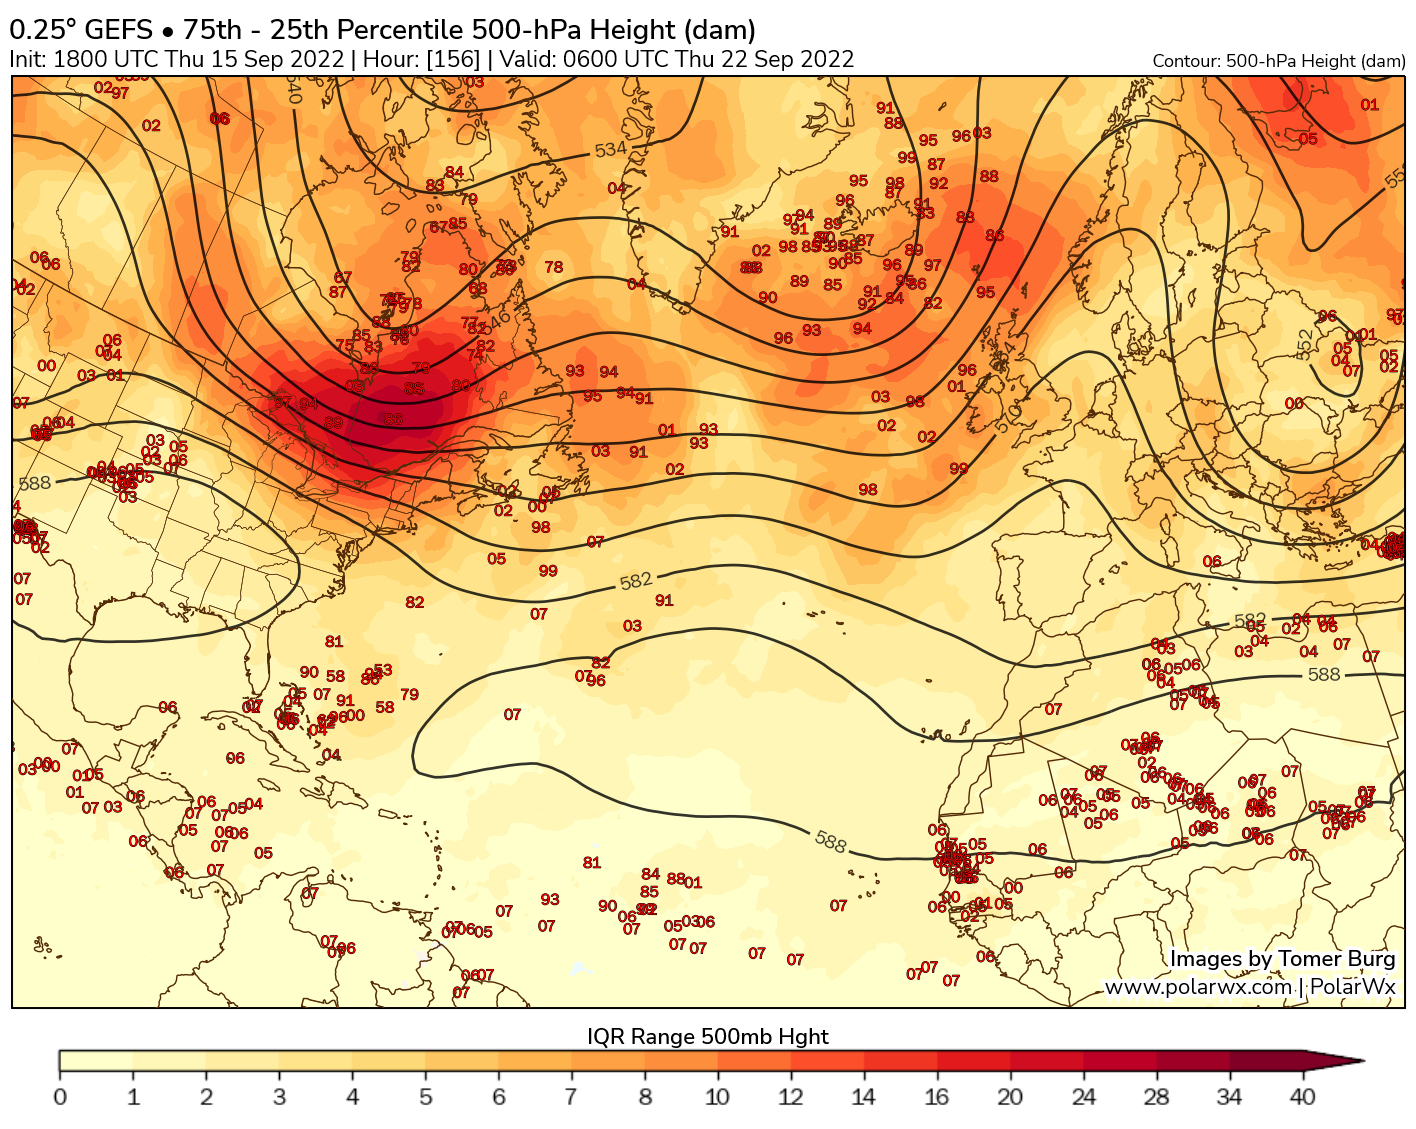 1800 UTC GEFS 500-hPa geopotential height spread and ensemble surface low positions.
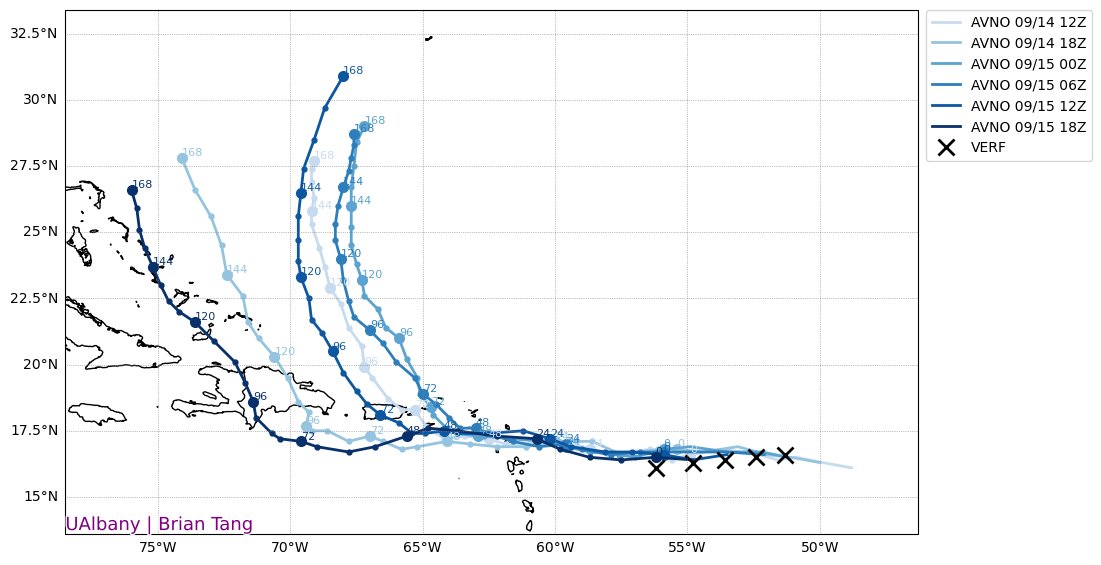 Trend in GFS forecast tracks for Fiona over the last several runs. Image courtesy of Brian Tang's website.
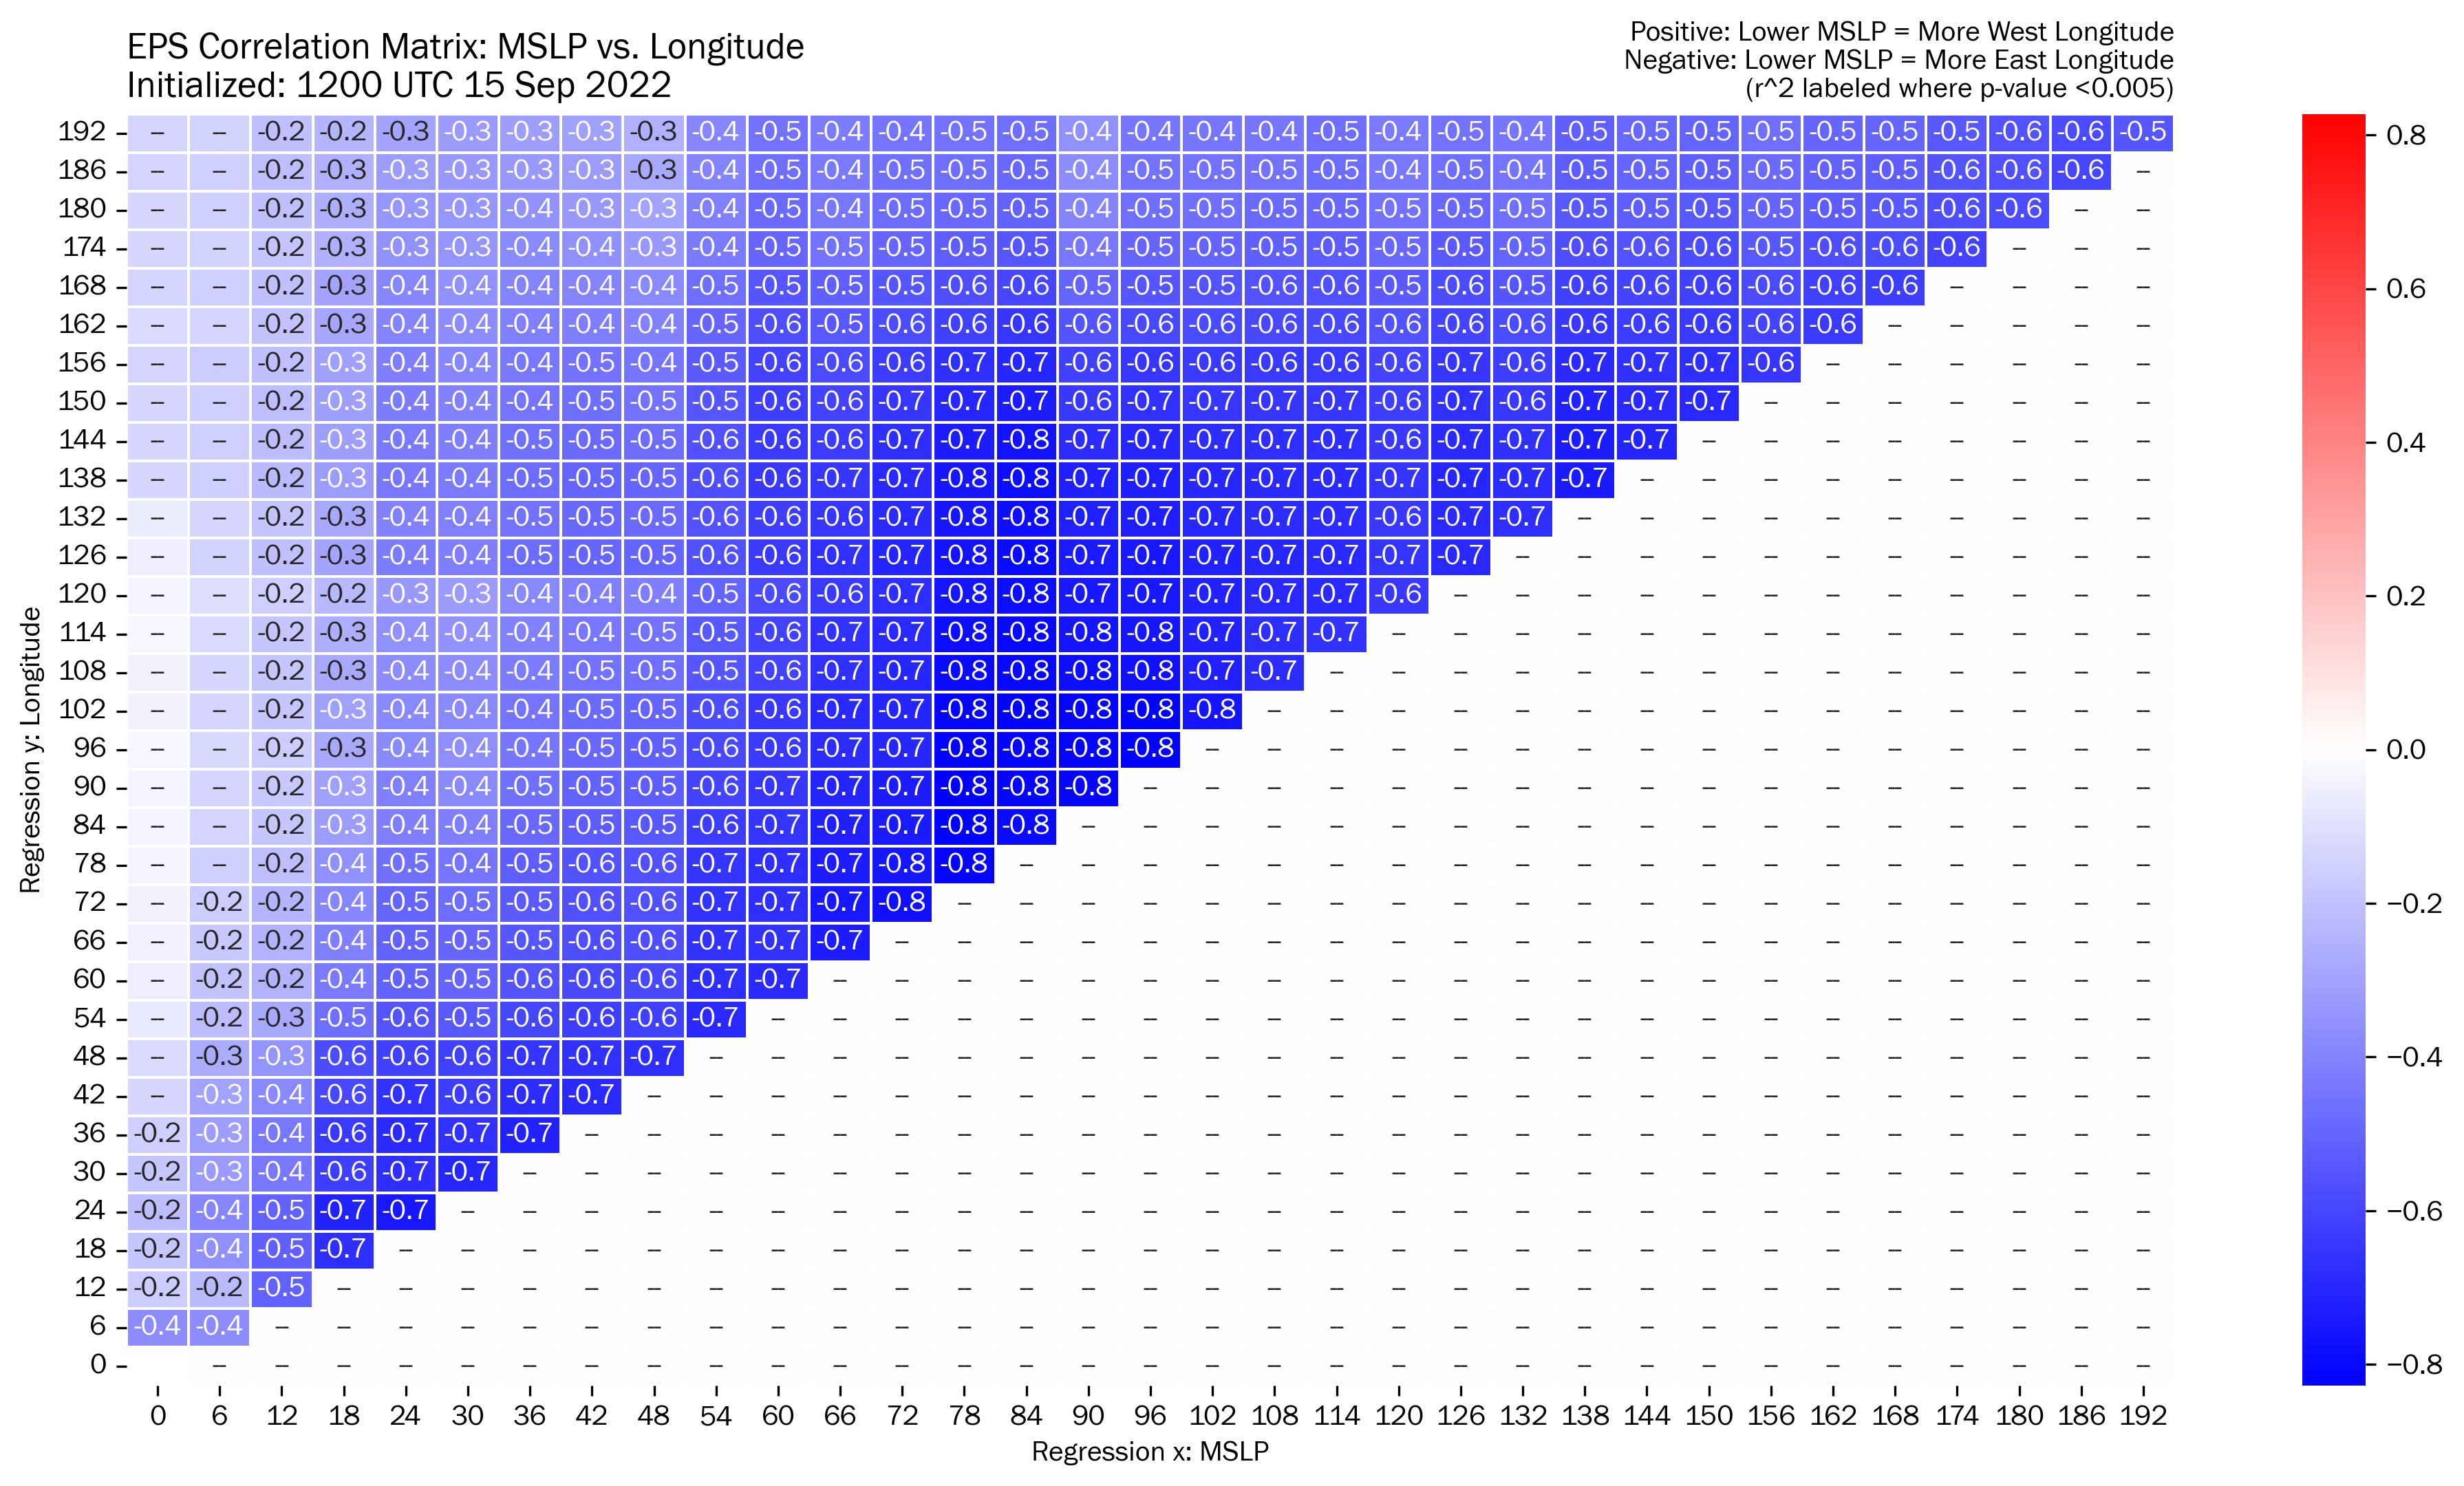 EPS ensemble correlation matrix for Fiona's forecast. Read below for an explanation of this plot.
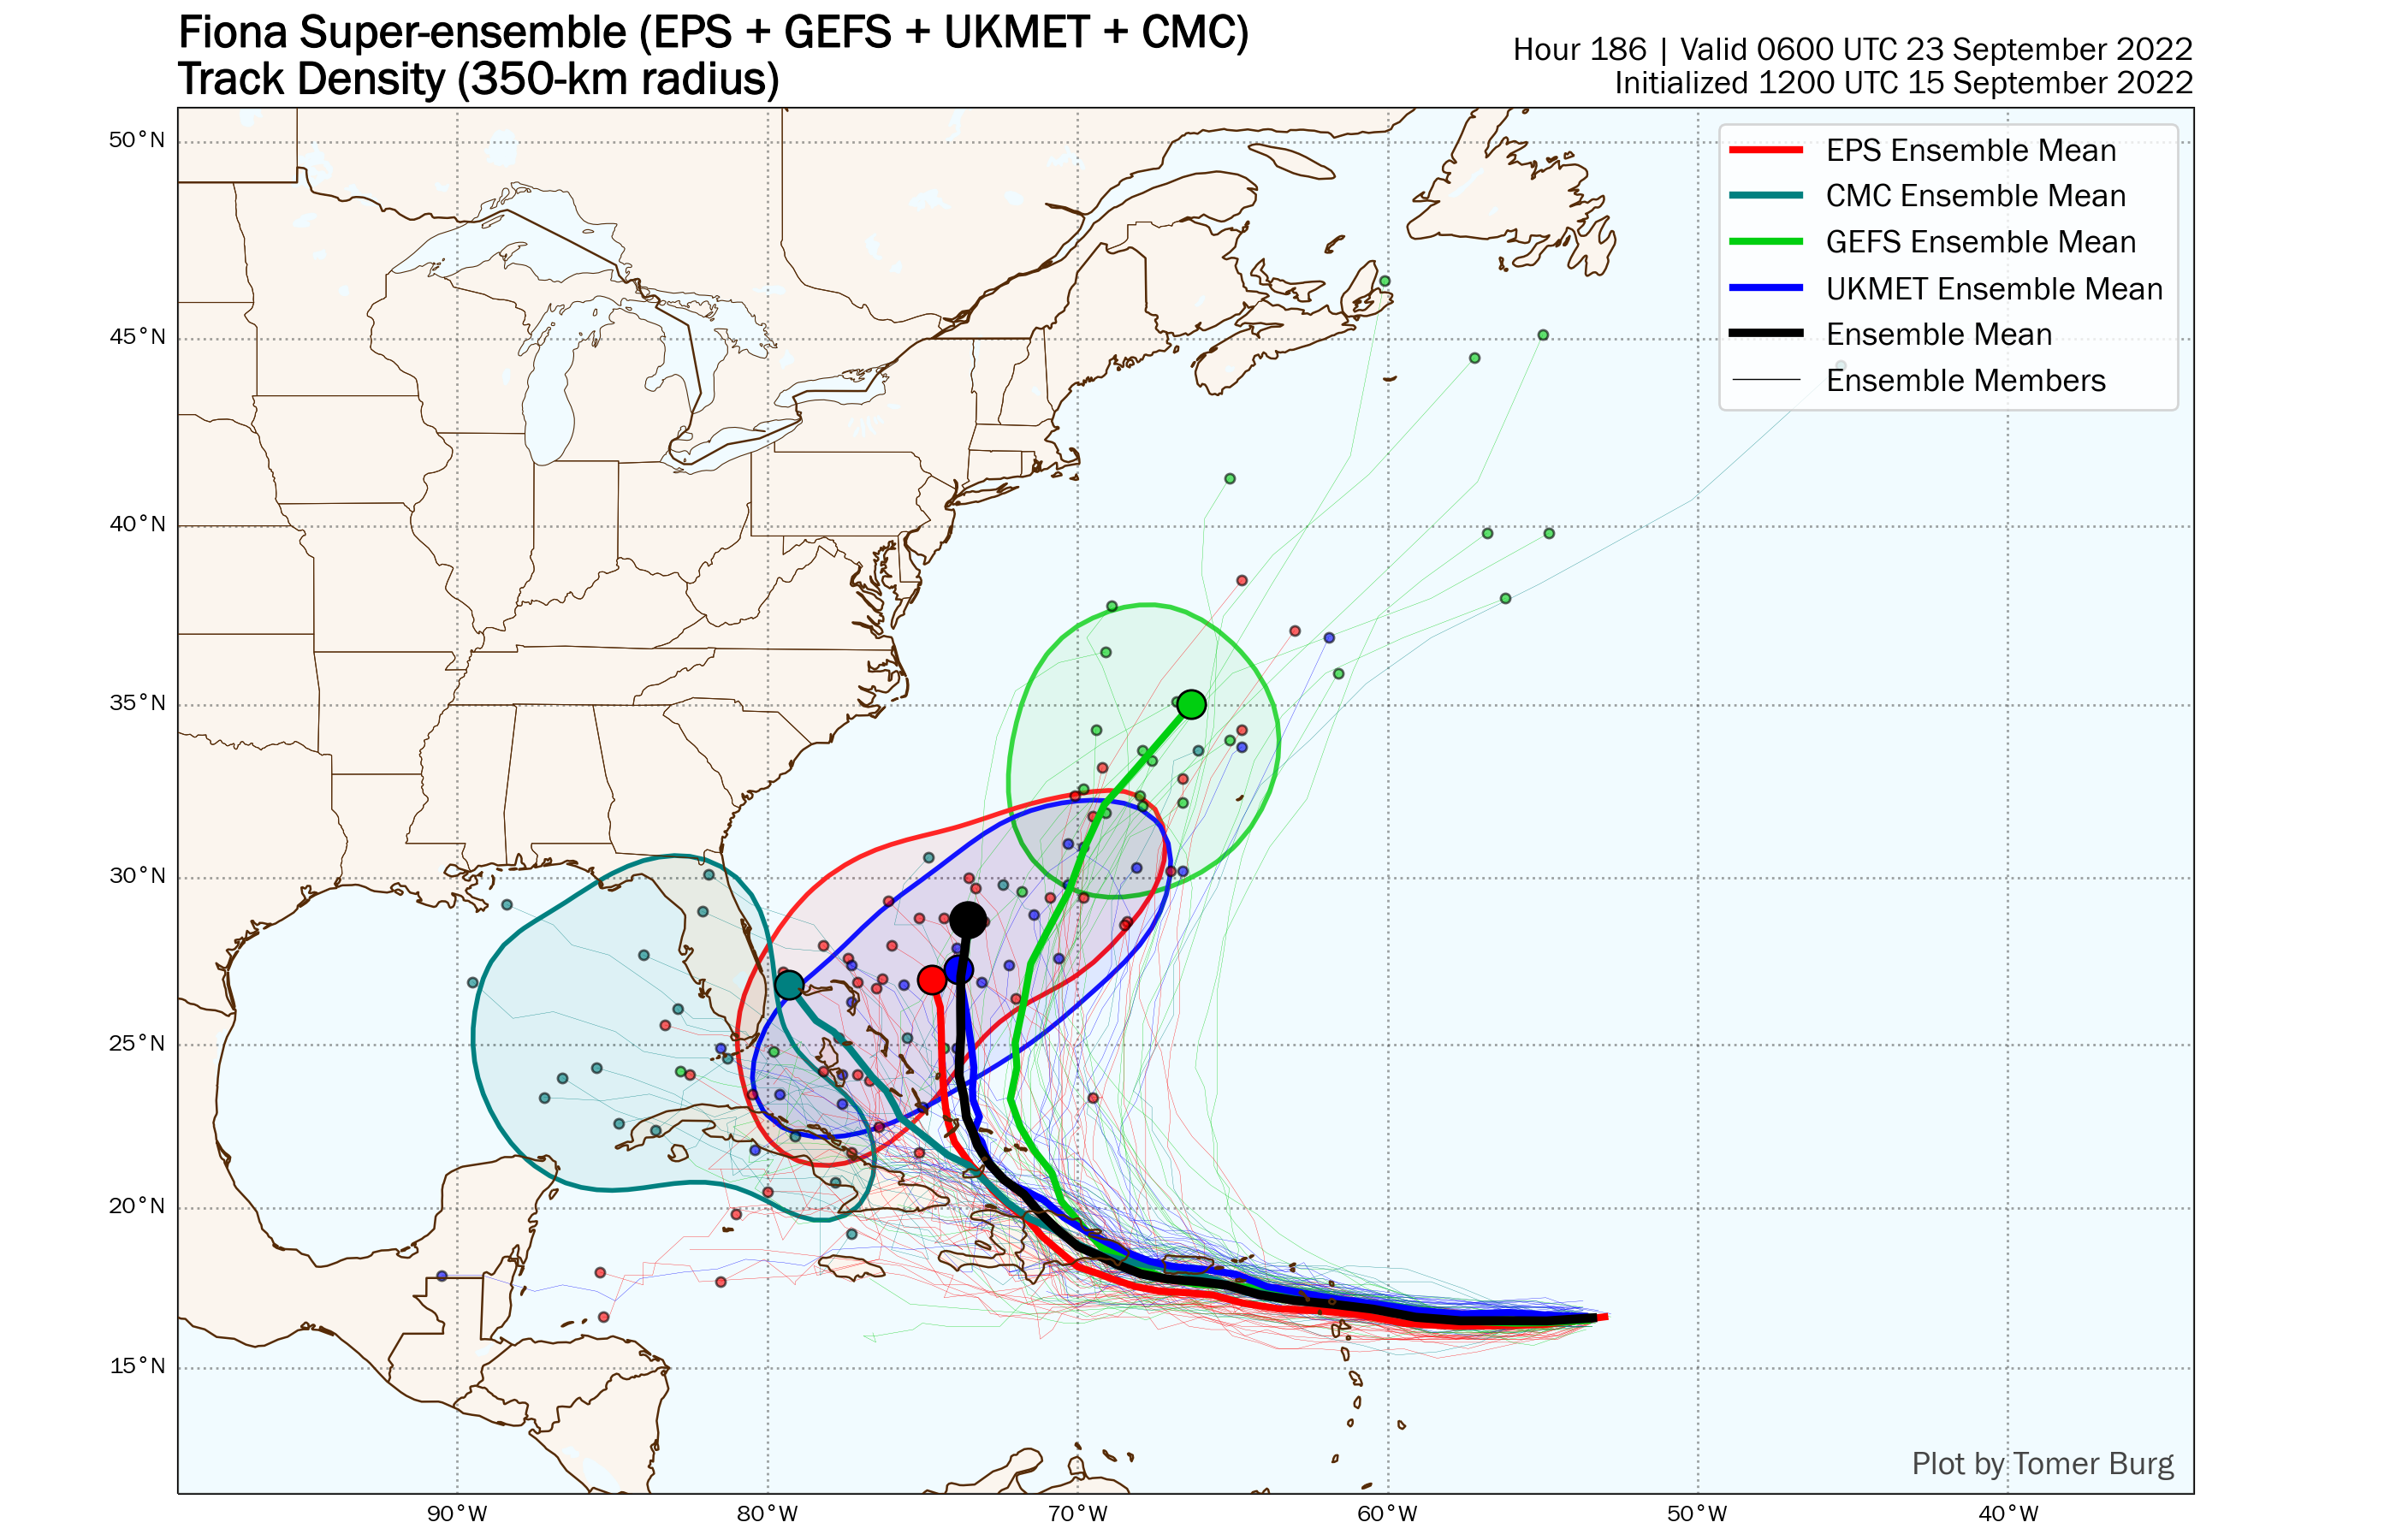 Comparison of different ensemble means, valid early on September 23rd.