Tomer BurgPhD
All Archived Posts
Current Weather
Meteorology Analysis
Non-Weather Posts
Tropopause Polar Vortex and the Late March Cool-Down
Tomer Burg • 28 March 2022 • Analysis

Post Highlights
While glancing at the forecast for the upcoming stretch of anomalous cold weather in the Northeast U.S., I noticed that while low-level temperatures are forecast to be near record cold for this time of year, upper-level temperatures are actually forecast to be near record warmth!

This may seem counter-intuitive at a first glance, but it ended up being related to a Tropopause Polar Vortex (TPV) forecast to move directly over the Northeast. A further look into this TPV showed a surprisingly interesting forecast uncertainty case where the TPV resulted in colder temperatures than previously forecast.
Temperature Percentile Ranks
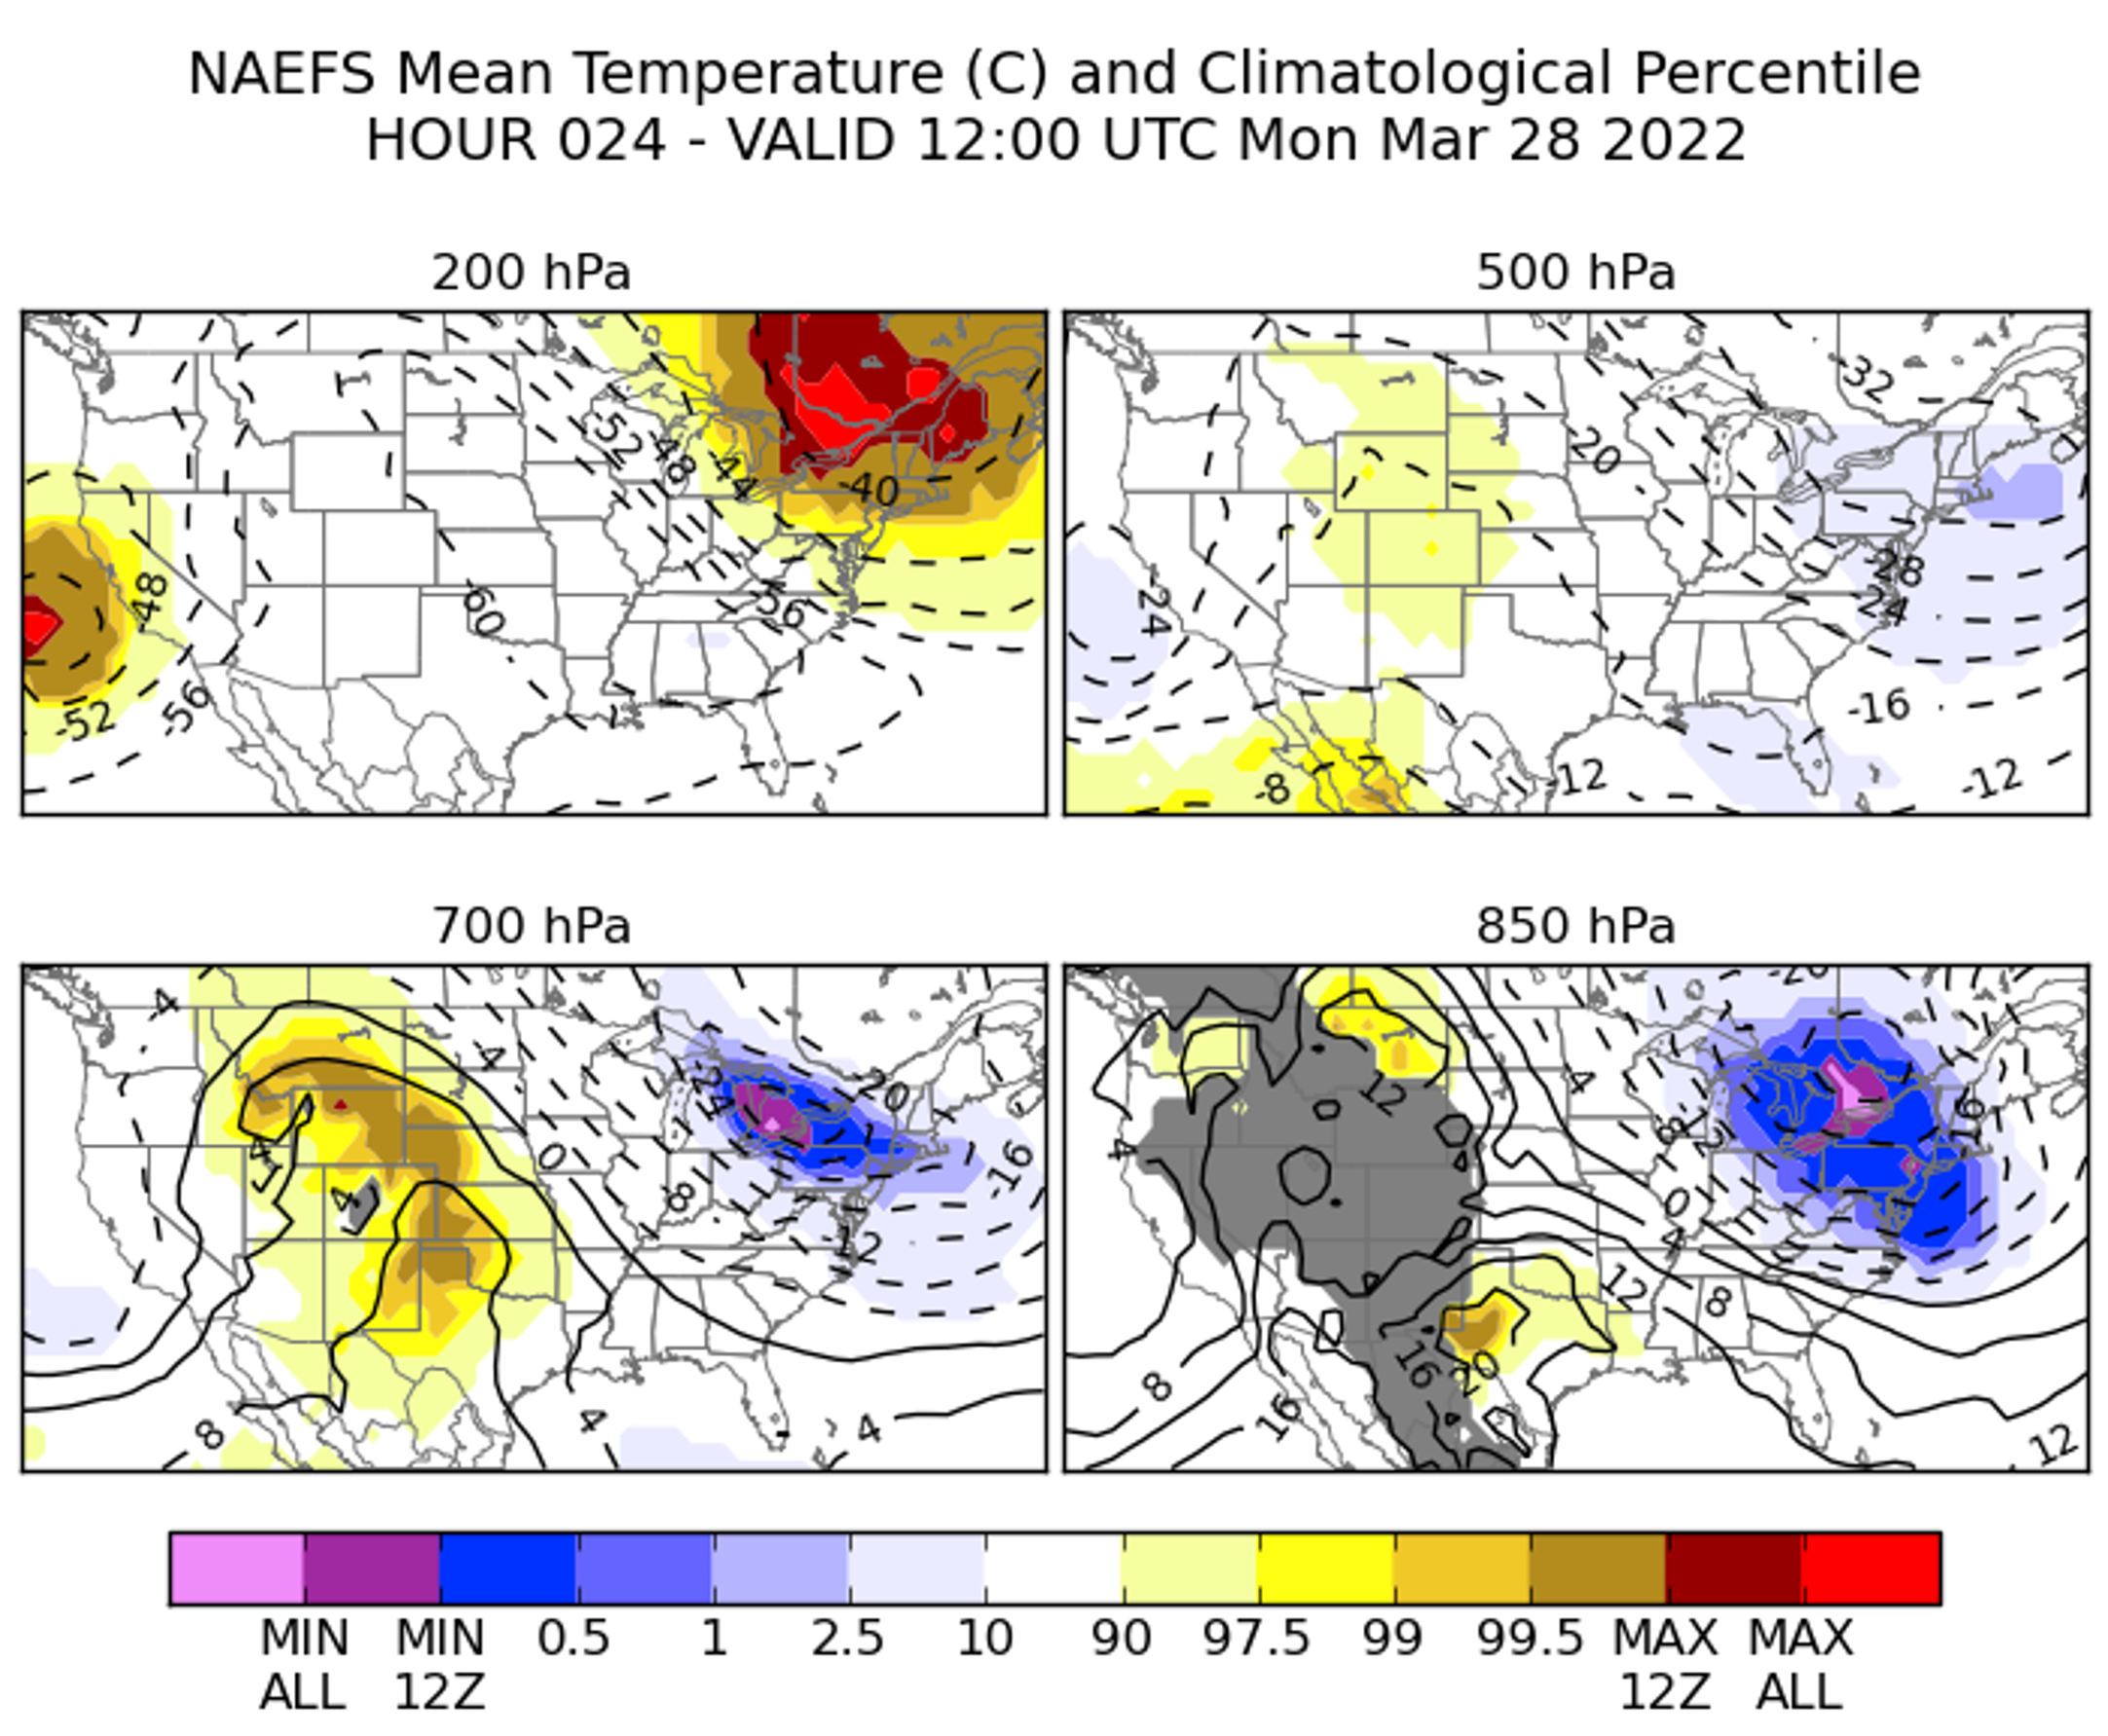
NAEFS forecast temperature percentile rank, courtesy of the NWS Situational Awareness Table.
While lamenting the return of anomalously cold weather to the Northeast U.S. after what has otherwise been a spectacularly mild stretch of weather, I was curious to check how unusual this upcoming cold air mass is. The NWS Situational Awareness Table is a great tool for this, including forecast temperature percentile ranks at multiple pressure levels.

There are numerous ways to assess just how anomalous a forecast weather variable (e.g., temperature, wind, height) is relative to climatology, each with its pros and cons. While I'll write up a more detailed analysis of this in a future blog post, for the purposes of this post, I generally like to look at percentile ranks, meaning where the forecast variable per gridpoint ranks with respect to a 3-week centered climatology at that gridpoint. This tells us how unusual the forecast is, and whether it's outside of climatological bounds.

It should be noted that this doesn't necessarily imply record cold; since the climatology used here is the CFSR reanalysis dating back to 1979, "min" and "max" simply imply the forecast variable is outside of climatological bounds using a 1979-2009 climatology. Unsurprisingly, temperatures at 850-hPa and 700-hPa are near the outer bounds of climatology for this time of year. Interestingly, however, the 200-hPa temperatures over the same locations are very anomalously warm!
Tropopause Polar Vortex Characteristics
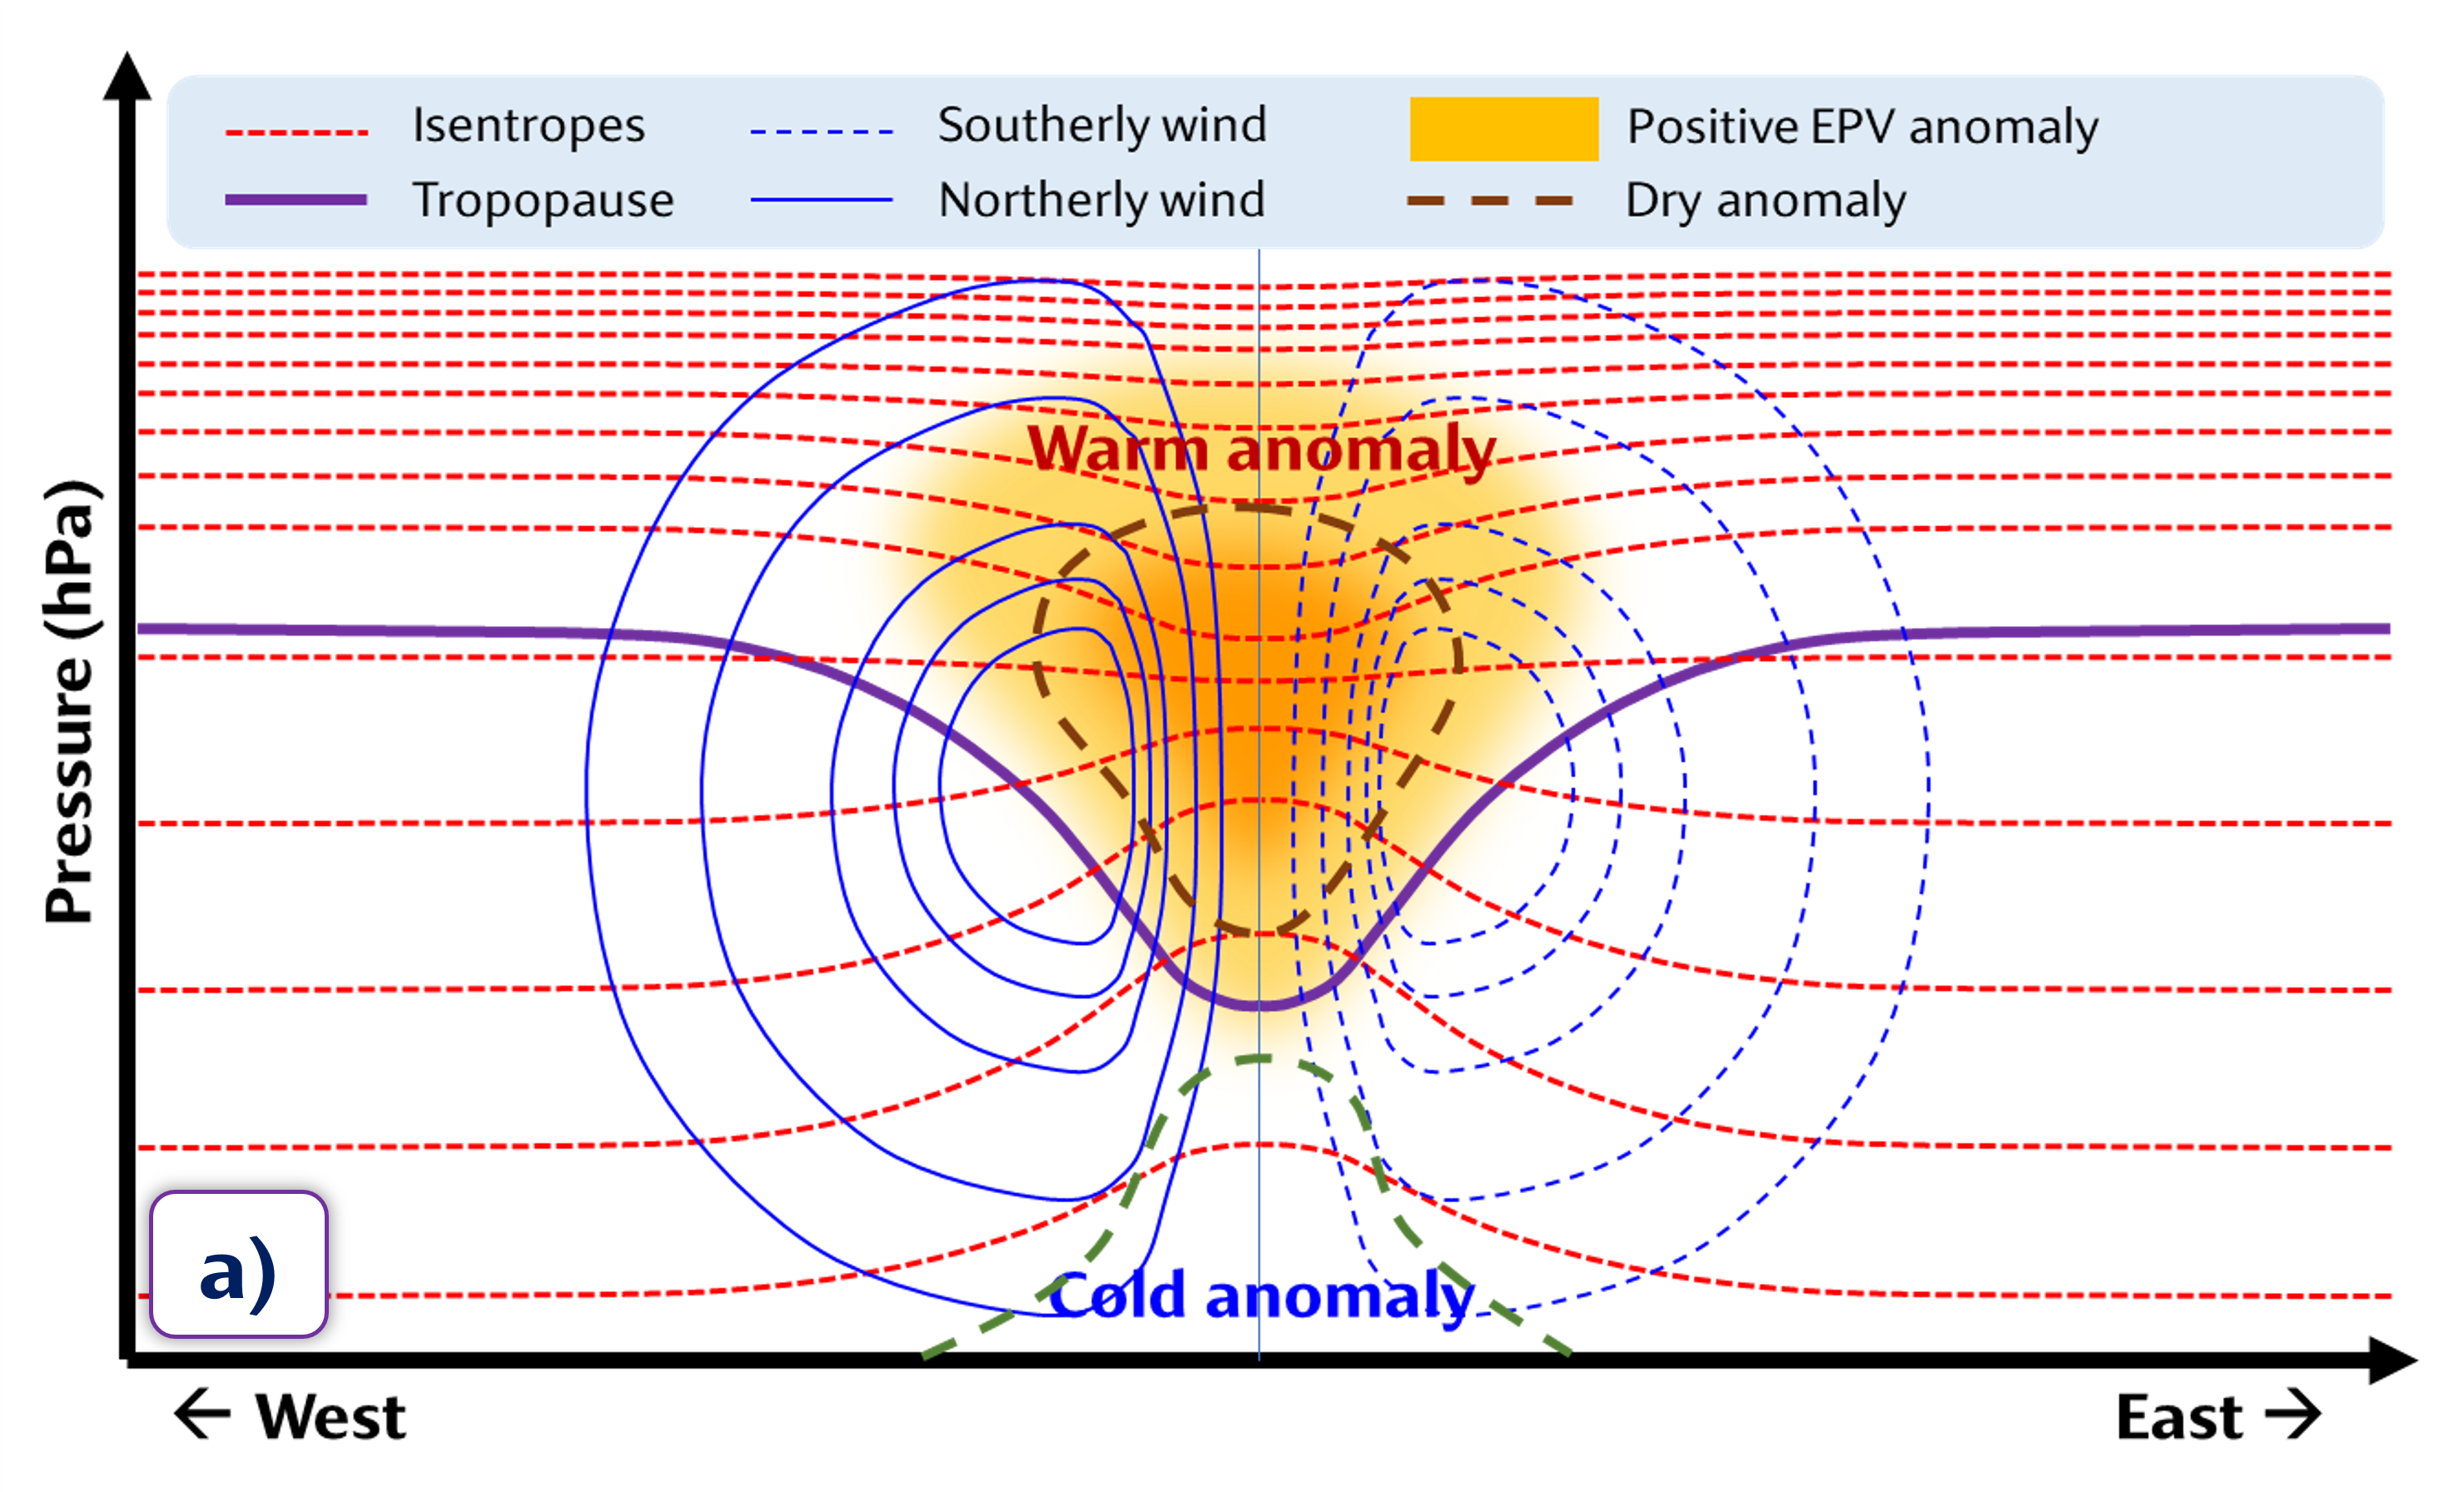
Idealized schematic of an isolated TPV.
Let's momentarily go on a side tangent to discuss Tropopause Polar Vortices (TPVs). A TPV is a sub-synoptic scale coherent vortex characterized by a lowered tropopause, and a minimum in potential temperature and maximum in vorticity along the tropopause relative to surrounding locations. Cavallo and Hakim (2010) created a composite of TPV characteristics, showing TPVs are associated with anomalous cold below the vortex core and anomalous warmth above the vortex core.

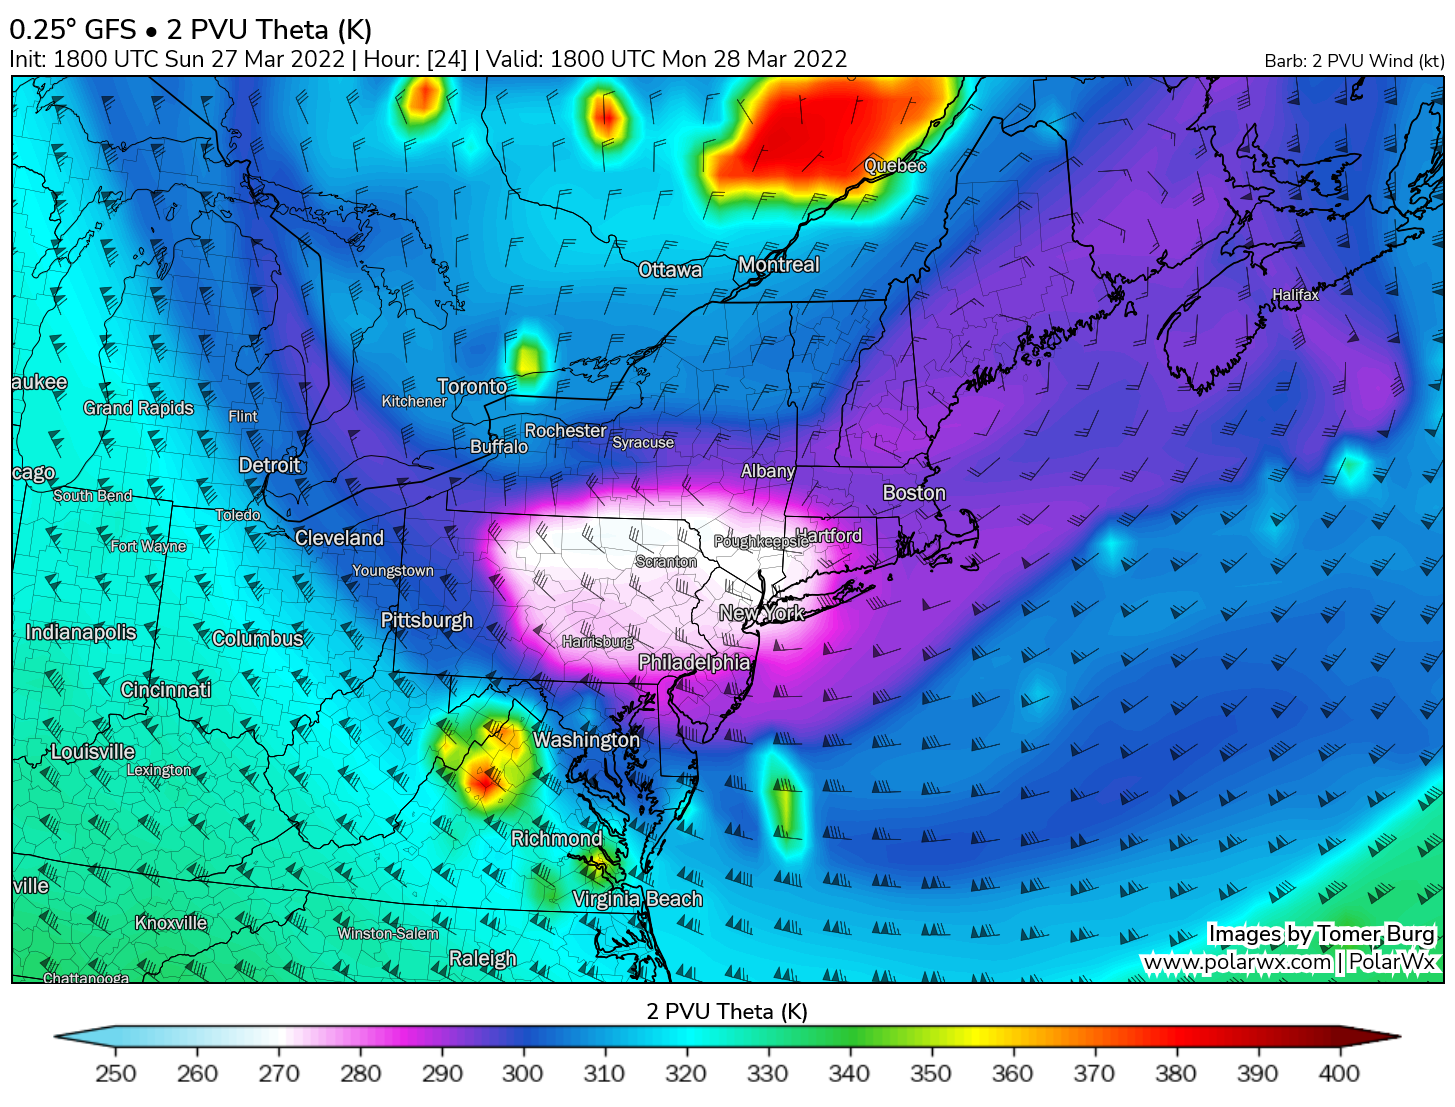
GFS forecast 2 PVU potential temperature (2 PVU = dynamic tropopause), valid Monday afternoon.
Why is this the case? This ties back to thermal wind balance. A TPV is characterized by a positive potential vorticity (PV) and static stability anomaly centered at the tropopause. Going above and below the vortex core, the sign of the PV anomaly remains positive, even though its magnitude decreases. In order to maintain thermal wind balance, the sign of the static stability anomaly must be the opposite sign of that of the PV anomaly above and below the vortex, meaning that isentropes, or contours of potential temperature, bend upwards below the vortex, resulting in a cold anomaly below it, and bend upwards above the vortex, resulting in a warm anomaly above it.

Knowing this, we can expect a TPV to be collocated with anomalous cold below it and anomalous warmth above it. And looking at the forecast for tomorrow in the Northeast U.S., a TPV is indeed forecast to be positioned directly overhead. The tropopause height centered within the TPV is about 600-650 hPa. As such, the TPV is contributing to the percentile ranks we saw above, with anomalous cold at 850-700 hPa below the vortex core, and anomalous warmth at 200 hPa above the vortex core. This further ties into recent research such as Biernat et al. (2021) that established a link between TPVs, tropospheric cold pools, and cold air outbreaks.
TPV Forecast Uncertainty
Trend in 2 PVU potential temperature over the last 12 GFS cycles.
Forecast temperatures for New York City have continuously trended downward over the last few days the closer we got to this cold air outbreak. Looking at the last few cycles of forecasts from the Global Forecast System (GFS) model, we can see that while the Northeast U.S. has been consistently forecast to be located beneath an upper-level trough, the TPV was previously not forecast to be located anywhere near NYC!

Trend in 2-meter temperature (F) over the last 12 GFS cycles.
Naturally this got me intrigued as to the role the TPV has in the cold air outbreak, specifically in affecting just how cold it ends up. The loop above shows the trend over the last few GFS cycles in 2-meter temperatures. Notice that as we get closer to the event, the forecast temperatures trend colder with a more southwestward extent than previously forecast. The greatest decrease in forecast temperatures coincides quite nicely with the forecast TPV position.

Trend in forecast sounding over Northeast PA over the last 12 GFS cycles.
To look at this trend more in-depth, I used Tropical Tidbits to create a trend animation of the forecast GFS sounding over northeast Pennsylvania, which was consistently forecast to be within the cold air mass but only in recent GFS cycles was forecast to be directly beneath the TPV. Notice that as we trend closer, a couple of things happen:
  • The planetary boundary layer (PBL) trends much colder, indicative of the anomalous cold beneath the TPV relative to its surroundings
  • The tropopause height trends much lower, ending up around 650-hPa as of the latest GFS forecast
  • The lower stratosphere trends warmer, indicative of the anomalous warmth above the TPV relative to its surroundings
Trend in PV cross-section through the TPV over the last 12 GFS cycles.
A trend animation of cross-sections through the region shows the same picture but from a larger 2D perspective, as opposed to a 1D perspective at a single location. We can see that as the TPV trends into the Northeast US, the tropospheric cold pool gains a larger vertical extent, a positive PV anomaly relative to surroundings emerges within the TPV, and the lower stratosphere warm anomaly increases in magnitude. Additionally, we see an enhancement of the magnitude of the jet streak west of the TPV, as the TPV and its associated cold pool enhance the PV and temperature gradients.

This begs the question - how important is the TPV to the evolution of this anomalous cold air mass? This is of course only one case, and this is more of a qualitative than a quantitative assessment of it. There is also the question of how much is the cooling trend due to the added presence of the TPV, as opposed to the synoptic-scale trough trending more southwest which also expands the south/west extent of cold air. Even so, it appears that there would've still been unusually cold air regardless, but the added presence of a TPV results in colder temperatures than what would've otherwise been the case.
Share this post: