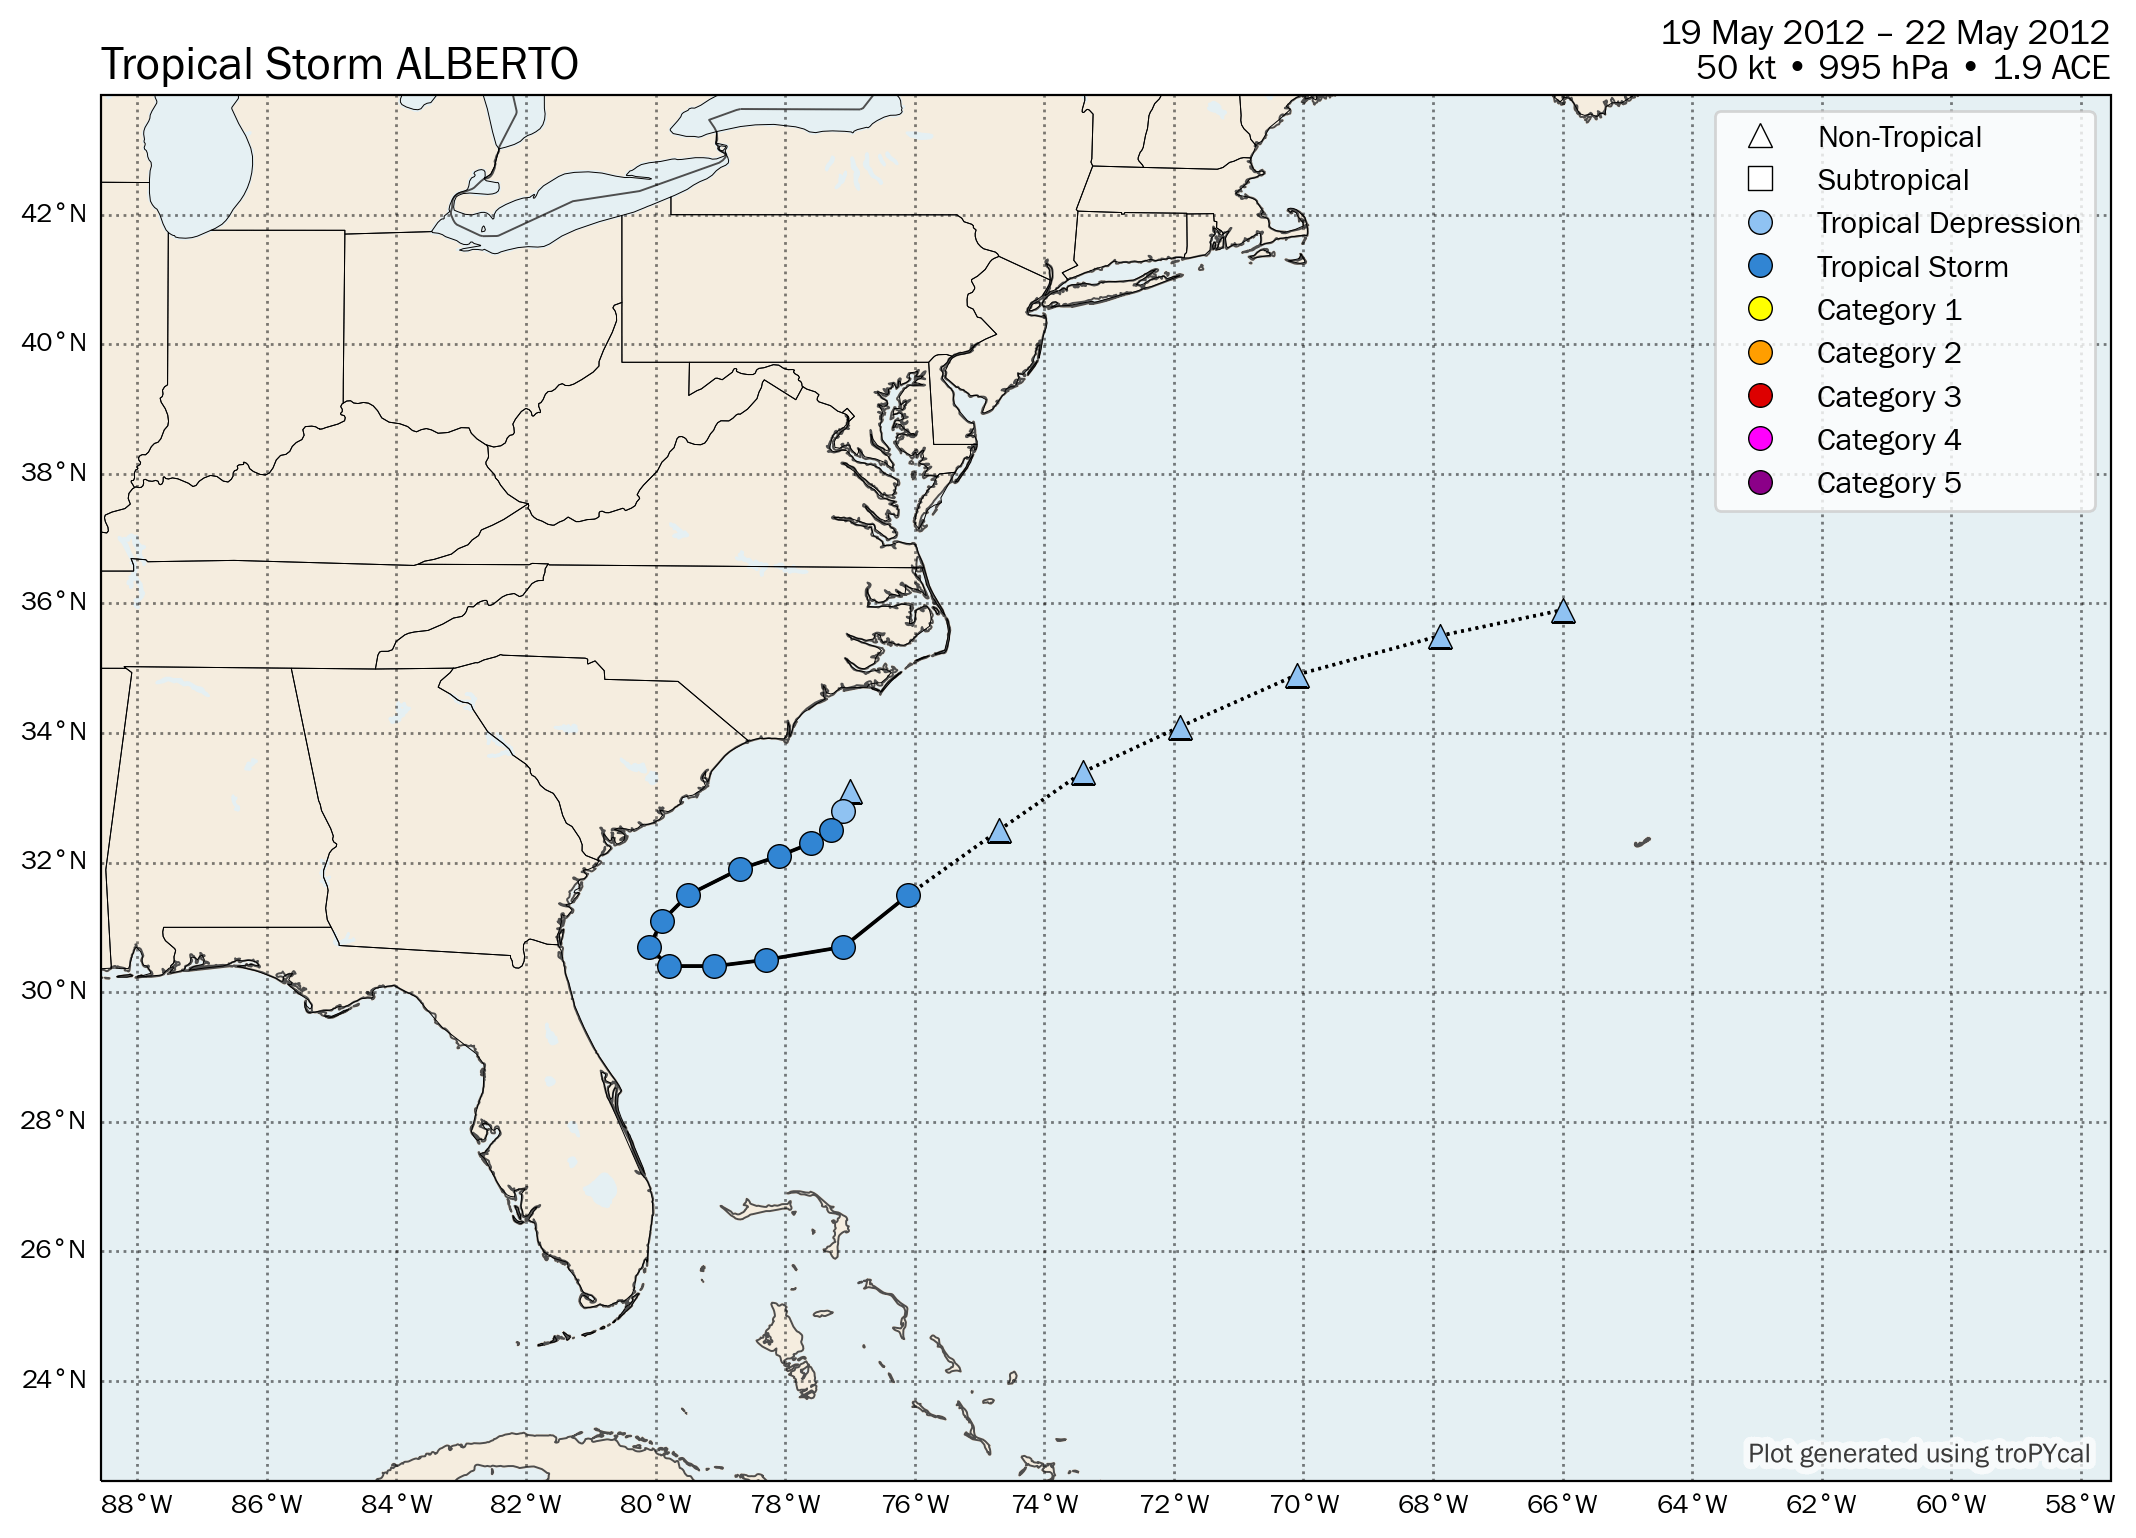
Tropical Storm Alberto
Storm Duration
•
May 19–22, 2012
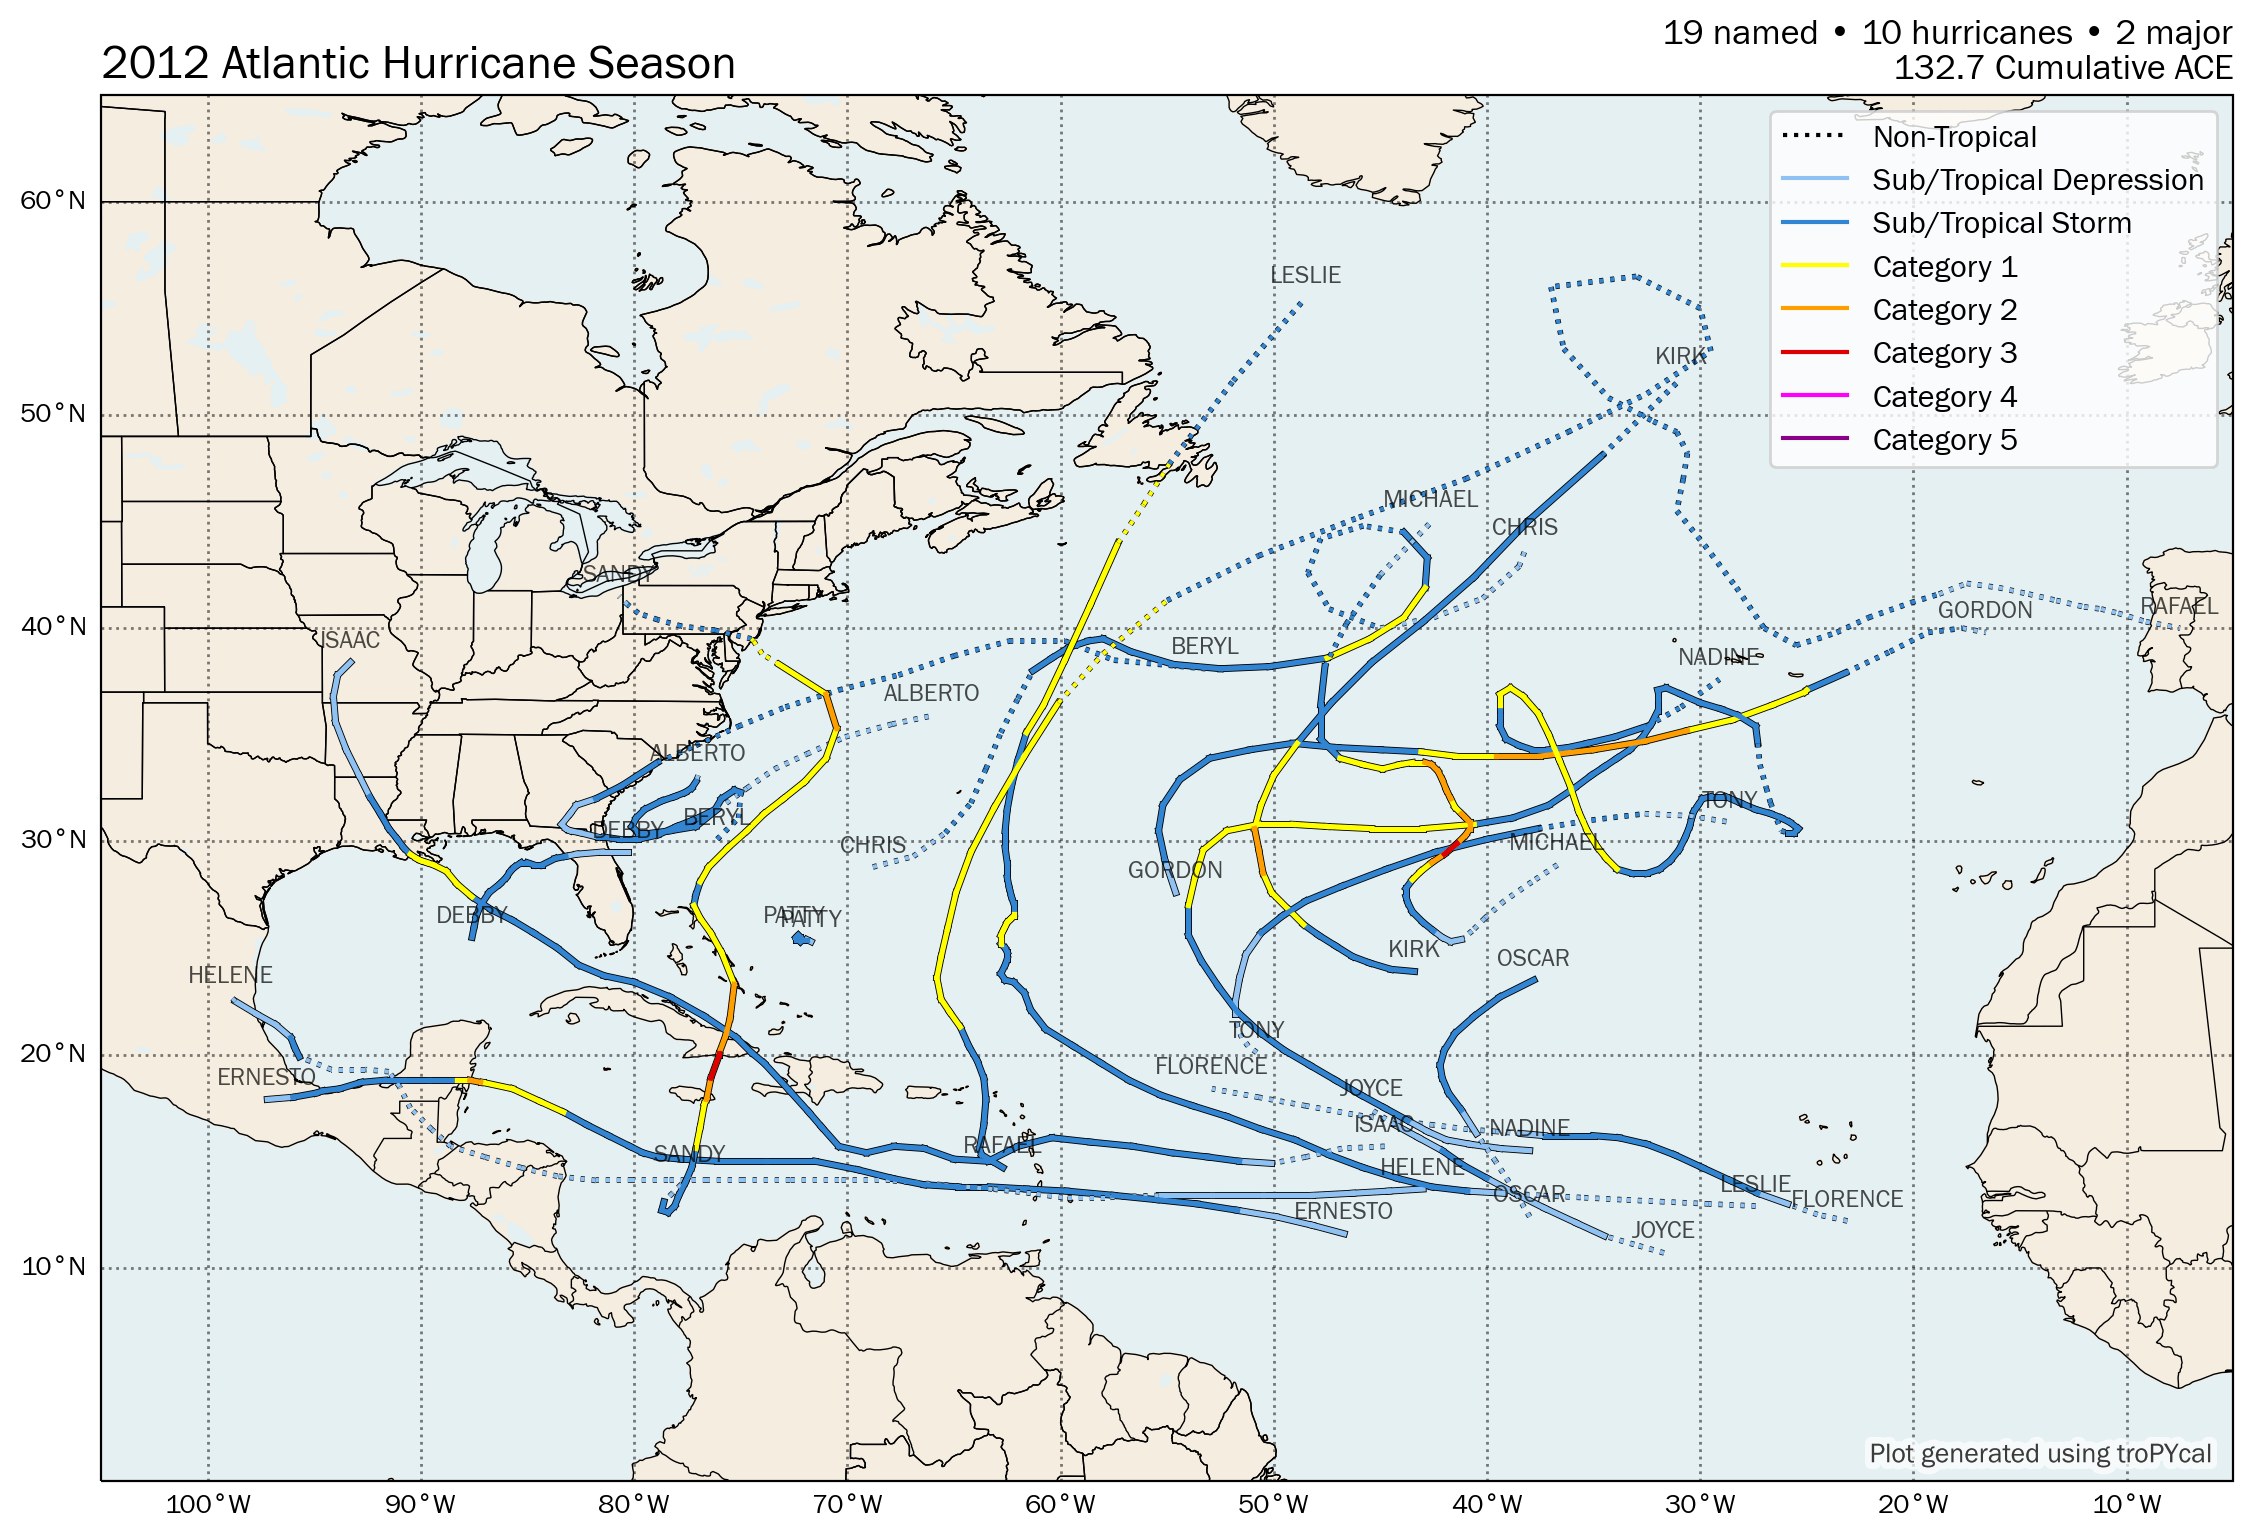
| S | Tropical Storm Alberto | 50 kt | 995 hPa | 06z 05/19 | 06z 05/22 | 1.9 |
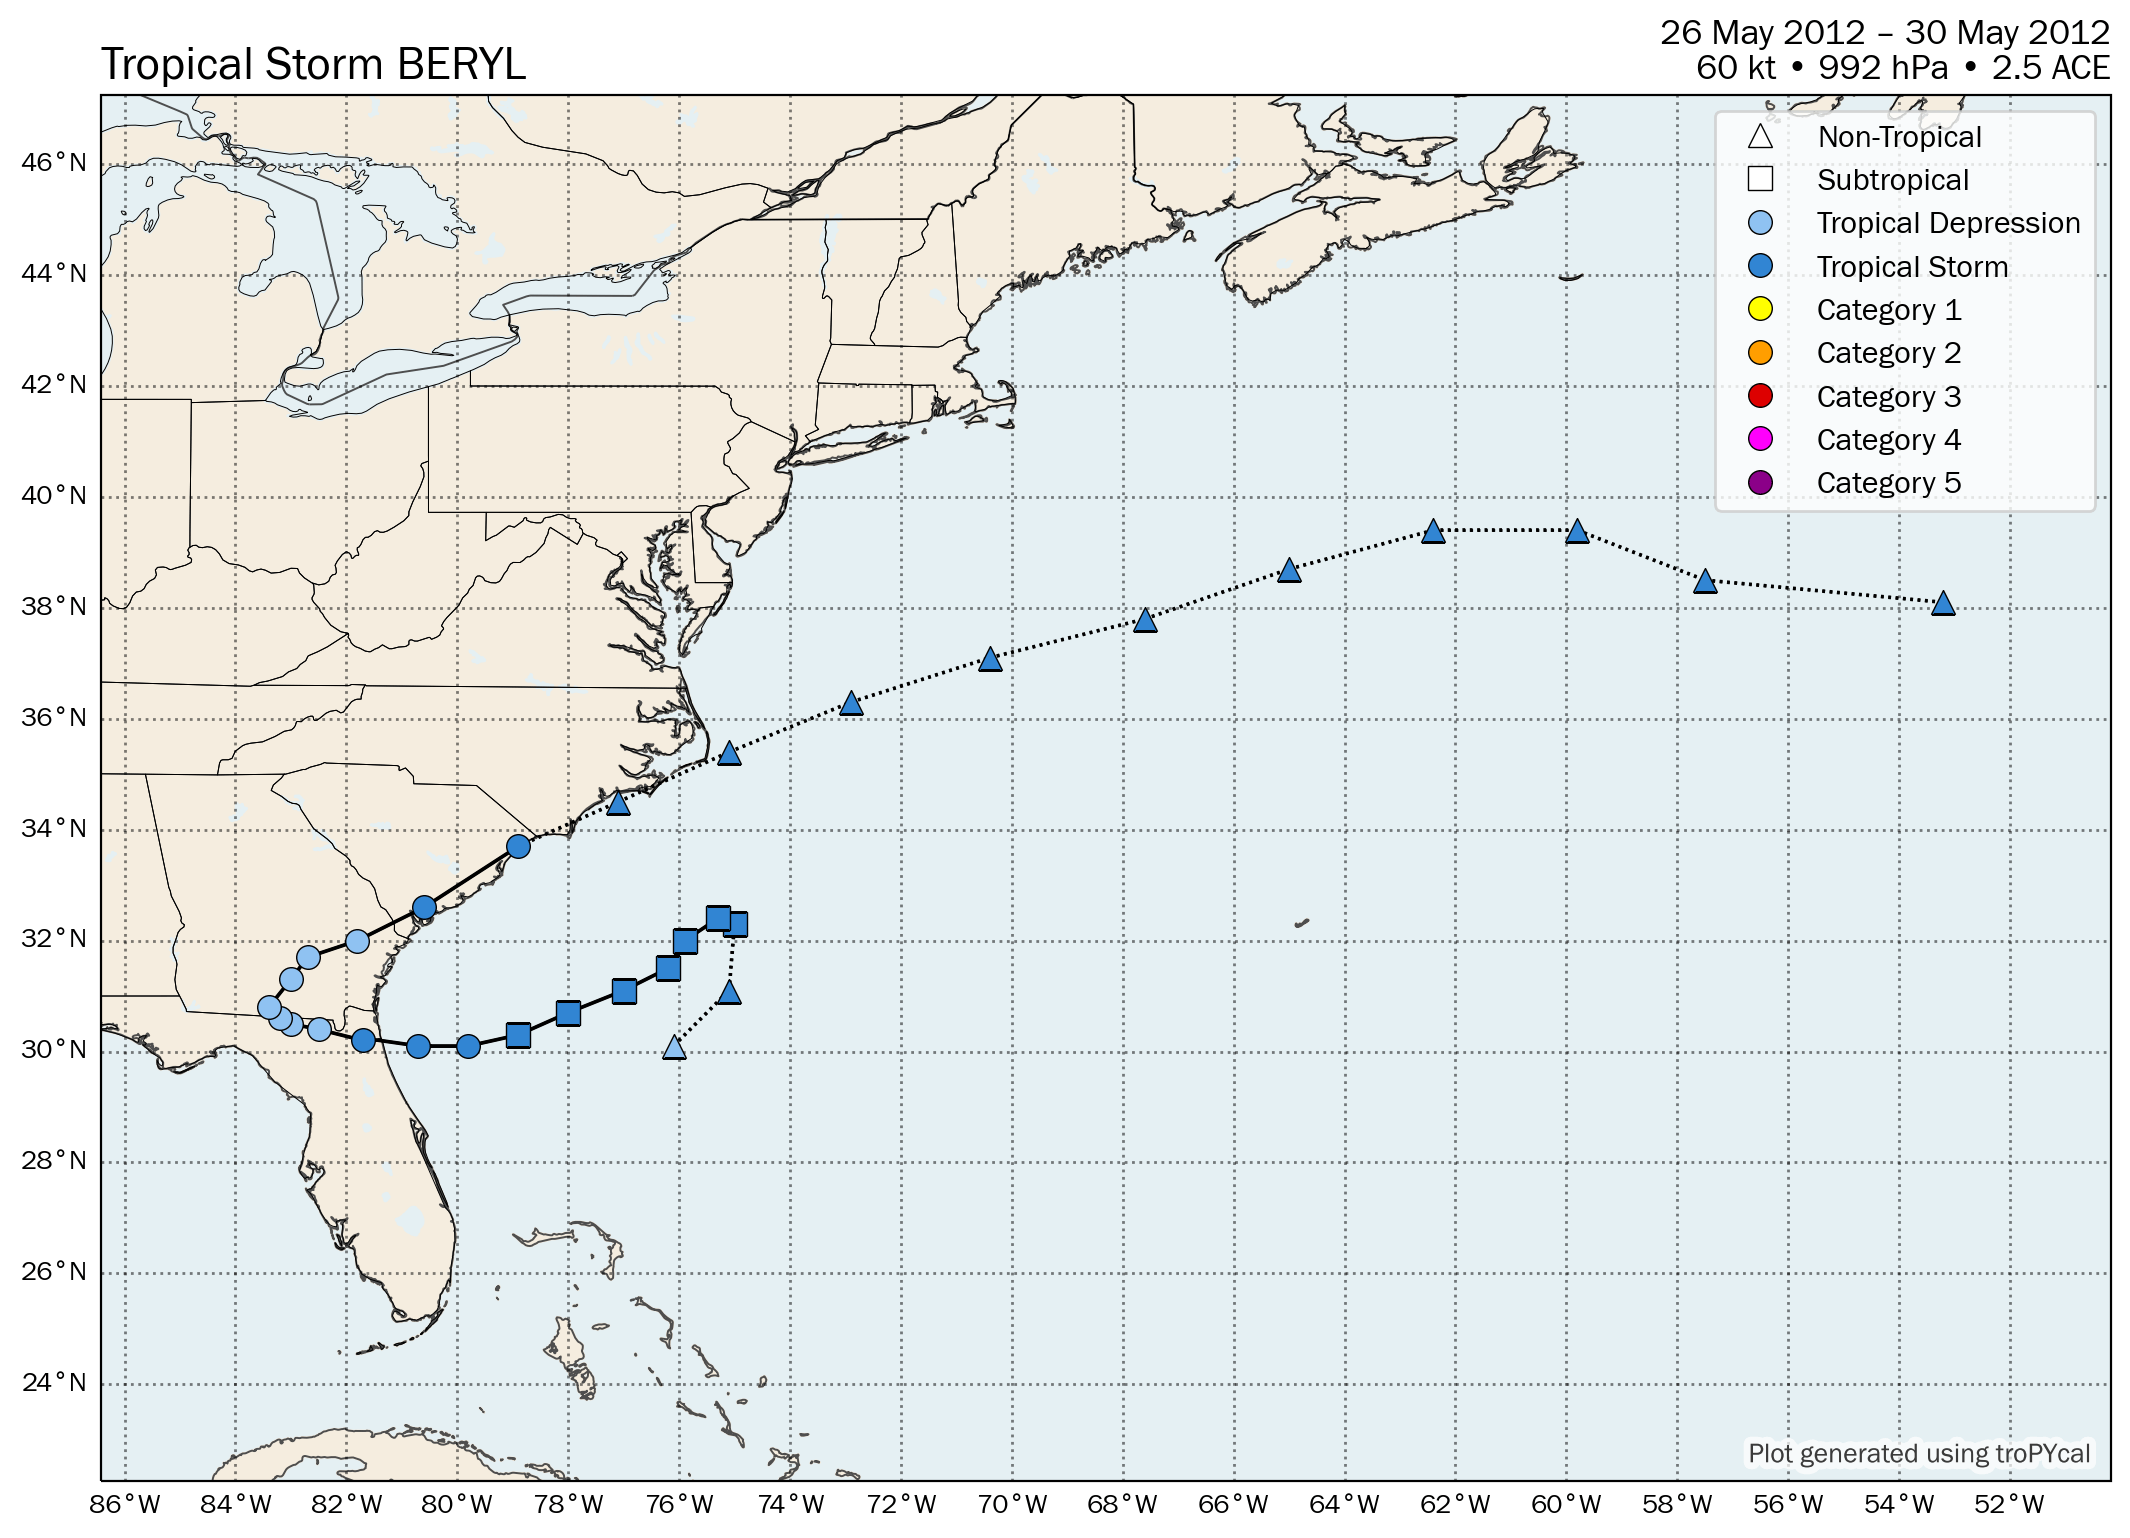
| S | Tropical Storm Beryl | 60 kt | 992 hPa | 00z 05/26 | 12z 05/30 | 2.5 |
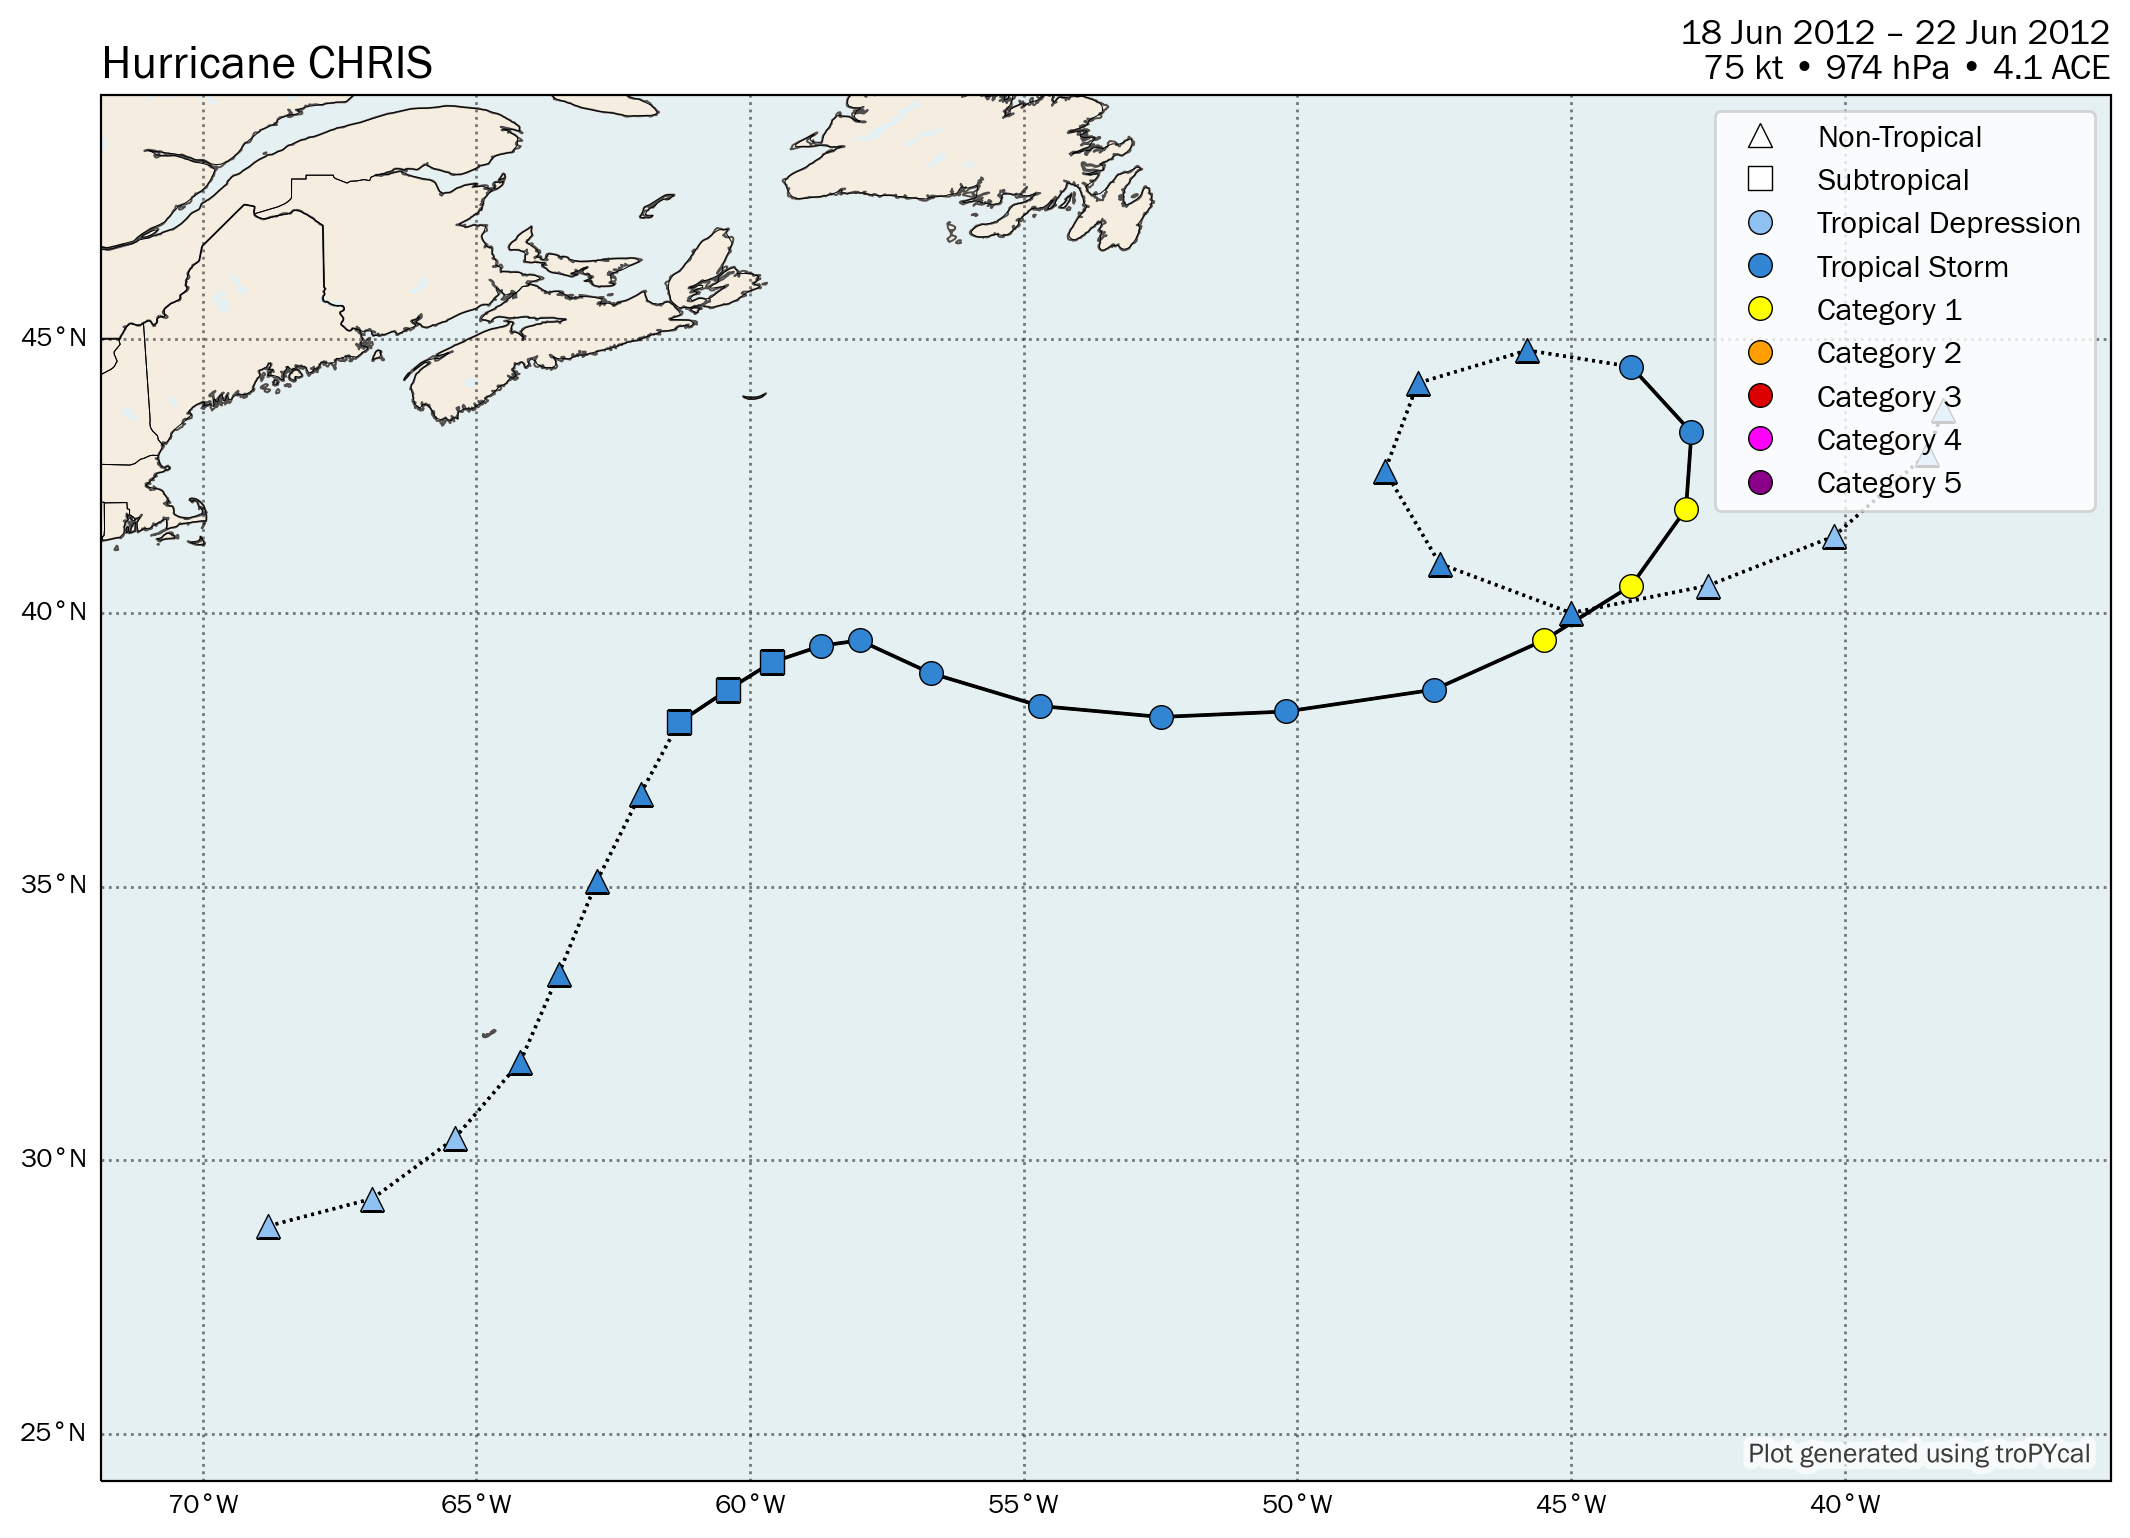
| 1 | Hurricane Chris | 75 kt | 974 hPa | 18z 06/18 | 06z 06/22 | 4.1 |
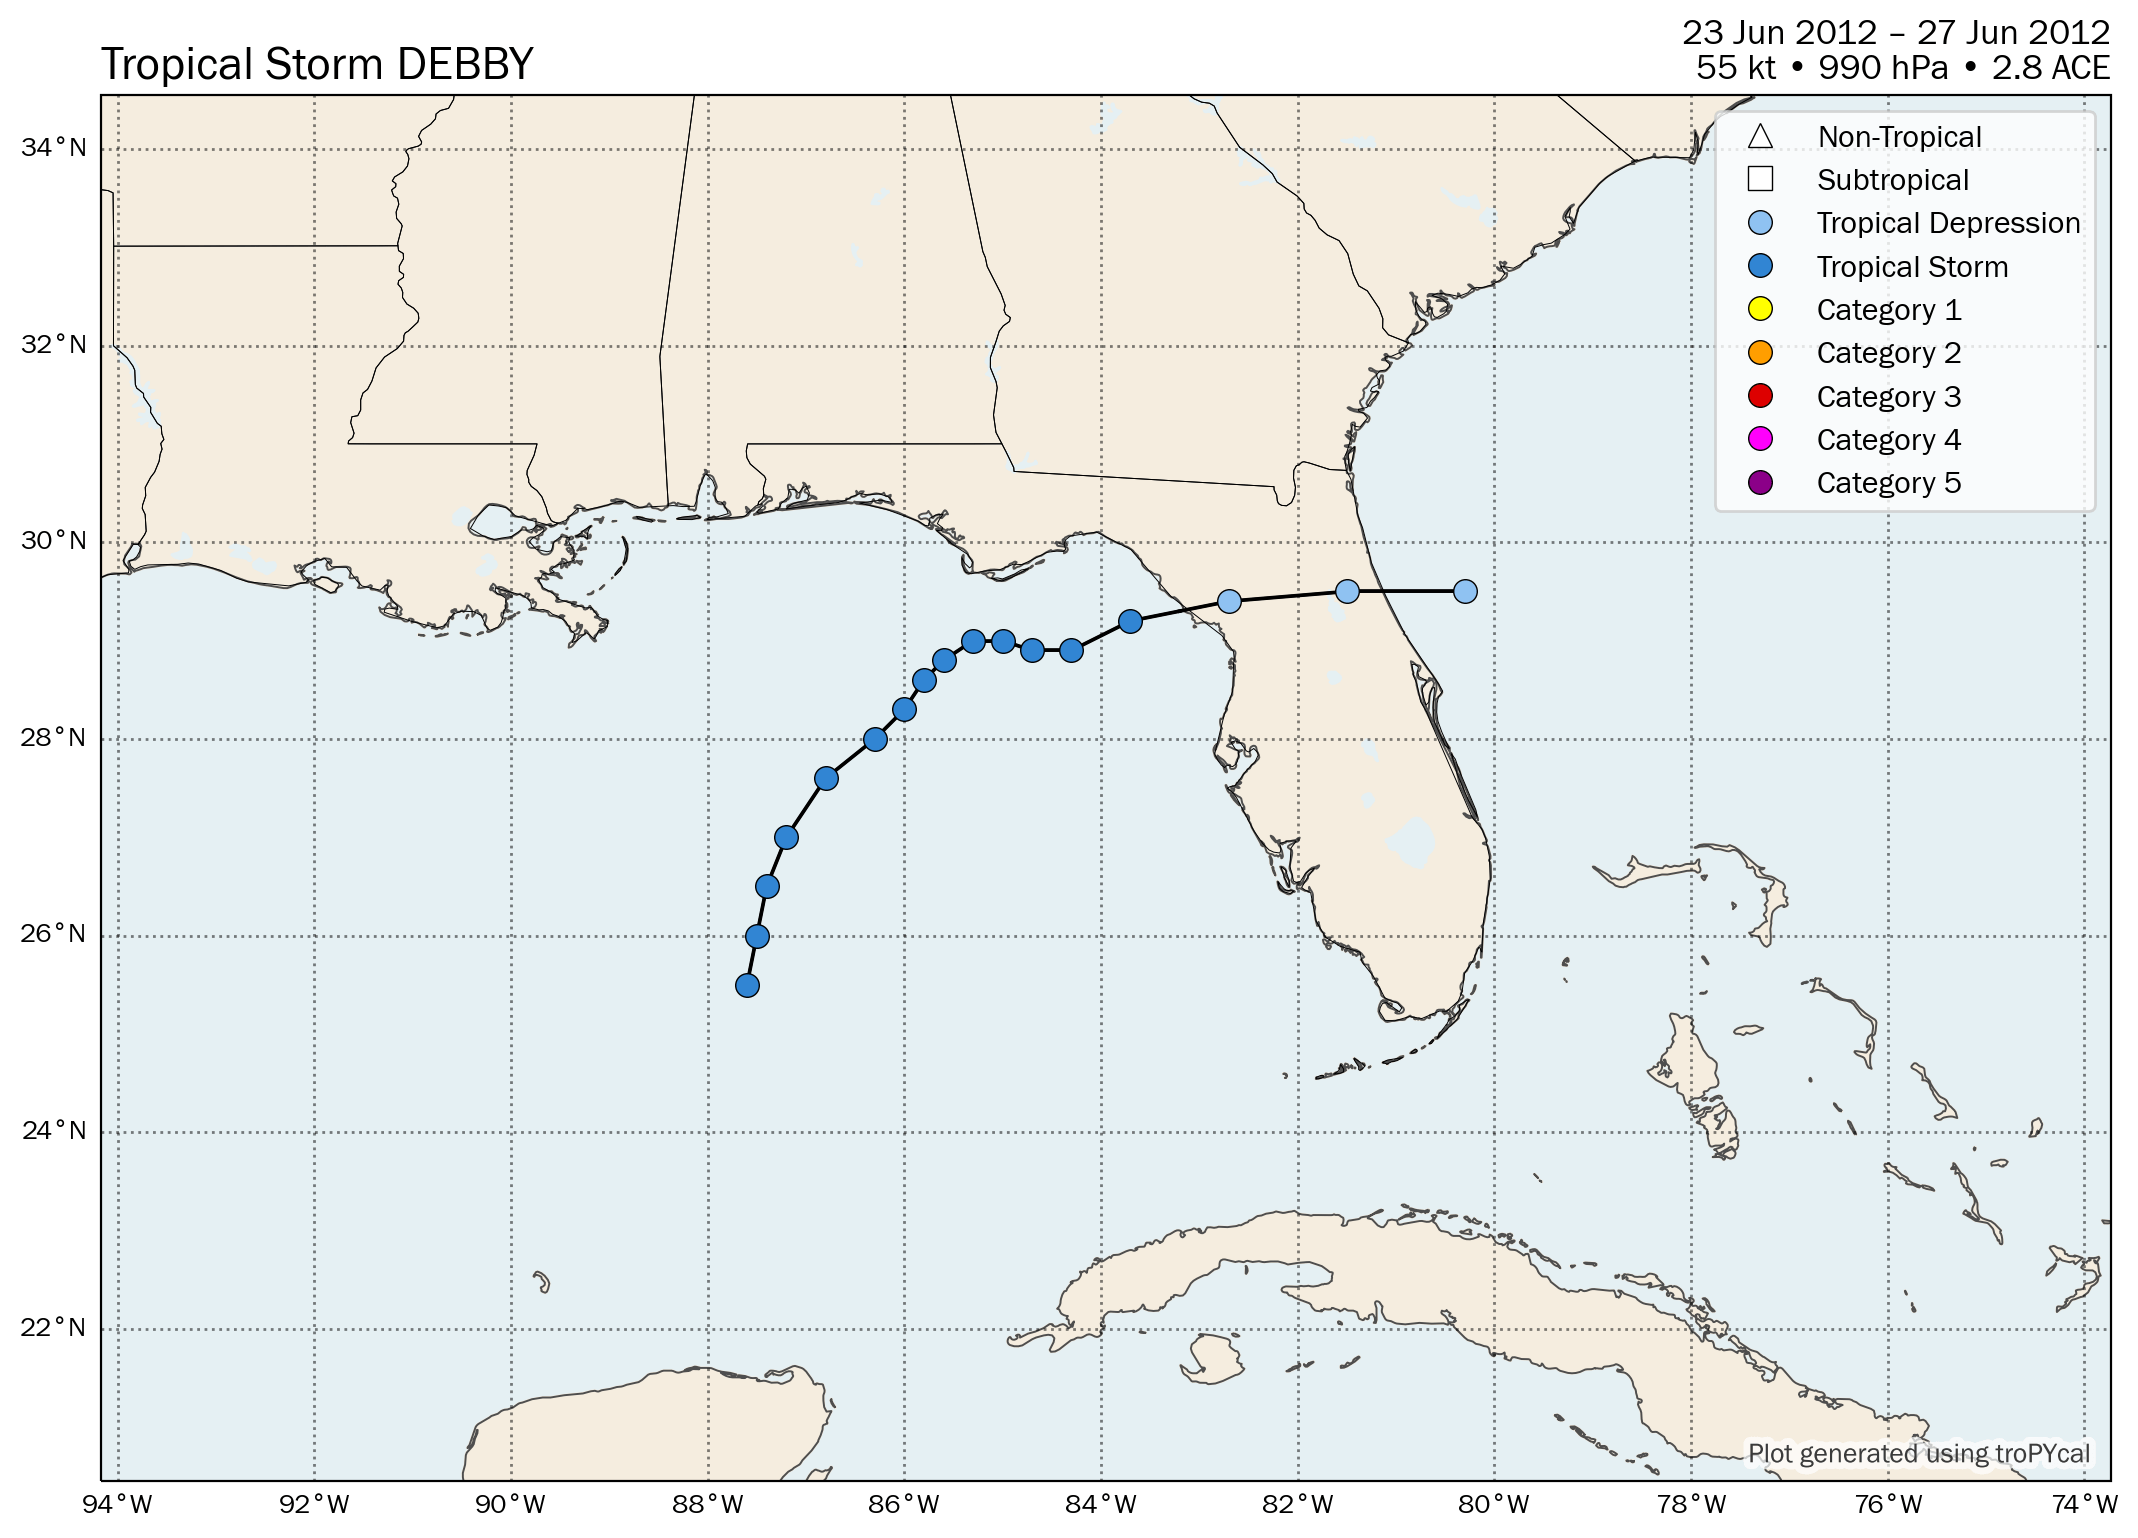
| S | Tropical Storm Debby | 55 kt | 990 hPa | 12z 06/23 | 12z 06/27 | 2.8 |
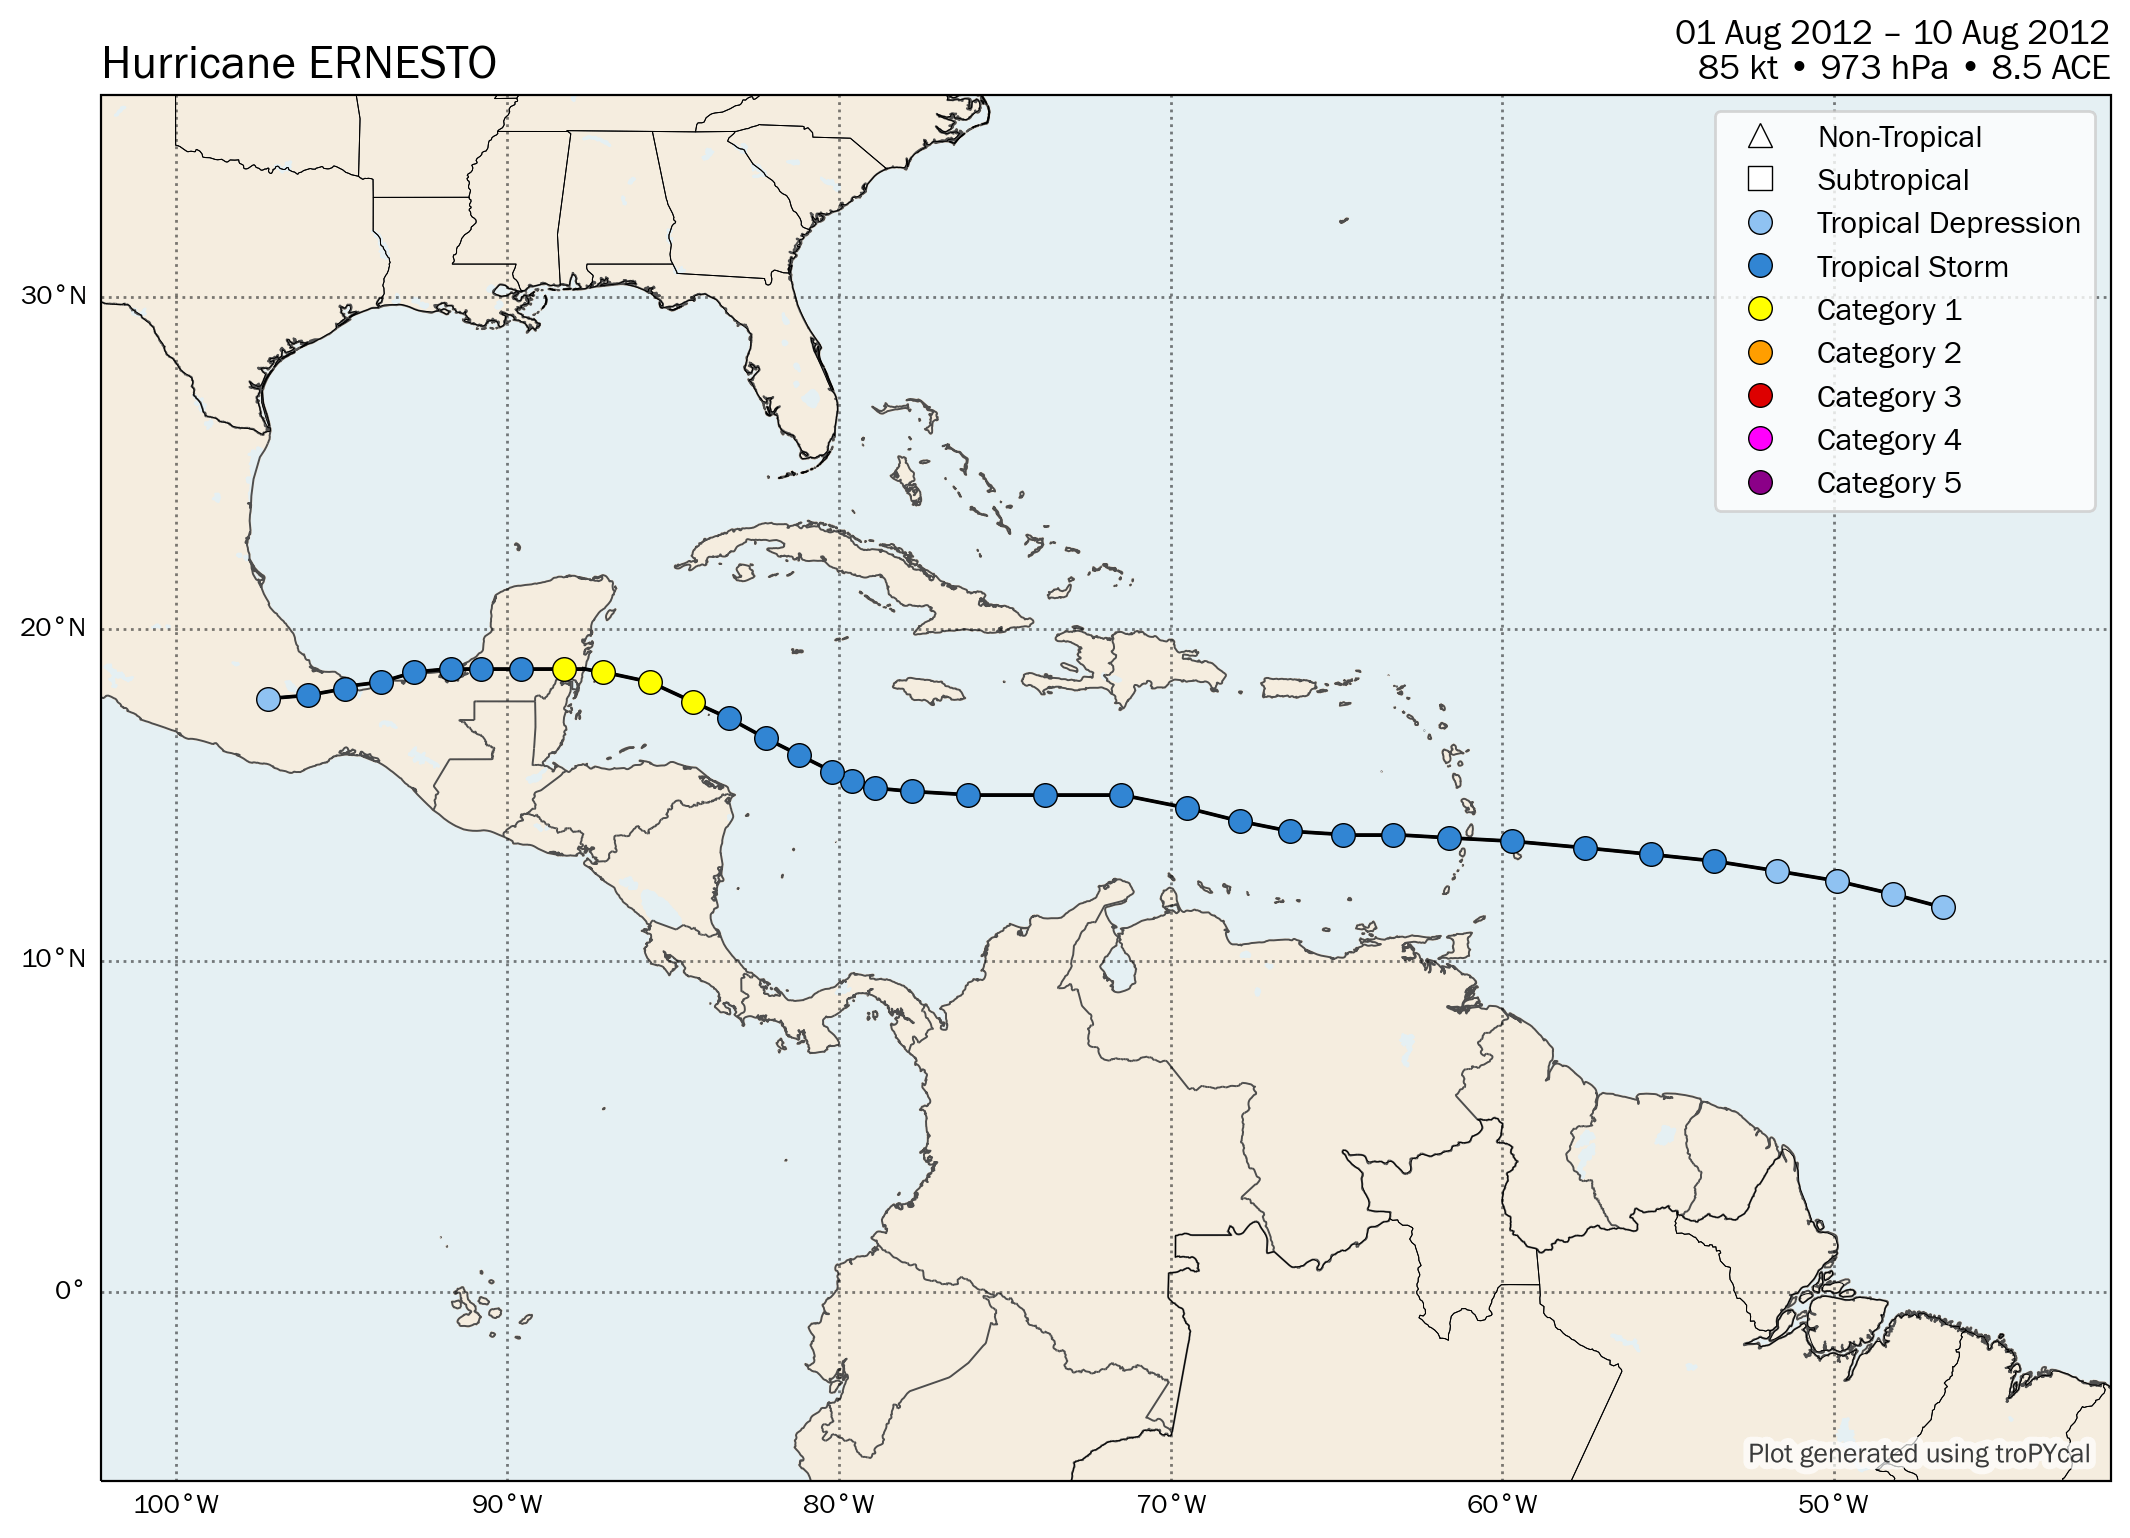
| 2 | Hurricane Ernesto | 85 kt | 973 hPa | 12z 08/01 | 06z 08/10 | 8.5 |
| S | Tropical Storm Florence | 50 kt | 1002 hPa | 18z 08/03 | 06z 08/06 | 1.5 |
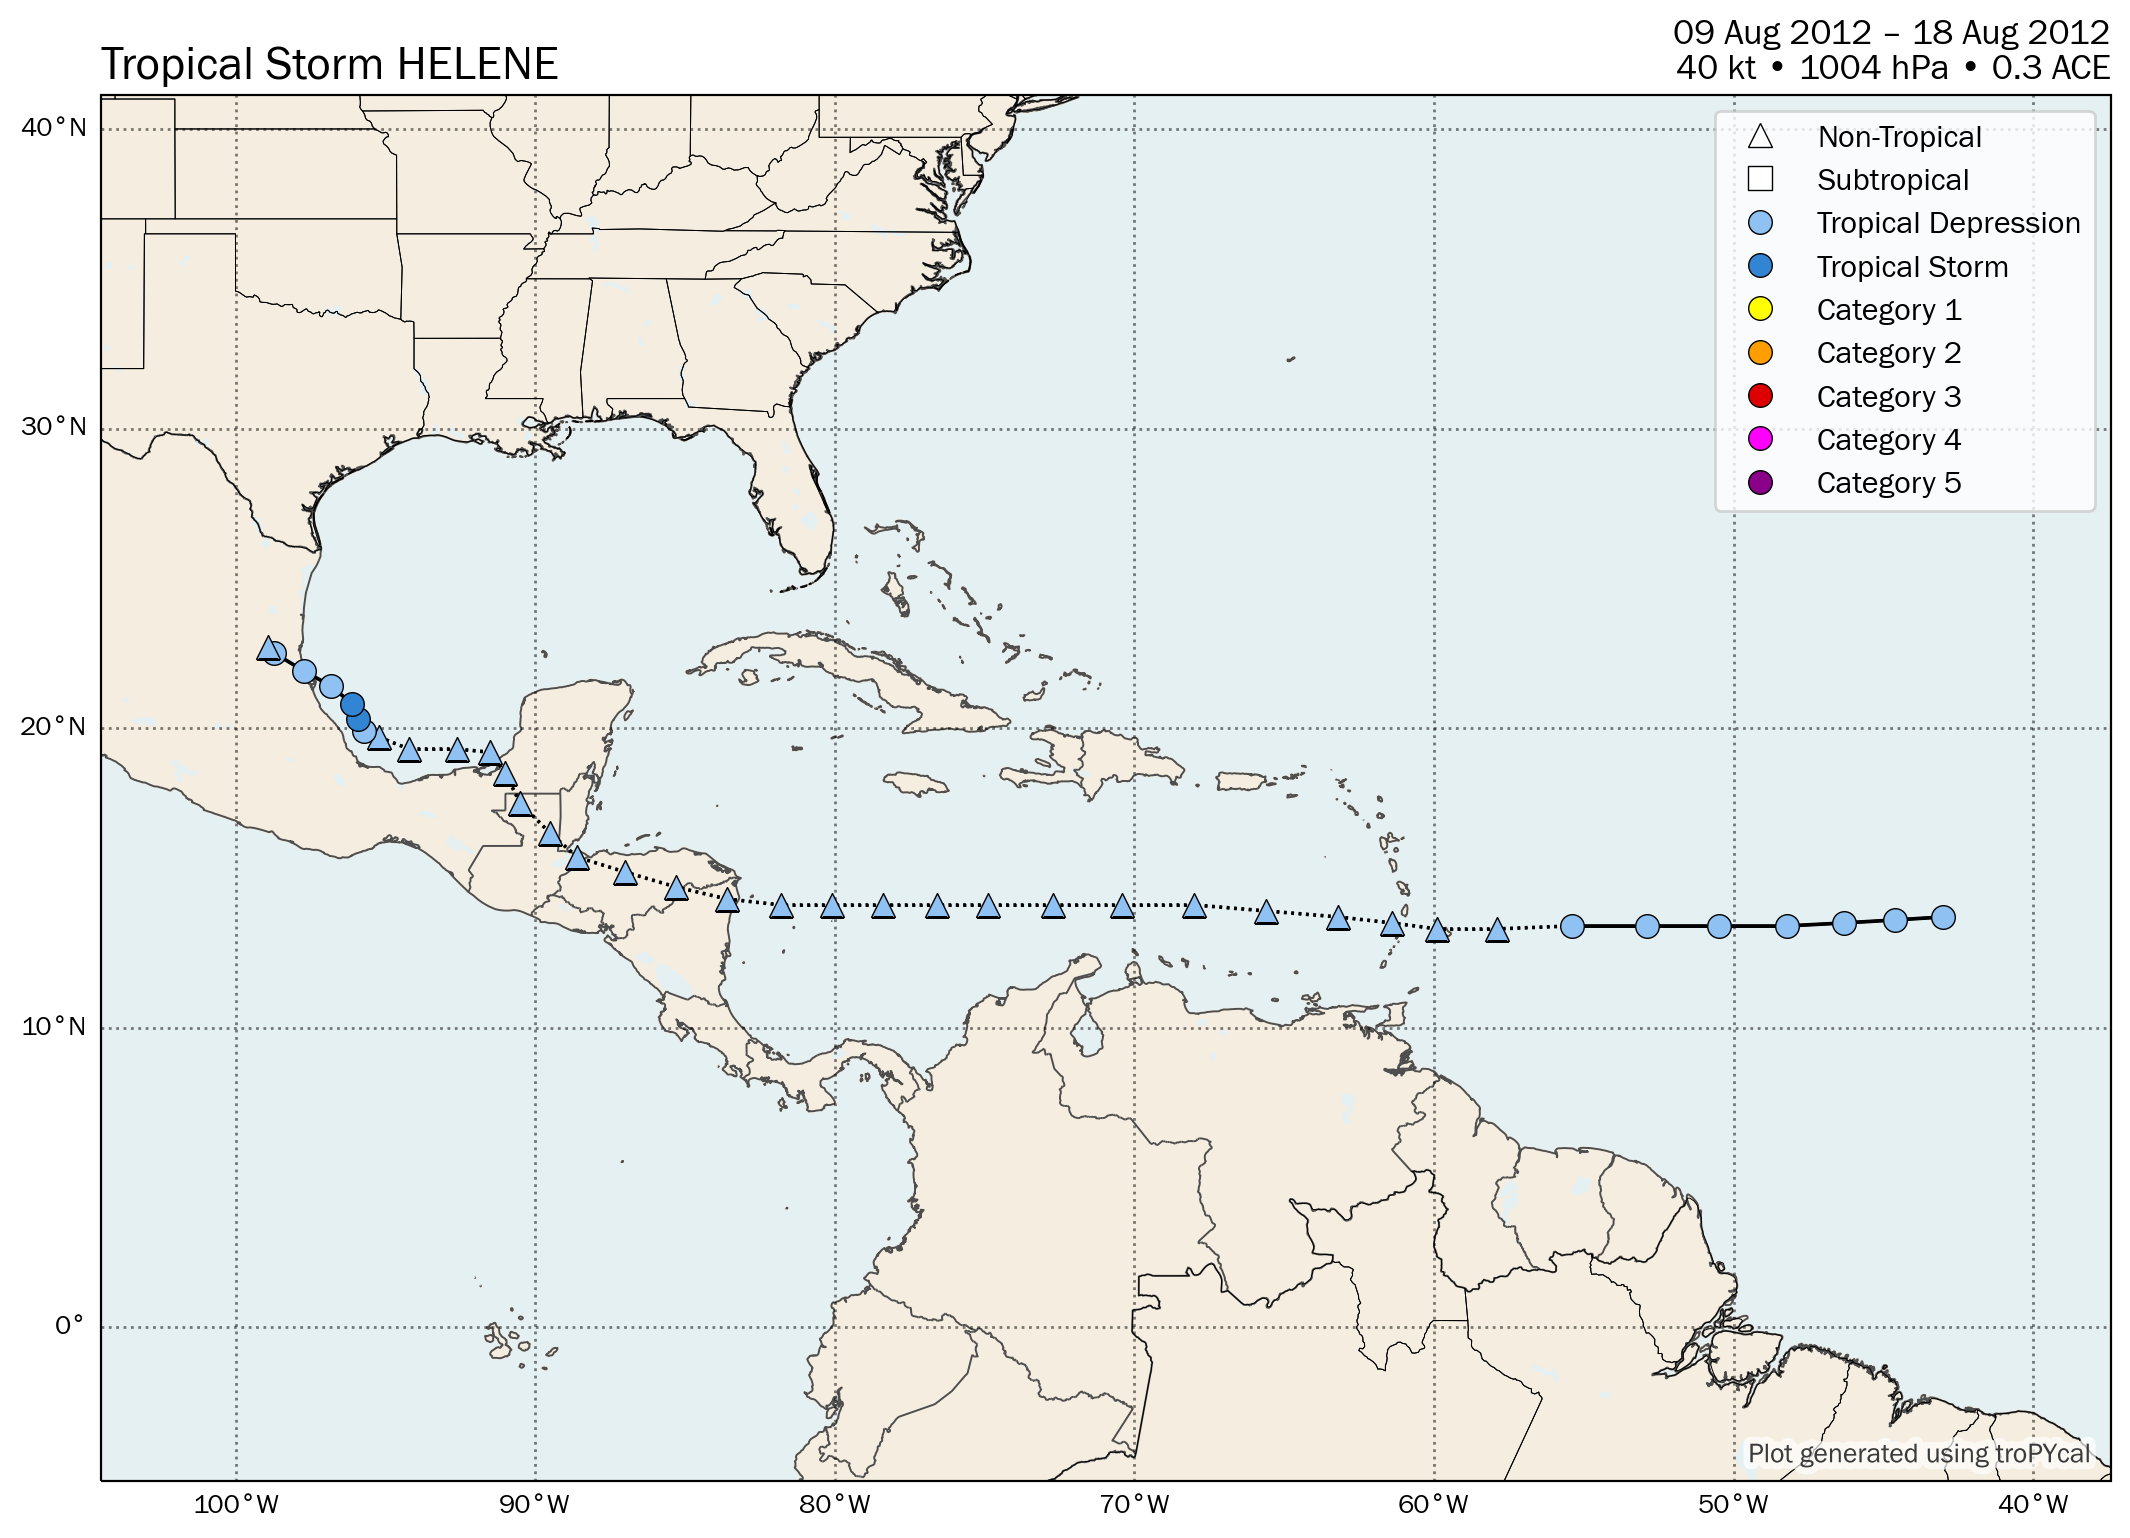
| S | Tropical Storm Helene | 40 kt | 1004 hPa | 18z 08/09 | 18z 08/18 | 0.3 |
| 2 | Hurricane Gordon | 95 kt | 965 hPa | 12z 08/15 | 12z 08/20 | 8.6 |
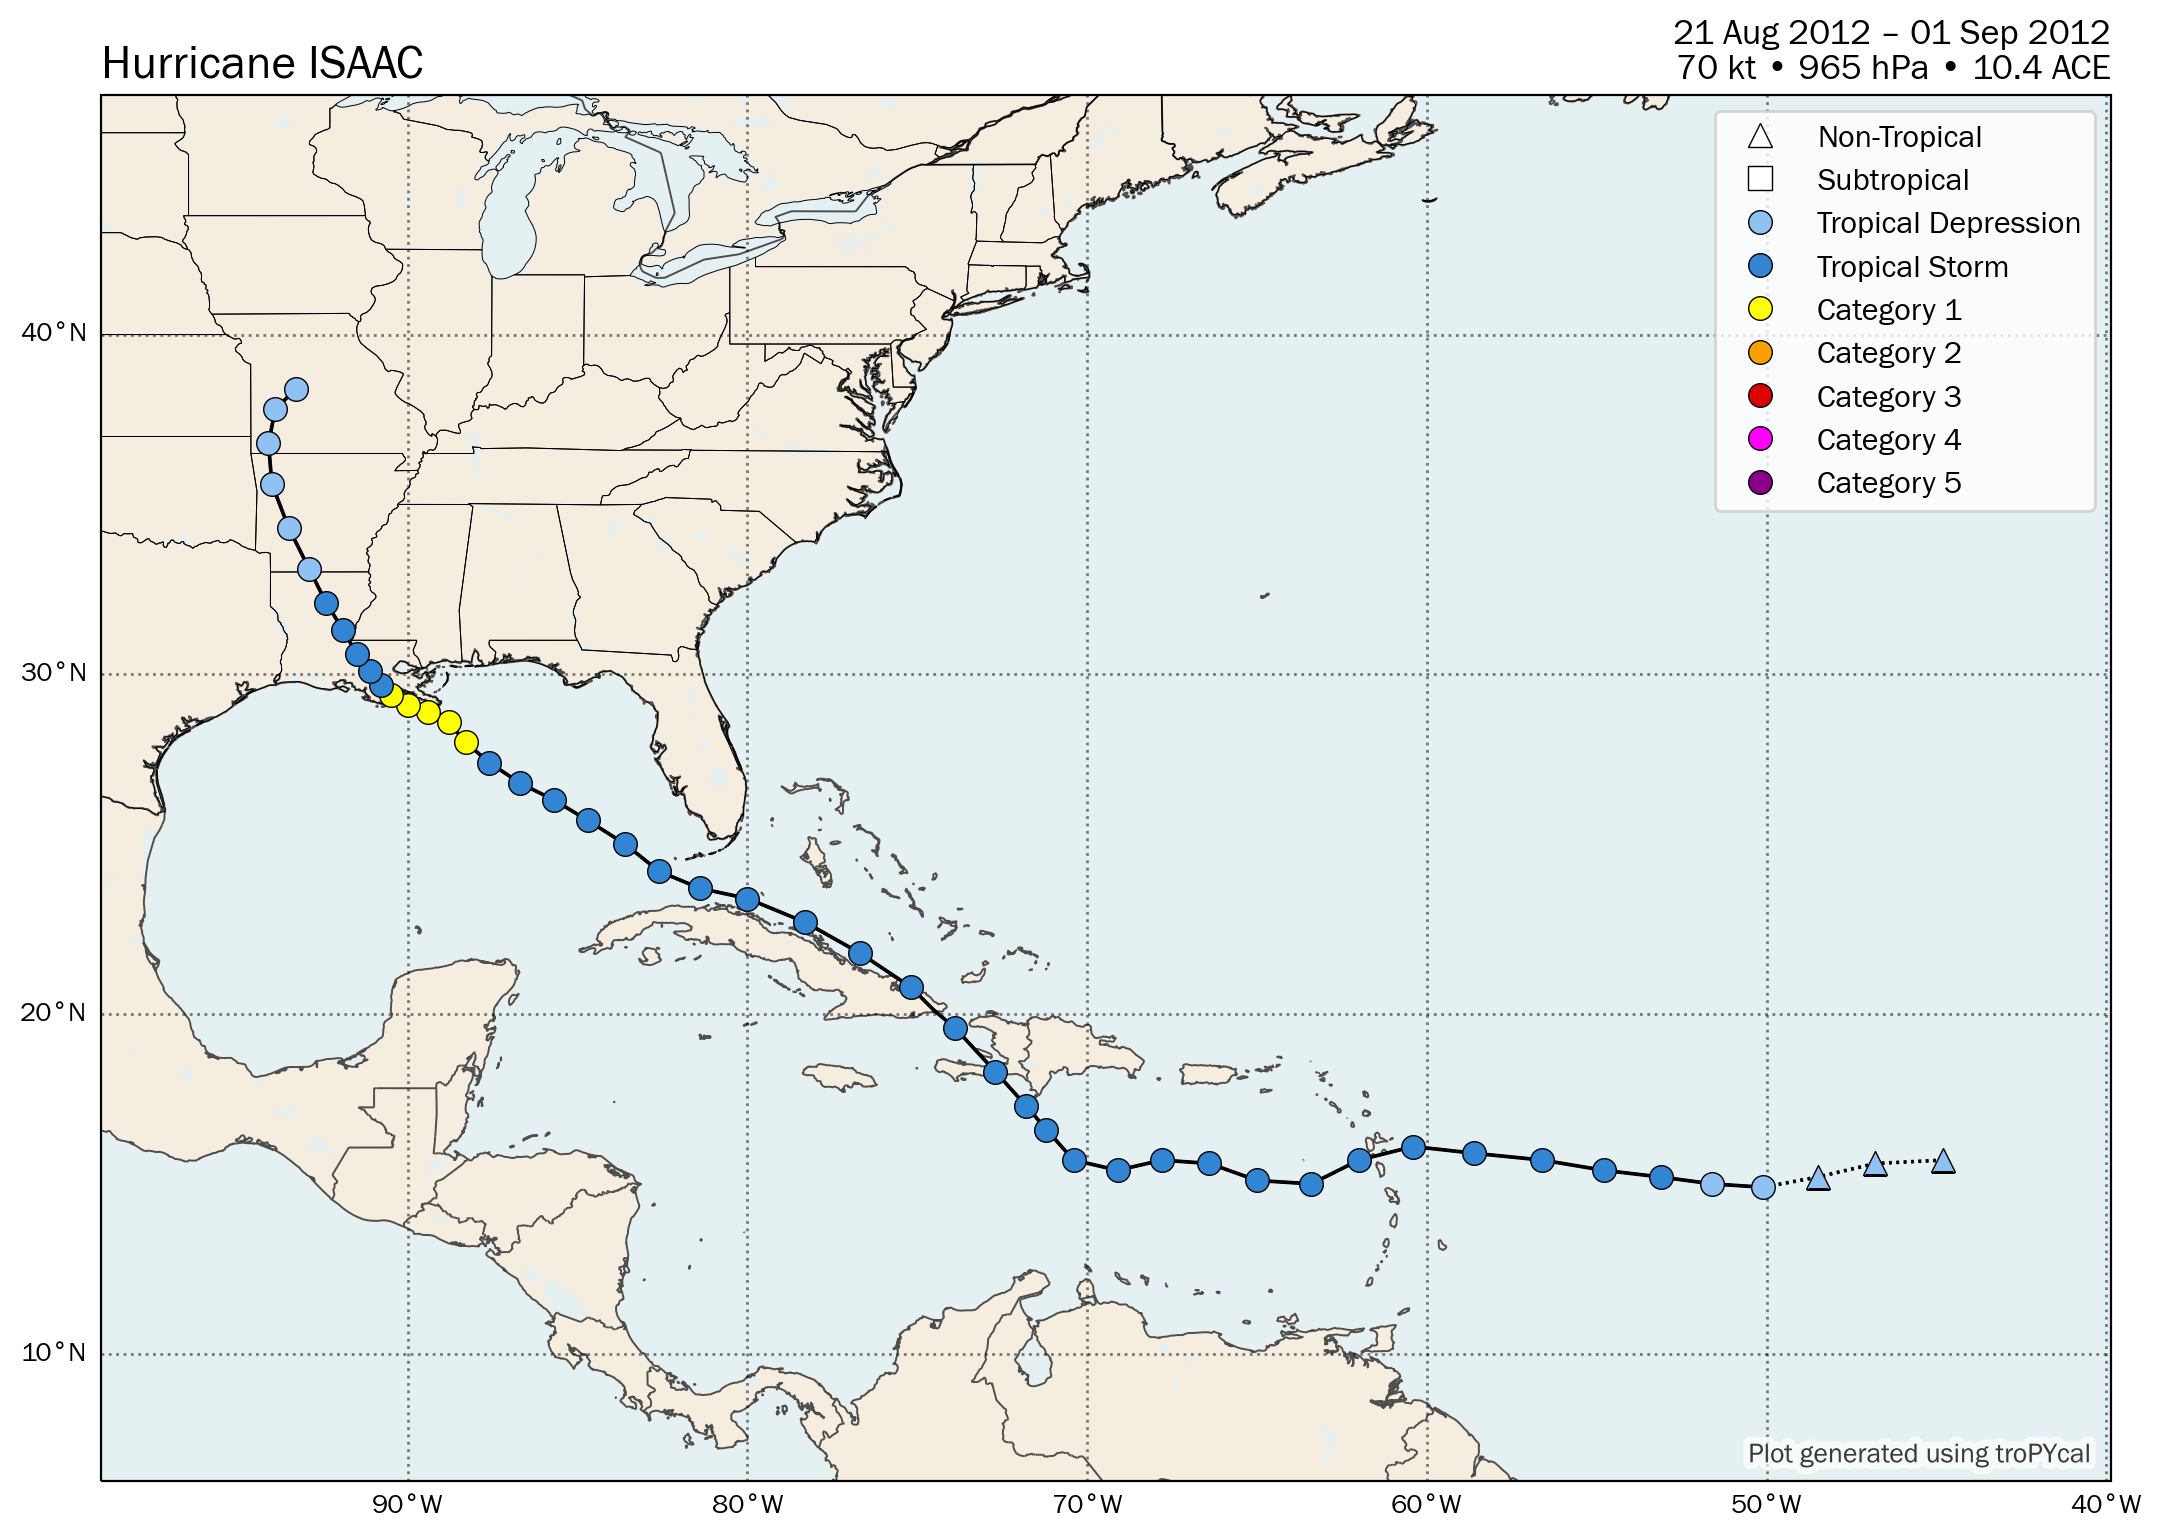
| 1 | Hurricane Isaac | 70 kt | 965 hPa | 06z 08/21 | 06z 09/01 | 10.4 |
| S | Tropical Storm Joyce | 35 kt | 1006 hPa | 06z 08/22 | 06z 08/24 | 0.2 |
| 2 | Hurricane Kirk | 90 kt | 970 hPa | 18z 08/28 | 18z 09/02 | 7.7 |
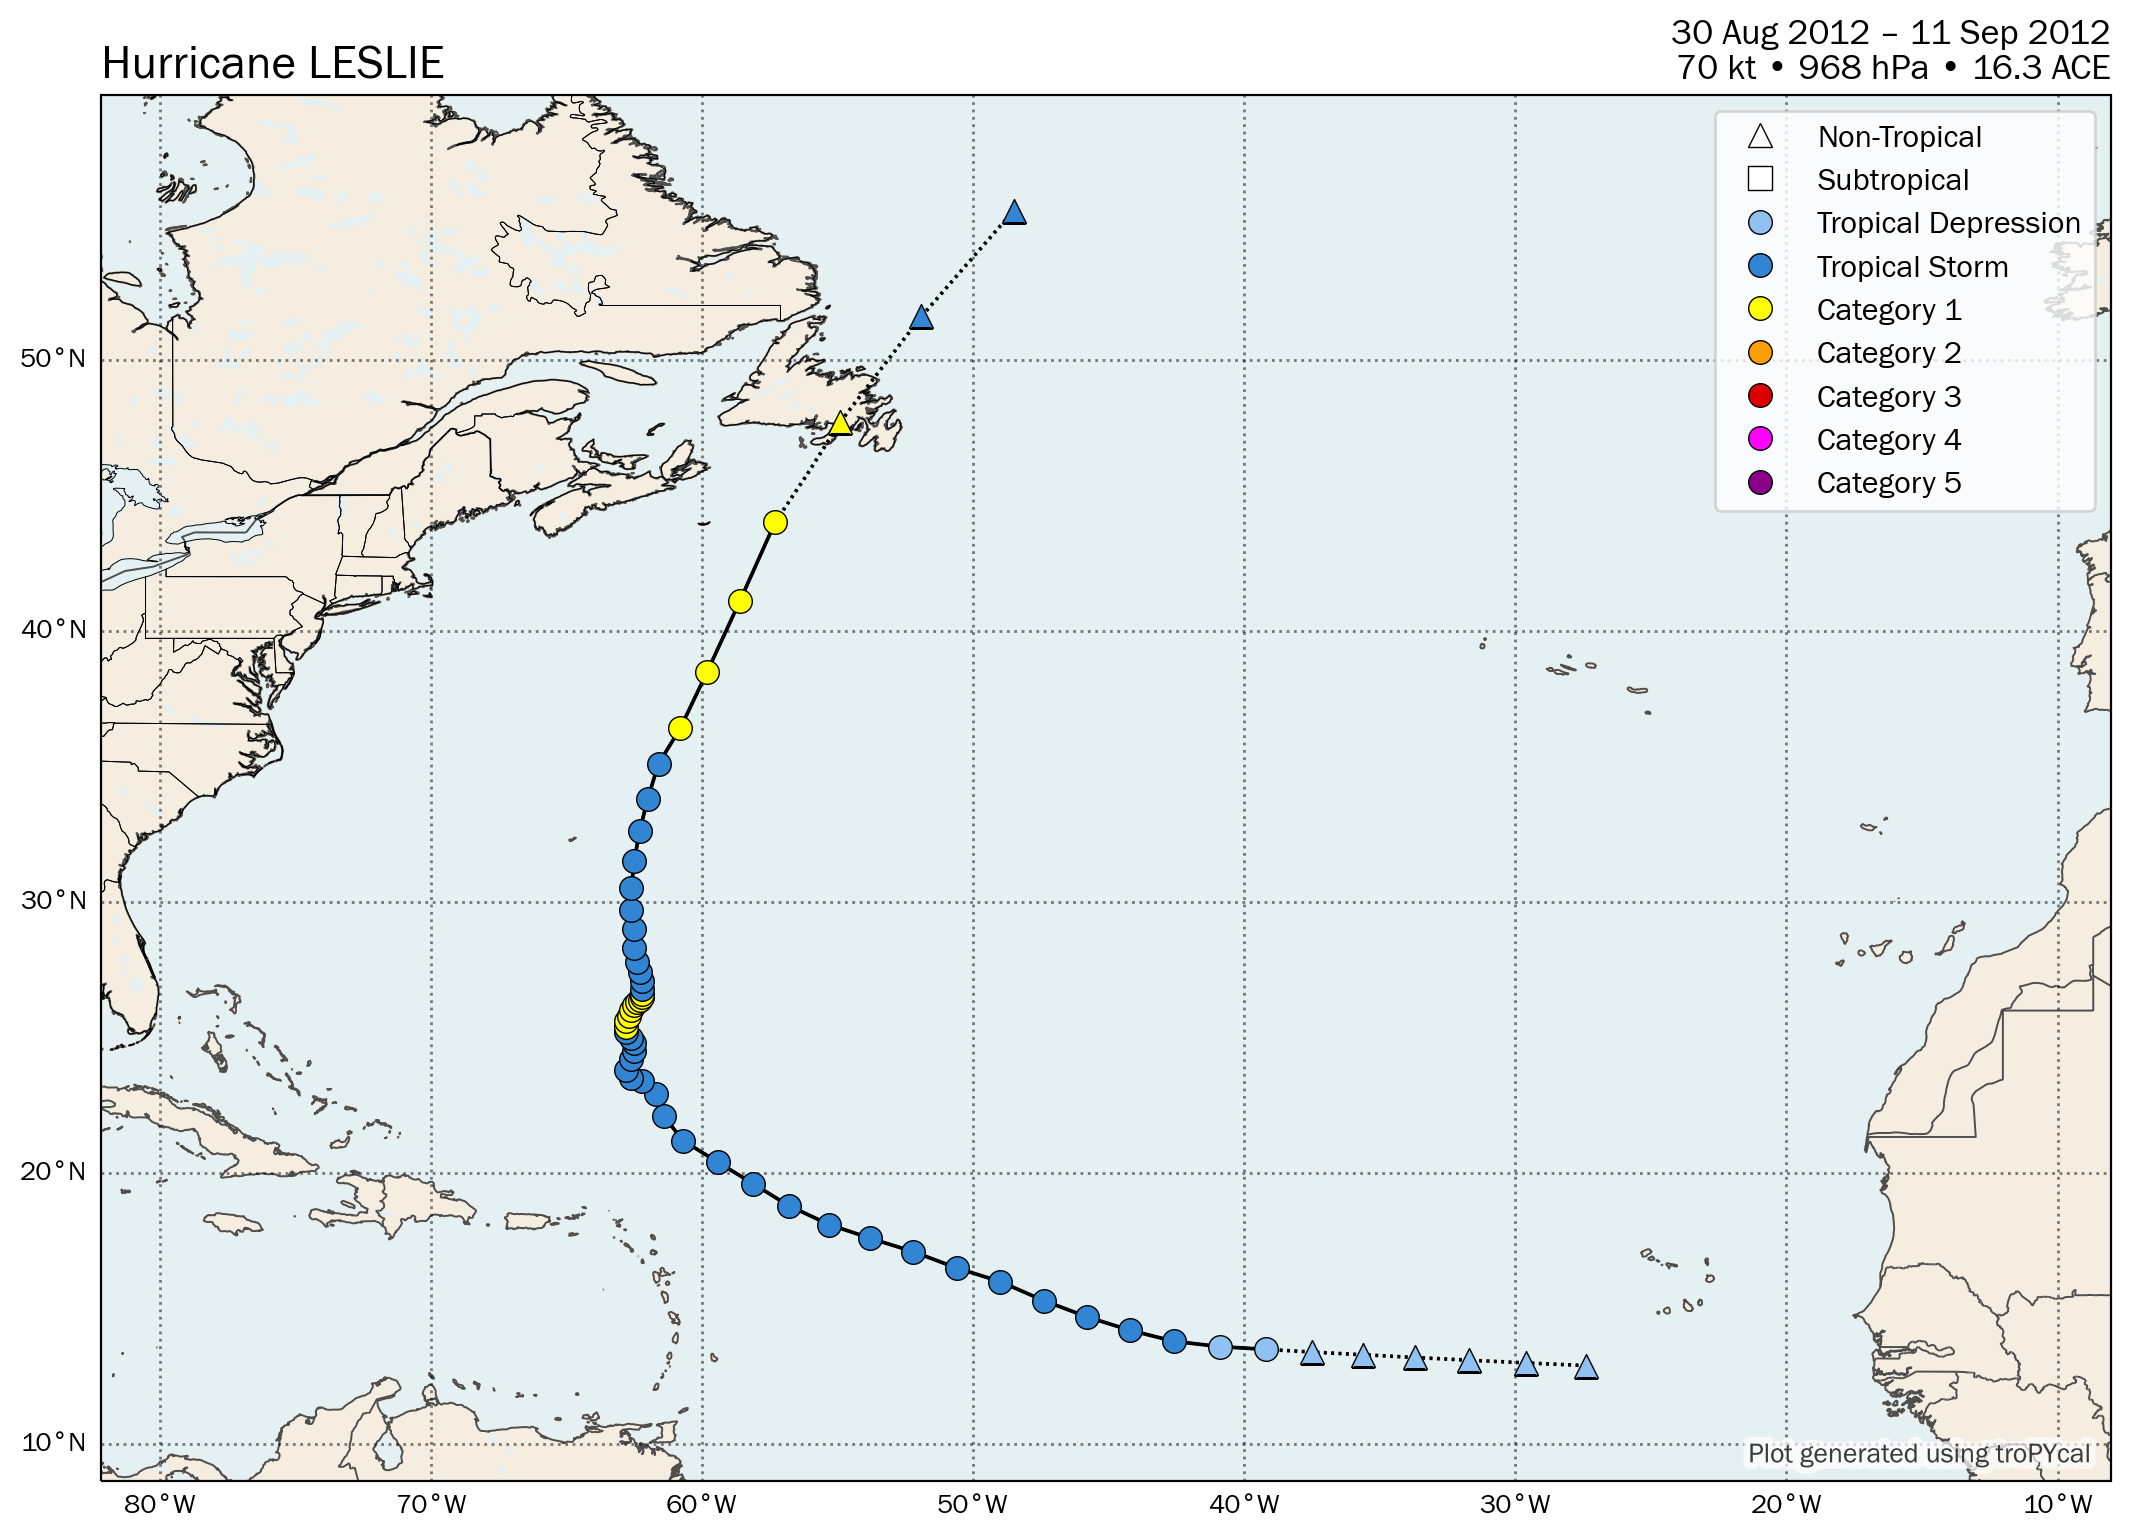
| 1 | Hurricane Leslie | 70 kt | 968 hPa | 00z 08/30 | 06z 09/11 | 16.3 |
| 3 | Hurricane Michael | 100 kt | 964 hPa | 06z 09/03 | 12z 09/11 | 16.7 |
| 1 | Hurricane Nadine | 80 kt | 978 hPa | 12z 09/10 | 18z 10/03 | 26.3 |
| S | Tropical Storm Oscar | 45 kt | 994 hPa | 06z 10/03 | 12z 10/05 | 1.5 |
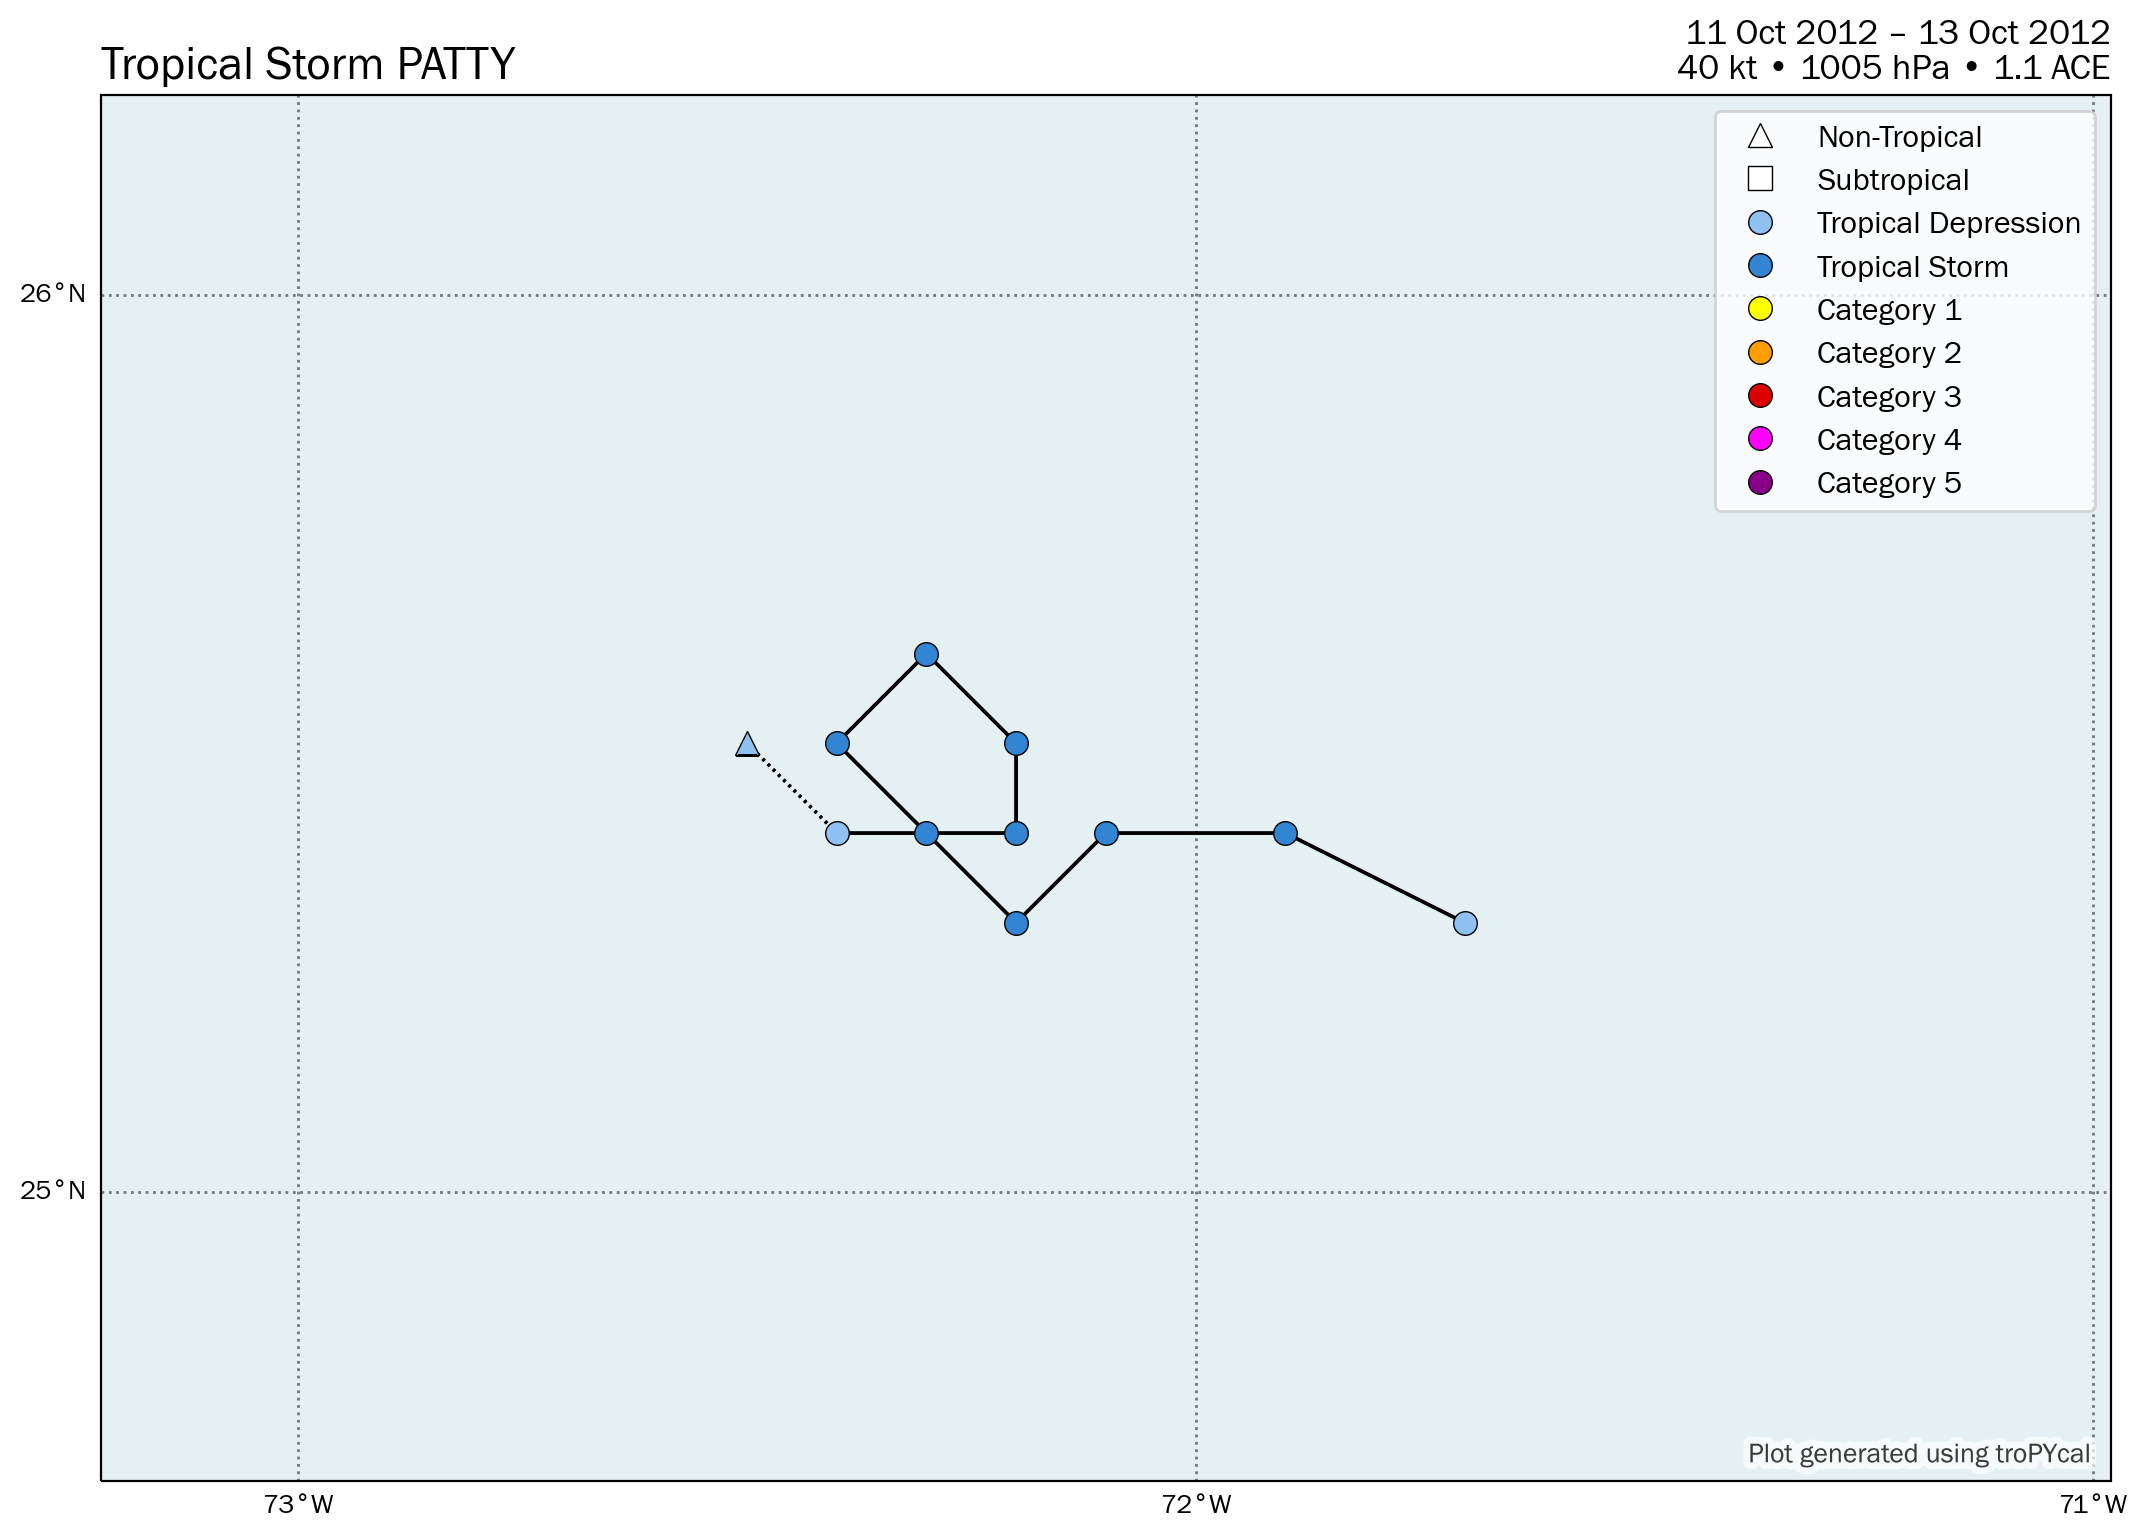
| S | Tropical Storm Patty | 40 kt | 1005 hPa | 00z 10/11 | 06z 10/13 | 1.1 |
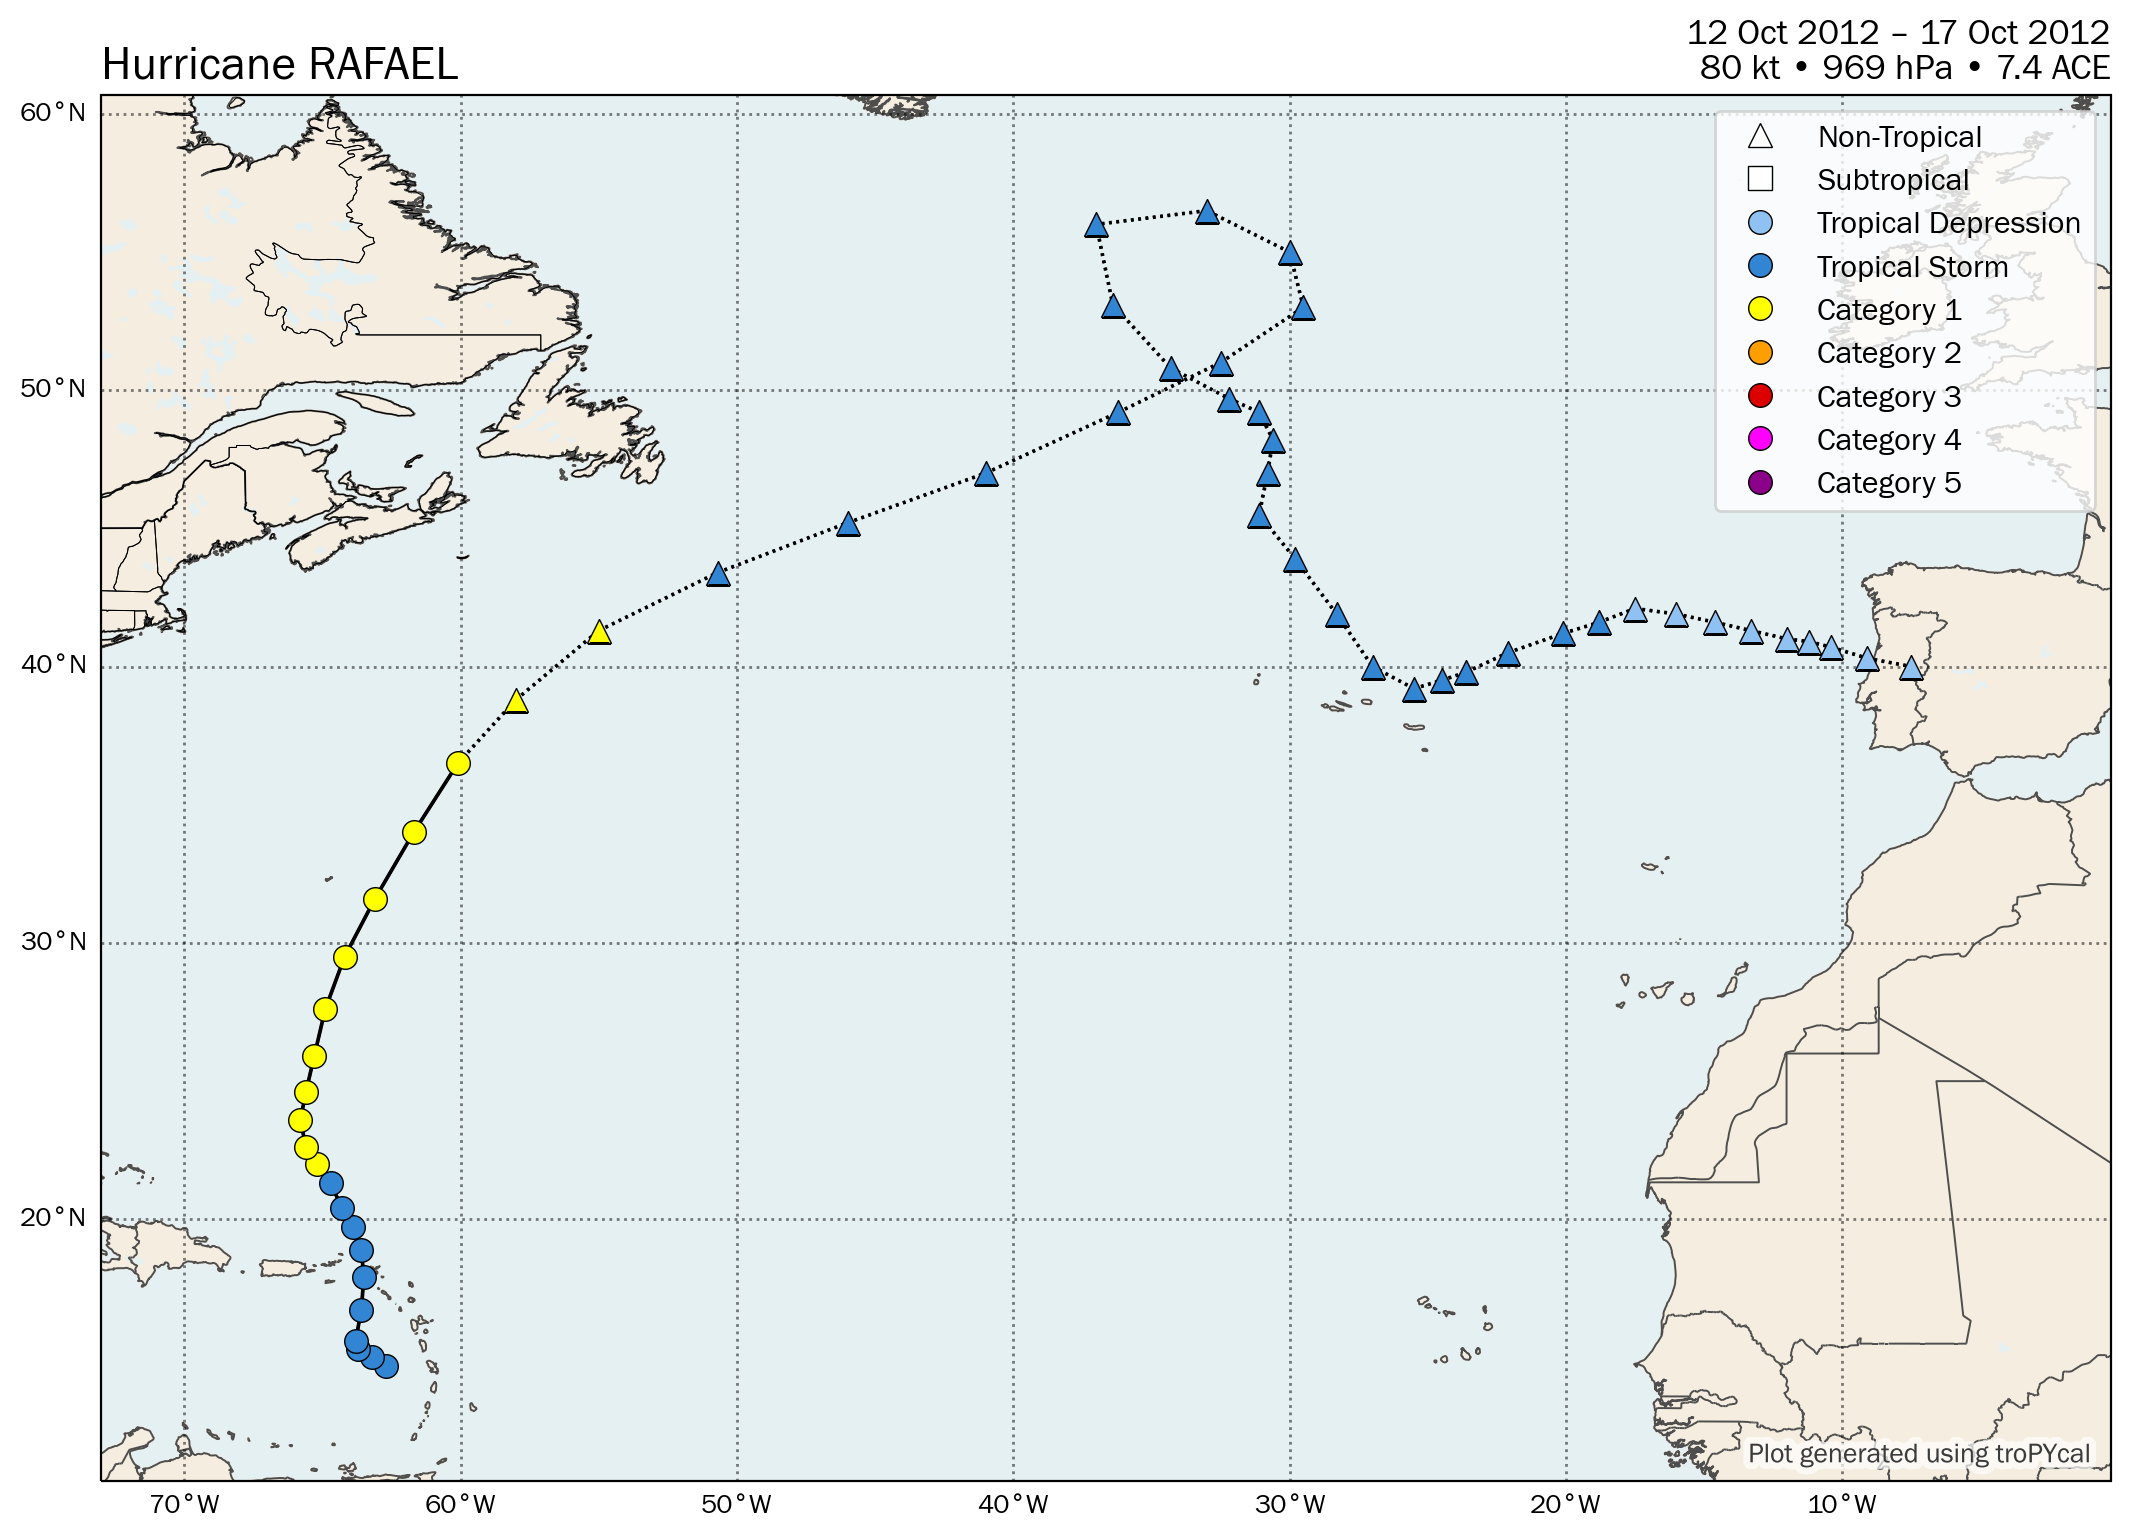
| 1 | Hurricane Rafael | 80 kt | 969 hPa | 18z 10/12 | 12z 10/17 | 7.4 |
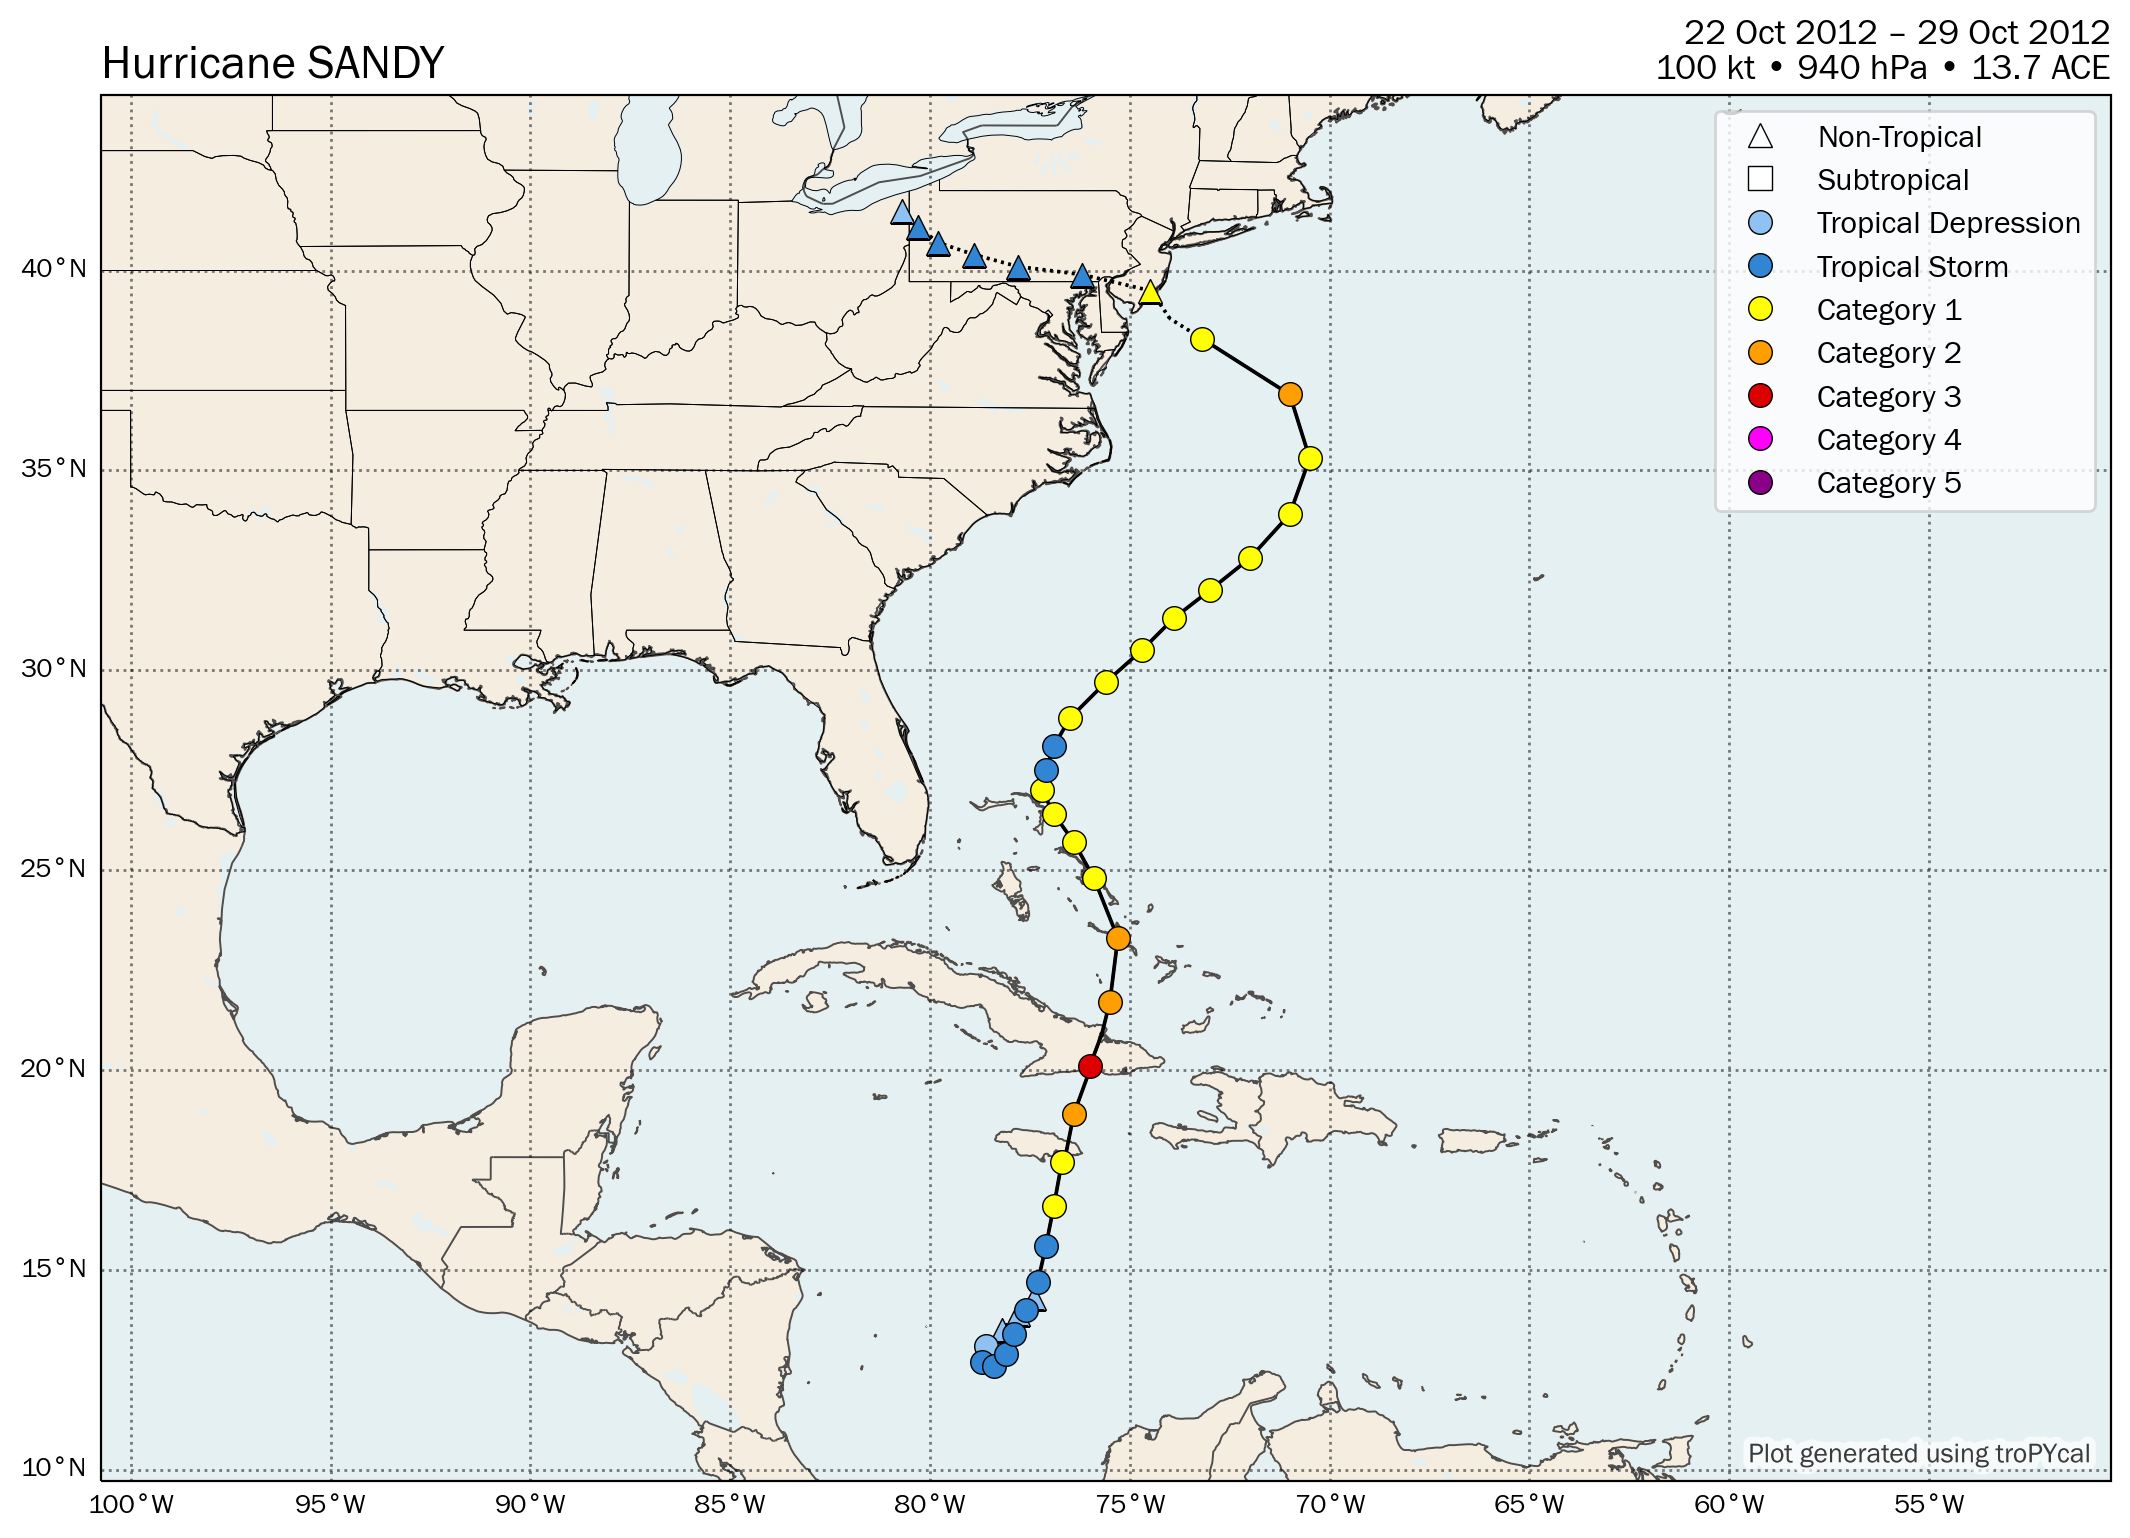
| 3 | Hurricane Sandy | 100 kt | 940 hPa | 12z 10/22 | 18z 10/29 | 13.7 |
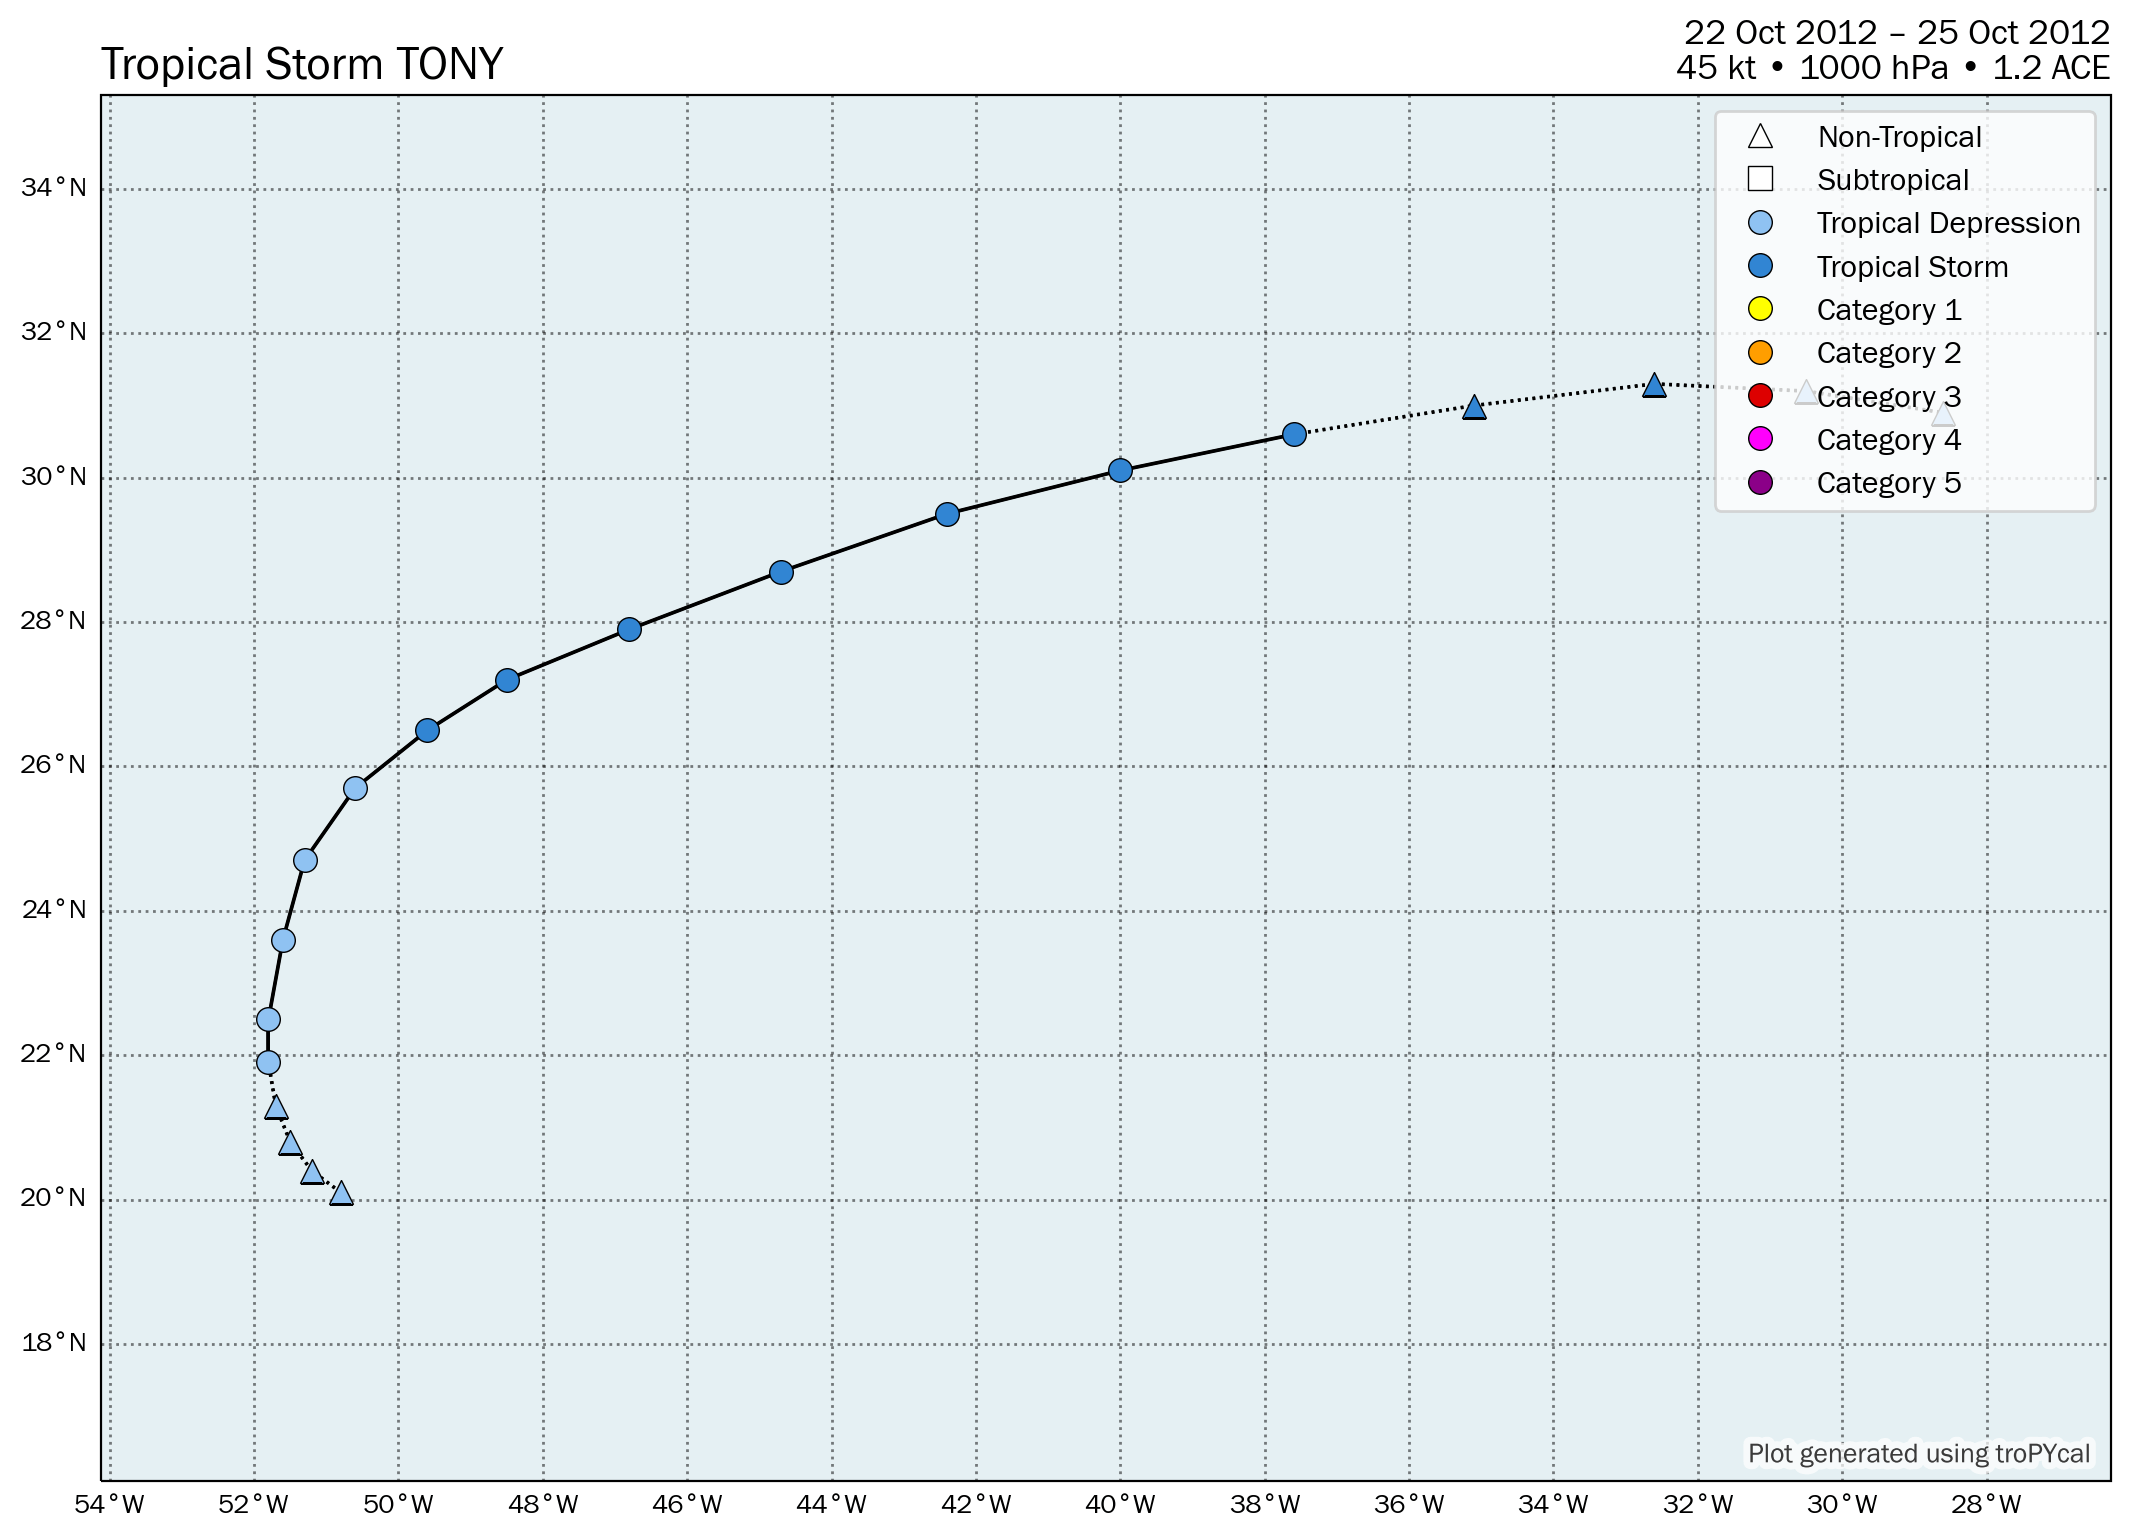
| S | Tropical Storm Tony | 45 kt | 1000 hPa | 18z 10/22 | 12z 10/25 | 1.2 |
Summary Plot

Recon-Derived Wind Swath

Recon-Derived MSLP Swath

| Time (UTC) | Lat | Lon | Wind (mph) | Pressure | Storm Type | Category |
|---|---|---|---|---|---|---|
| 0000 UTC 19 May | 33.1 | -77.0 | 30 | 1010 | Disturbance | - |
| 0600 UTC 19 May | 32.8 | -77.1 | 35 | 1008 | Tropical Depression | - |
| 1200 UTC 19 May | 32.5 | -77.3 | 45 | 1005 | Tropical Storm | - |
| 1800 UTC 19 May | 32.3 | -77.6 | 50 | 997 | Tropical Storm | - |
| 0000 UTC 20 May | 32.1 | -78.1 | 60 | 995 | Tropical Storm | - |
| 0600 UTC 20 May | 31.9 | -78.7 | 50 | 998 | Tropical Storm | - |
| 1200 UTC 20 May | 31.5 | -79.5 | 45 | 1000 | Tropical Storm | - |
| 1800 UTC 20 May | 31.1 | -79.9 | 45 | 1005 | Tropical Storm | - |
| 0000 UTC 21 May | 30.7 | -80.1 | 40 | 1007 | Tropical Storm | - |
| 0600 UTC 21 May | 30.4 | -79.8 | 40 | 1007 | Tropical Storm | - |
| 1200 UTC 21 May | 30.4 | -79.1 | 40 | 1007 | Tropical Storm | - |
| 1800 UTC 21 May | 30.5 | -78.3 | 40 | 1006 | Tropical Storm | - |
| 0000 UTC 22 May | 30.7 | -77.1 | 40 | 1007 | Tropical Storm | - |
| 0600 UTC 22 May | 31.5 | -76.1 | 40 | 1007 | Tropical Storm | - |
| 1200 UTC 22 May | 32.5 | -74.7 | 35 | 1008 | Remnant Low | - |
| 1800 UTC 22 May | 33.4 | -73.4 | 35 | 1008 | Remnant Low | - |
| 0000 UTC 23 May | 34.1 | -71.9 | 30 | 1010 | Remnant Low | - |
| 0600 UTC 23 May | 34.9 | -70.1 | 30 | 1011 | Remnant Low | - |
| 1200 UTC 23 May | 35.5 | -67.9 | 30 | 1012 | Remnant Low | - |
| 1800 UTC 23 May | 35.9 | -66.0 | 30 | 1012 | Remnant Low | - |
Storm-Relative Tornadoes

Tornado Map

Summary Map
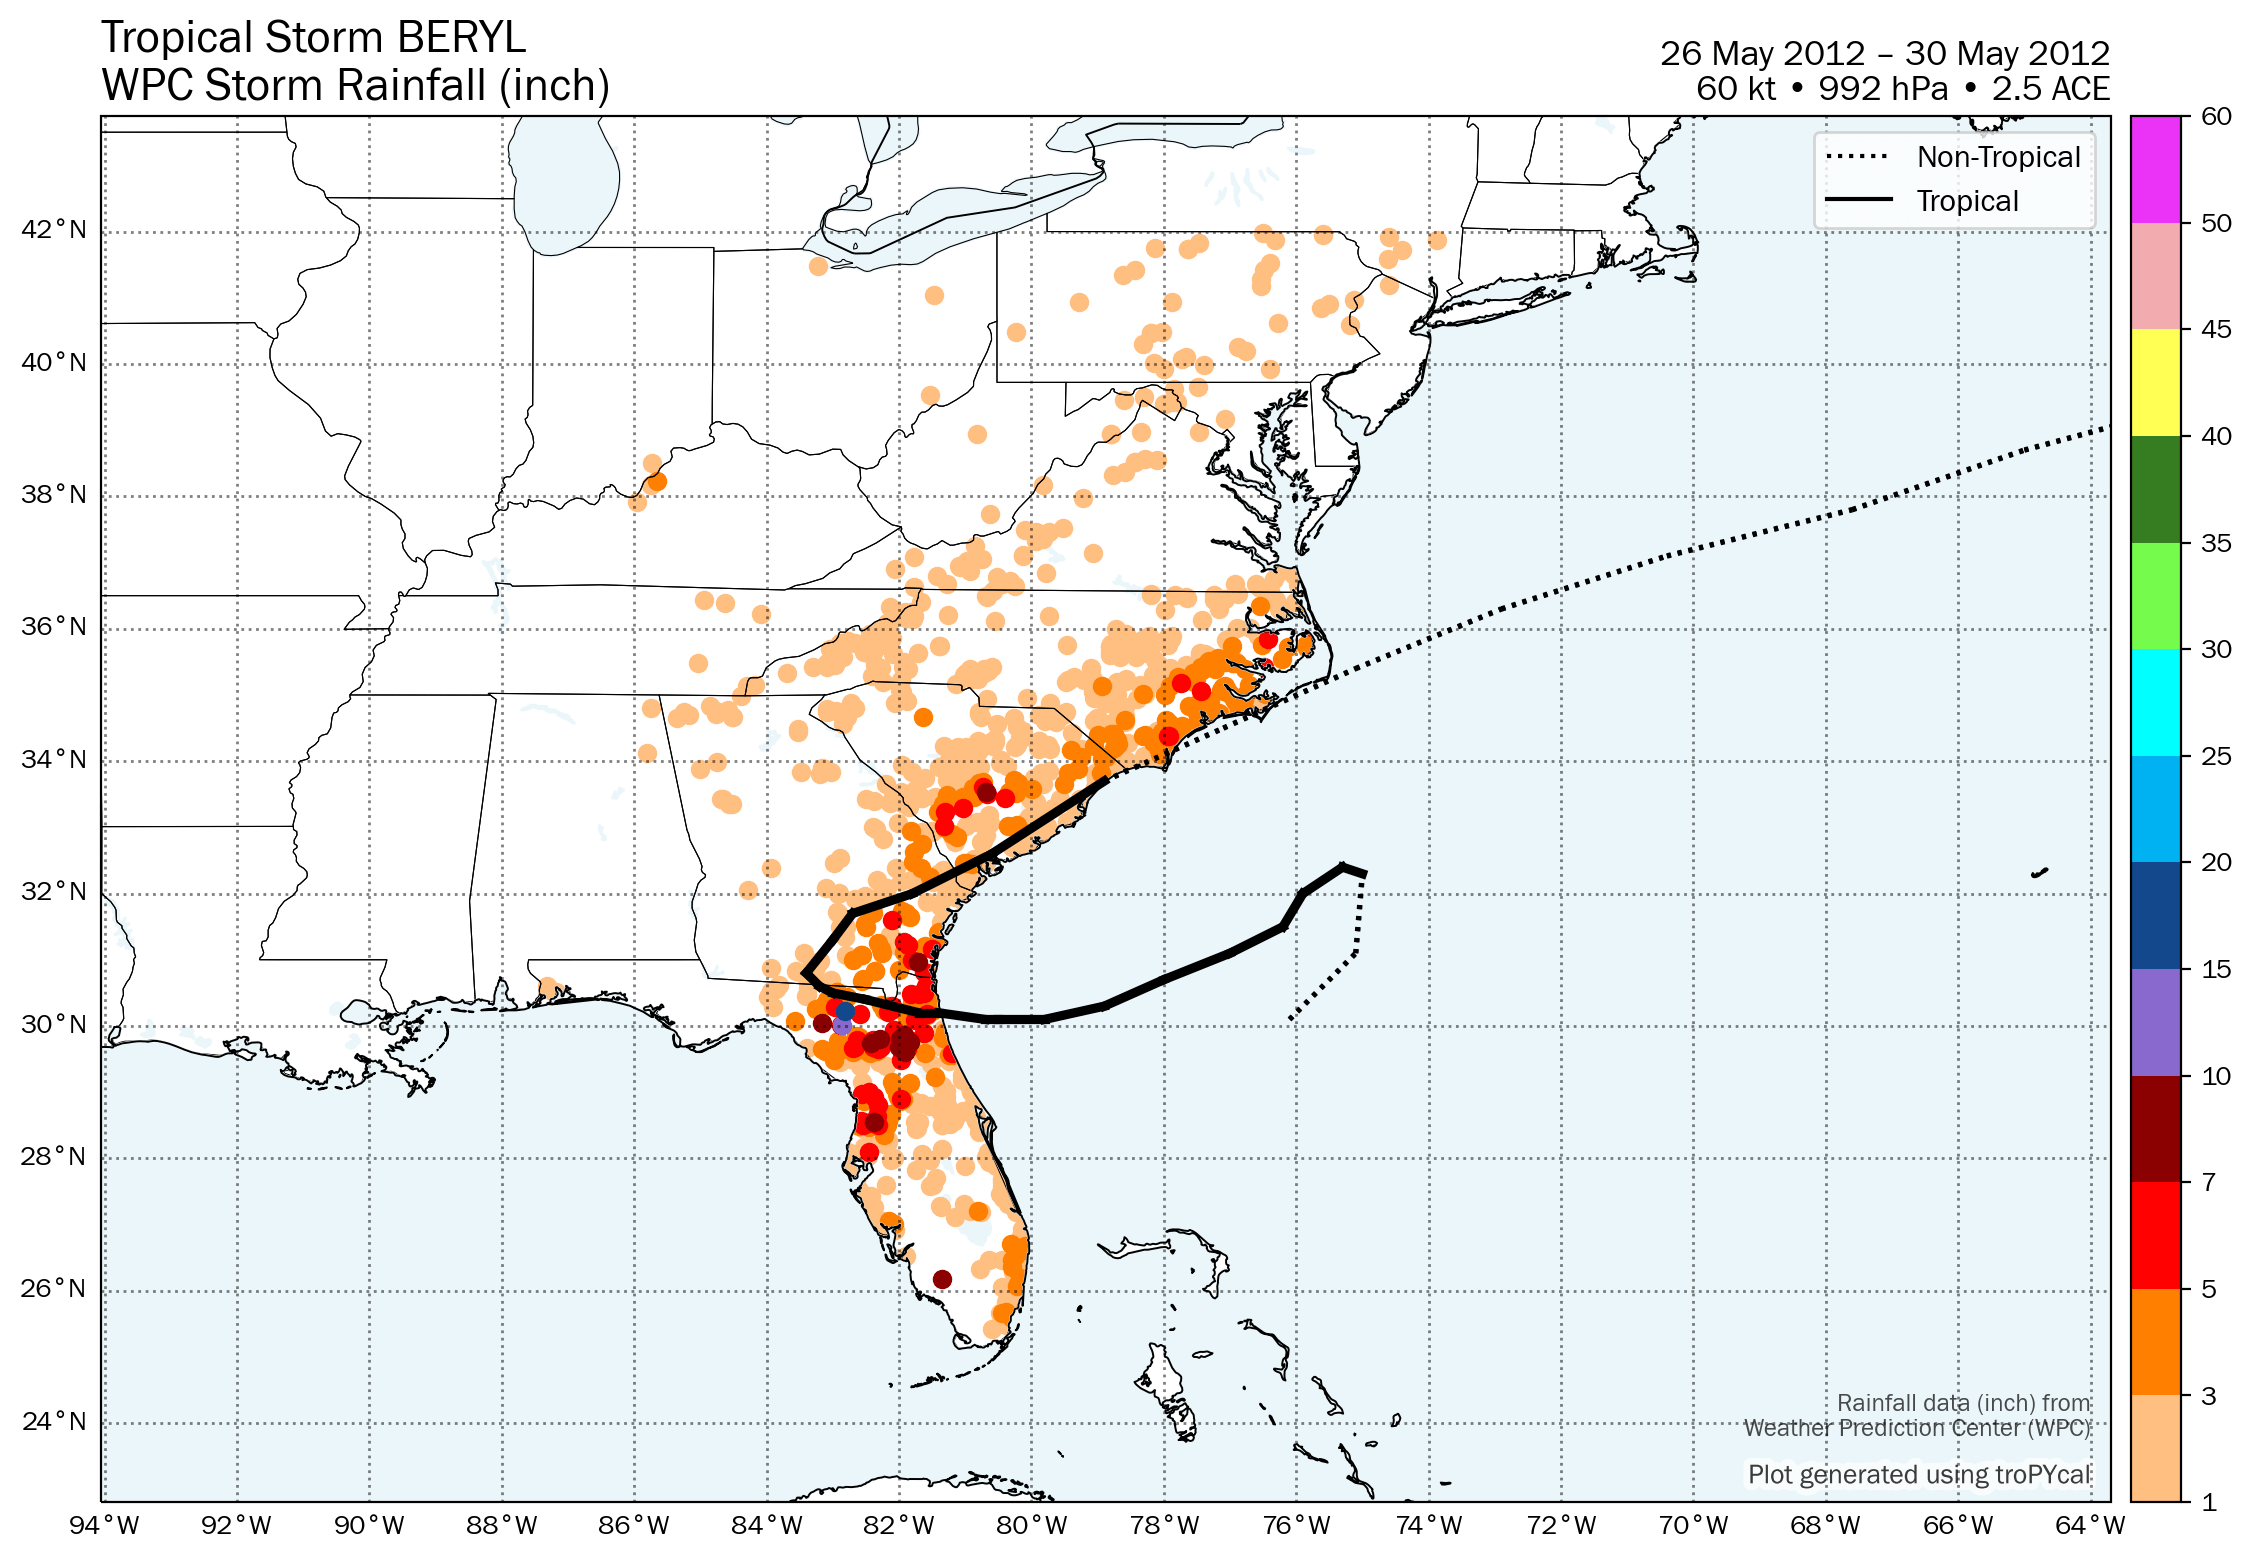
Gridded Rainfall

Summary Plot

Recon-Derived Hovmoller

Recon-Derived Wind Swath

Recon-Derived MSLP Swath

| Time (UTC) | Lat | Lon | Wind (mph) | Pressure | Storm Type | Category |
|---|---|---|---|---|---|---|
| 1200 UTC 25 May | 30.1 | -76.1 | 35 | 1010 | Disturbance | - |
| 1800 UTC 25 May | 31.1 | -75.1 | 40 | 1006 | Disturbance | - |
| 0000 UTC 26 May | 32.3 | -75.0 | 45 | 1001 | Subtropical Storm | - |
| 0600 UTC 26 May | 32.4 | -75.3 | 45 | 1001 | Subtropical Storm | - |
| 1200 UTC 26 May | 32.0 | -75.9 | 45 | 1000 | Subtropical Storm | - |
| 1800 UTC 26 May | 31.5 | -76.2 | 45 | 999 | Subtropical Storm | - |
| 0000 UTC 27 May | 31.1 | -77.0 | 50 | 998 | Subtropical Storm | - |
| 0600 UTC 27 May | 30.7 | -78.0 | 50 | 998 | Subtropical Storm | - |
| 1200 UTC 27 May | 30.3 | -78.9 | 60 | 998 | Subtropical Storm | - |
| 1800 UTC 27 May | 30.1 | -79.8 | 65 | 997 | Tropical Storm | - |
| 2300 UTC 27 May | 30.1 | -80.5 | 70 | 992 | Tropical Storm | - |
| 0000 UTC 28 May | 30.1 | -80.7 | 70 | 993 | Tropical Storm | - |
| 0410 UTC 28 May | 30.2 | -81.4 | 65 | 994 | Tropical Storm | - |
| 0600 UTC 28 May | 30.2 | -81.7 | 60 | 996 | Tropical Storm | - |
| 1200 UTC 28 May | 30.4 | -82.5 | 35 | 1000 | Tropical Depression | - |
| 1800 UTC 28 May | 30.5 | -83.0 | 35 | 1003 | Tropical Depression | - |
| 0000 UTC 29 May | 30.6 | -83.2 | 30 | 1005 | Tropical Depression | - |
| 0600 UTC 29 May | 30.8 | -83.4 | 30 | 1005 | Tropical Depression | - |
| 1200 UTC 29 May | 31.3 | -83.0 | 30 | 1006 | Tropical Depression | - |
| 1800 UTC 29 May | 31.7 | -82.7 | 30 | 1006 | Tropical Depression | - |
| 0000 UTC 30 May | 32.0 | -81.8 | 30 | 1004 | Tropical Depression | - |
| 0600 UTC 30 May | 32.6 | -80.6 | 40 | 1002 | Tropical Storm | - |
| 1200 UTC 30 May | 33.7 | -78.9 | 45 | 1000 | Tropical Storm | - |
| 1800 UTC 30 May | 34.5 | -77.1 | 45 | 997 | Remnant Low | - |
| 0000 UTC 31 May | 35.4 | -75.1 | 50 | 994 | Remnant Low | - |
| 0600 UTC 31 May | 36.3 | -72.9 | 45 | 996 | Remnant Low | - |
| 1200 UTC 31 May | 37.1 | -70.4 | 40 | 998 | Remnant Low | - |
| 1800 UTC 31 May | 37.8 | -67.6 | 40 | 1000 | Remnant Low | - |
| 0000 UTC 01 Jun | 38.7 | -65.0 | 40 | 1001 | Post-Tropical Cyclone | - |
| 0600 UTC 01 Jun | 39.4 | -62.4 | 40 | 1002 | Post-Tropical Cyclone | - |
| 1200 UTC 01 Jun | 39.4 | -59.8 | 40 | 1001 | Post-Tropical Cyclone | - |
| 1800 UTC 01 Jun | 38.5 | -57.5 | 40 | 1000 | Post-Tropical Cyclone | - |
| 0000 UTC 02 Jun | 38.1 | -53.2 | 40 | 1000 | Post-Tropical Cyclone | - |
| Time (UTC) | Lat | Lon | Wind (mph) | Pressure | Storm Type | Category |
|---|---|---|---|---|---|---|
| 0000 UTC 17 Jun | 28.8 | -68.8 | 25 | 1009 | Disturbance | - |
| 0600 UTC 17 Jun | 29.3 | -66.9 | 30 | 1008 | Disturbance | - |
| 1200 UTC 17 Jun | 30.4 | -65.4 | 35 | 1007 | Disturbance | - |
| 1800 UTC 17 Jun | 31.8 | -64.2 | 40 | 1004 | Disturbance | - |
| 0000 UTC 18 Jun | 33.4 | -63.5 | 40 | 1004 | Disturbance | - |
| 0600 UTC 18 Jun | 35.1 | -62.8 | 40 | 1004 | Disturbance | - |
| 1200 UTC 18 Jun | 36.7 | -62.0 | 40 | 1004 | Disturbance | - |
| 1800 UTC 18 Jun | 38.0 | -61.3 | 45 | 1004 | Subtropical Storm | - |
| 0000 UTC 19 Jun | 38.6 | -60.4 | 45 | 1003 | Subtropical Storm | - |
| 0600 UTC 19 Jun | 39.1 | -59.6 | 45 | 1003 | Subtropical Storm | - |
| 1200 UTC 19 Jun | 39.4 | -58.7 | 45 | 1003 | Tropical Storm | - |
| 1800 UTC 19 Jun | 39.5 | -58.0 | 45 | 1003 | Tropical Storm | - |
| 0000 UTC 20 Jun | 38.9 | -56.7 | 45 | 1003 | Tropical Storm | - |
| 0600 UTC 20 Jun | 38.3 | -54.7 | 45 | 1002 | Tropical Storm | - |
| 1200 UTC 20 Jun | 38.1 | -52.5 | 50 | 1001 | Tropical Storm | - |
| 1800 UTC 20 Jun | 38.2 | -50.2 | 60 | 999 | Tropical Storm | - |
| 0000 UTC 21 Jun | 38.6 | -47.5 | 70 | 991 | Tropical Storm | - |
| 0600 UTC 21 Jun | 39.5 | -45.5 | 80 | 982 | Hurricane | 1 |
| 1200 UTC 21 Jun | 40.5 | -43.9 | 85 | 974 | Hurricane | 1 |
| 1800 UTC 21 Jun | 41.9 | -42.9 | 80 | 975 | Hurricane | 1 |
| 0000 UTC 22 Jun | 43.3 | -42.8 | 70 | 978 | Tropical Storm | - |
| 0600 UTC 22 Jun | 44.5 | -43.9 | 60 | 982 | Tropical Storm | - |
| 1200 UTC 22 Jun | 44.8 | -45.8 | 50 | 985 | Post-Tropical Cyclone | - |
| 1800 UTC 22 Jun | 44.2 | -47.8 | 45 | 988 | Post-Tropical Cyclone | - |
| 0000 UTC 23 Jun | 42.6 | -48.4 | 40 | 989 | Post-Tropical Cyclone | - |
| 0600 UTC 23 Jun | 40.9 | -47.4 | 40 | 989 | Post-Tropical Cyclone | - |
| 1200 UTC 23 Jun | 40.0 | -45.0 | 40 | 990 | Post-Tropical Cyclone | - |
| 1800 UTC 23 Jun | 40.5 | -42.5 | 35 | 991 | Post-Tropical Cyclone | - |
| 0000 UTC 24 Jun | 41.4 | -40.2 | 35 | 991 | Post-Tropical Cyclone | - |
| 0600 UTC 24 Jun | 42.9 | -38.5 | 30 | 993 | Post-Tropical Cyclone | - |
| 1200 UTC 24 Jun | 43.7 | -38.2 | 25 | 995 | Post-Tropical Cyclone | - |
Storm-Relative Tornadoes

Tornado Map

Summary Map
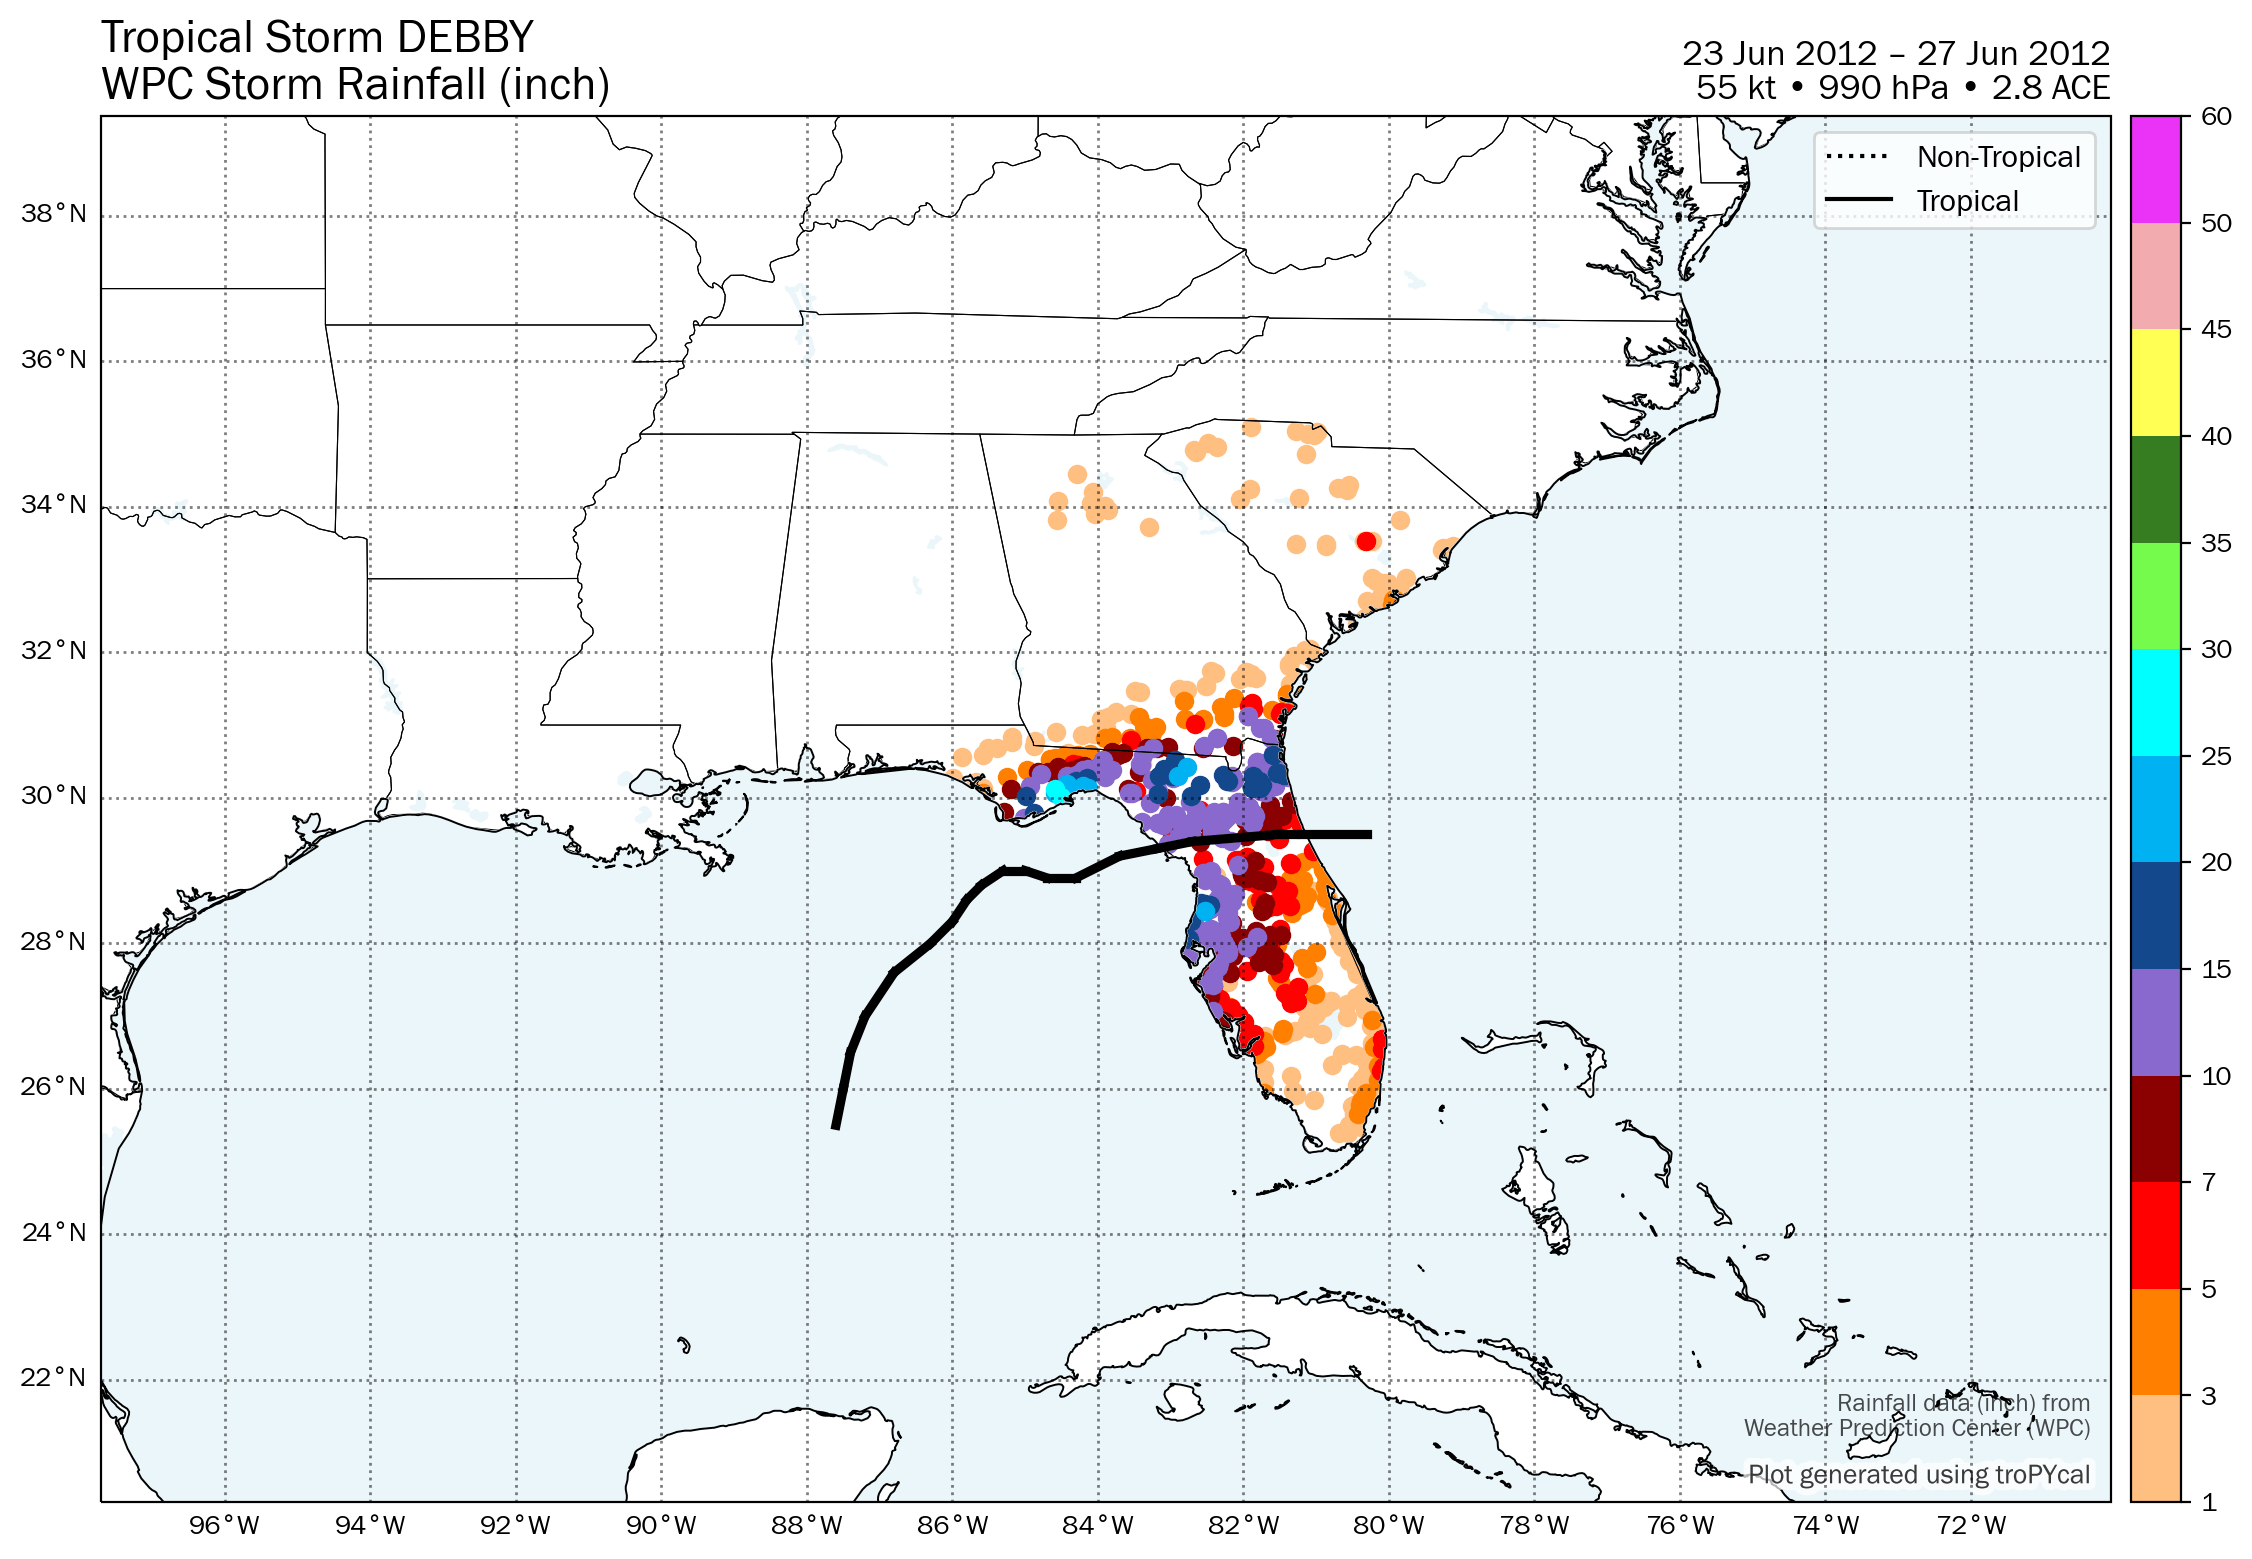
Gridded Rainfall

Summary Plot

Recon-Derived Hovmoller

Recon-Derived Wind Swath

Recon-Derived MSLP Swath

| Time (UTC) | Lat | Lon | Wind (mph) | Pressure | Storm Type | Category |
|---|---|---|---|---|---|---|
| 1200 UTC 23 Jun | 25.5 | -87.6 | 40 | 1002 | Tropical Storm | - |
| 1800 UTC 23 Jun | 26.0 | -87.5 | 45 | 1001 | Tropical Storm | - |
| 0000 UTC 24 Jun | 26.5 | -87.4 | 50 | 998 | Tropical Storm | - |
| 0600 UTC 24 Jun | 27.0 | -87.2 | 60 | 995 | Tropical Storm | - |
| 1200 UTC 24 Jun | 27.6 | -86.8 | 65 | 994 | Tropical Storm | - |
| 1800 UTC 24 Jun | 28.0 | -86.3 | 65 | 992 | Tropical Storm | - |
| 0000 UTC 25 Jun | 28.3 | -86.0 | 60 | 990 | Tropical Storm | - |
| 0600 UTC 25 Jun | 28.6 | -85.8 | 50 | 993 | Tropical Storm | - |
| 1200 UTC 25 Jun | 28.8 | -85.6 | 45 | 994 | Tropical Storm | - |
| 1800 UTC 25 Jun | 29.0 | -85.3 | 45 | 992 | Tropical Storm | - |
| 0000 UTC 26 Jun | 29.0 | -85.0 | 50 | 991 | Tropical Storm | - |
| 0600 UTC 26 Jun | 28.9 | -84.7 | 45 | 991 | Tropical Storm | - |
| 1200 UTC 26 Jun | 28.9 | -84.3 | 45 | 992 | Tropical Storm | - |
| 1800 UTC 26 Jun | 29.2 | -83.7 | 40 | 995 | Tropical Storm | - |
| 2100 UTC 26 Jun | 29.3 | -83.2 | 40 | 995 | Tropical Storm | - |
| 0000 UTC 27 Jun | 29.4 | -82.7 | 35 | 997 | Tropical Depression | - |
| 0600 UTC 27 Jun | 29.5 | -81.5 | 35 | 998 | Tropical Depression | - |
| 1200 UTC 27 Jun | 29.5 | -80.3 | 35 | 1001 | Tropical Depression | - |
Summary Plot

Recon-Derived Hovmoller

Recon-Derived Wind Swath

Recon-Derived MSLP Swath

| Time (UTC) | Lat | Lon | Wind (mph) | Pressure | Storm Type | Category |
|---|---|---|---|---|---|---|
| 1200 UTC 01 Aug | 11.6 | -46.7 | 35 | 1008 | Tropical Depression | - |
| 1800 UTC 01 Aug | 12.0 | -48.2 | 35 | 1008 | Tropical Depression | - |
| 0000 UTC 02 Aug | 12.4 | -49.9 | 35 | 1008 | Tropical Depression | - |
| 0600 UTC 02 Aug | 12.7 | -51.7 | 35 | 1008 | Tropical Depression | - |
| 1200 UTC 02 Aug | 13.0 | -53.6 | 40 | 1007 | Tropical Storm | - |
| 1800 UTC 02 Aug | 13.2 | -55.5 | 50 | 1006 | Tropical Storm | - |
| 0000 UTC 03 Aug | 13.4 | -57.5 | 50 | 1005 | Tropical Storm | - |
| 0600 UTC 03 Aug | 13.6 | -59.7 | 45 | 1005 | Tropical Storm | - |
| 1200 UTC 03 Aug | 13.7 | -61.6 | 45 | 1003 | Tropical Storm | - |
| 1800 UTC 03 Aug | 13.8 | -63.3 | 45 | 1003 | Tropical Storm | - |
| 0000 UTC 04 Aug | 13.8 | -64.8 | 45 | 1004 | Tropical Storm | - |
| 0600 UTC 04 Aug | 13.9 | -66.4 | 50 | 1005 | Tropical Storm | - |
| 1200 UTC 04 Aug | 14.2 | -67.9 | 50 | 1005 | Tropical Storm | - |
| 1800 UTC 04 Aug | 14.6 | -69.5 | 50 | 1005 | Tropical Storm | - |
| 0000 UTC 05 Aug | 15.0 | -71.5 | 50 | 1006 | Tropical Storm | - |
| 0600 UTC 05 Aug | 15.0 | -73.8 | 50 | 1006 | Tropical Storm | - |
| 1200 UTC 05 Aug | 15.0 | -76.1 | 50 | 1006 | Tropical Storm | - |
| 1800 UTC 05 Aug | 15.1 | -77.8 | 50 | 1005 | Tropical Storm | - |
| 0000 UTC 06 Aug | 15.2 | -78.9 | 50 | 1003 | Tropical Storm | - |
| 0600 UTC 06 Aug | 15.4 | -79.6 | 60 | 998 | Tropical Storm | - |
| 1200 UTC 06 Aug | 15.7 | -80.2 | 65 | 996 | Tropical Storm | - |
| 1800 UTC 06 Aug | 16.2 | -81.2 | 65 | 995 | Tropical Storm | - |
| 0000 UTC 07 Aug | 16.7 | -82.2 | 65 | 994 | Tropical Storm | - |
| 0600 UTC 07 Aug | 17.3 | -83.3 | 65 | 993 | Tropical Storm | - |
| 1200 UTC 07 Aug | 17.8 | -84.4 | 75 | 988 | Hurricane | 1 |
| 1800 UTC 07 Aug | 18.4 | -85.7 | 85 | 983 | Hurricane | 1 |
| 0000 UTC 08 Aug | 18.7 | -87.1 | 90 | 979 | Hurricane | 1 |
| 0100 UTC 08 Aug | 18.7 | -87.2 | 90 | 977 | Hurricane | 1 |
| 0315 UTC 08 Aug | 18.8 | -87.7 | 100 | 973 | Hurricane | 2 |
| 0600 UTC 08 Aug | 18.8 | -88.3 | 90 | 973 | Hurricane | 1 |
| 1200 UTC 08 Aug | 18.8 | -89.6 | 70 | 983 | Tropical Storm | - |
| 1800 UTC 08 Aug | 18.8 | -90.8 | 60 | 993 | Tropical Storm | - |
| 0000 UTC 09 Aug | 18.8 | -91.7 | 65 | 993 | Tropical Storm | - |
| 0600 UTC 09 Aug | 18.7 | -92.8 | 70 | 992 | Tropical Storm | - |
| 1200 UTC 09 Aug | 18.4 | -93.8 | 65 | 989 | Tropical Storm | - |
| 1615 UTC 09 Aug | 18.3 | -94.6 | 65 | 989 | Tropical Storm | - |
| 1800 UTC 09 Aug | 18.2 | -94.9 | 60 | 993 | Tropical Storm | - |
| 0000 UTC 10 Aug | 18.0 | -96.0 | 45 | 997 | Tropical Storm | - |
| 0600 UTC 10 Aug | 17.9 | -97.2 | 35 | 1002 | Tropical Depression | - |
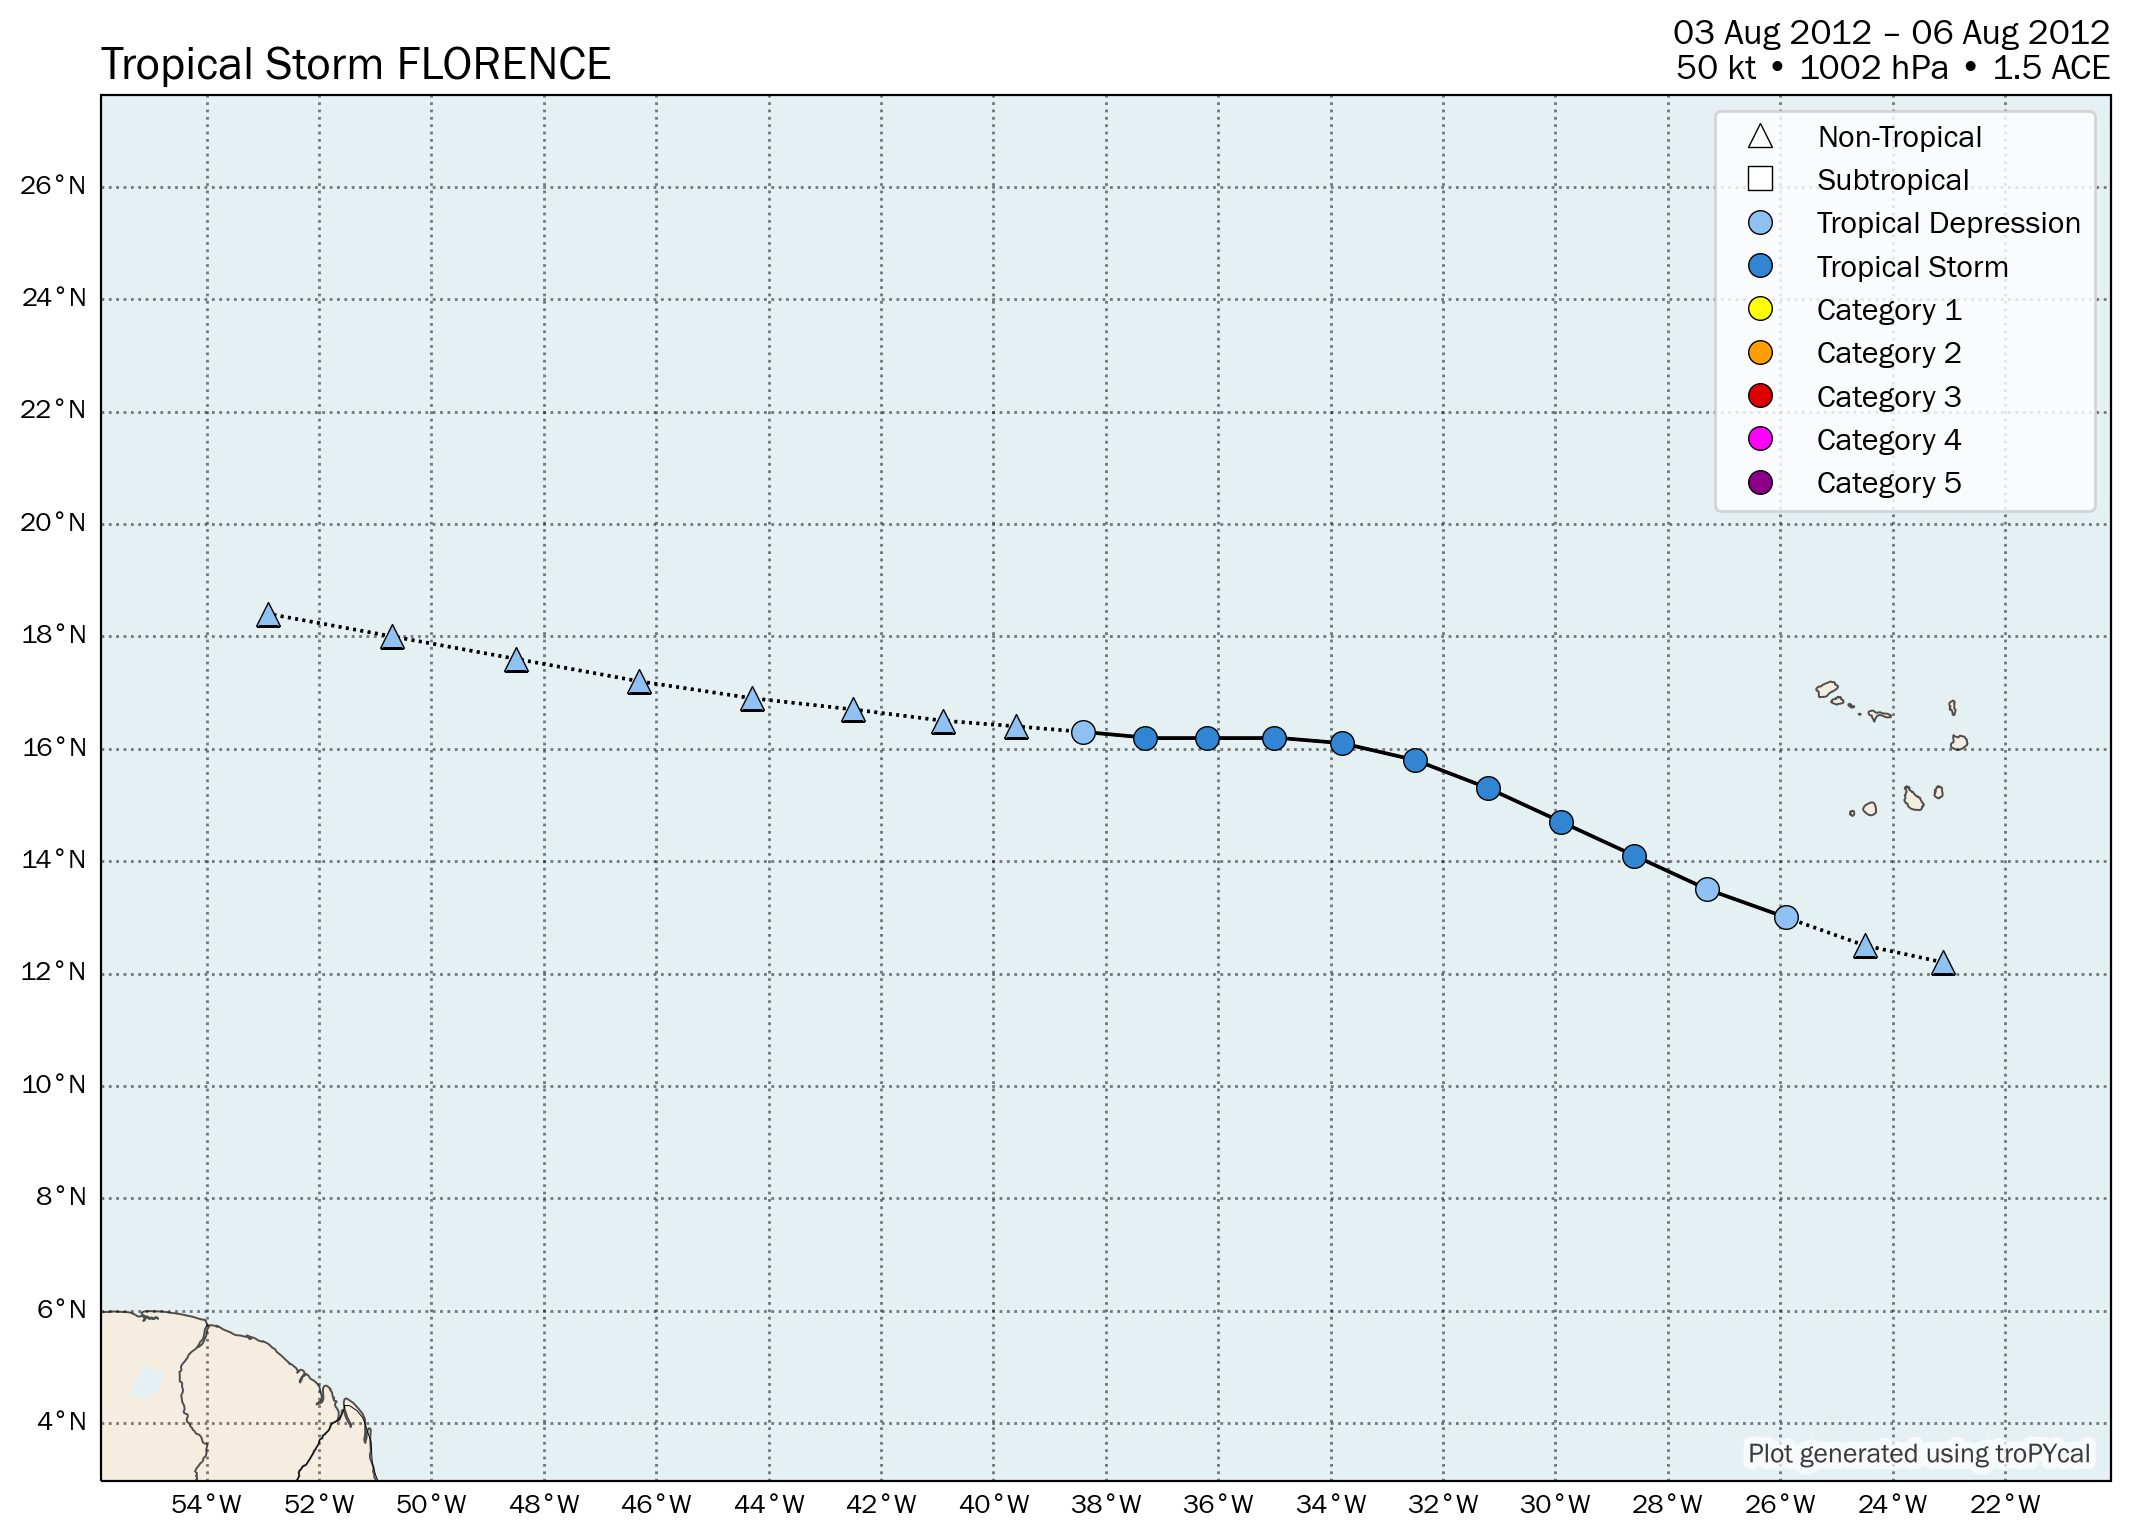
| Time (UTC) | Lat | Lon | Wind (mph) | Pressure | Storm Type | Category |
|---|---|---|---|---|---|---|
| 0600 UTC 03 Aug | 12.2 | -23.1 | 30 | 1011 | Disturbance | - |
| 1200 UTC 03 Aug | 12.5 | -24.5 | 35 | 1010 | Disturbance | - |
| 1800 UTC 03 Aug | 13.0 | -25.9 | 35 | 1009 | Tropical Depression | - |
| 0000 UTC 04 Aug | 13.5 | -27.3 | 35 | 1009 | Tropical Depression | - |
| 0600 UTC 04 Aug | 14.1 | -28.6 | 40 | 1007 | Tropical Storm | - |
| 1200 UTC 04 Aug | 14.7 | -29.9 | 45 | 1005 | Tropical Storm | - |
| 1800 UTC 04 Aug | 15.3 | -31.2 | 50 | 1003 | Tropical Storm | - |
| 0000 UTC 05 Aug | 15.8 | -32.5 | 60 | 1002 | Tropical Storm | - |
| 0600 UTC 05 Aug | 16.1 | -33.8 | 60 | 1002 | Tropical Storm | - |
| 1200 UTC 05 Aug | 16.2 | -35.0 | 50 | 1004 | Tropical Storm | - |
| 1800 UTC 05 Aug | 16.2 | -36.2 | 50 | 1005 | Tropical Storm | - |
| 0000 UTC 06 Aug | 16.2 | -37.3 | 40 | 1008 | Tropical Storm | - |
| 0600 UTC 06 Aug | 16.3 | -38.4 | 35 | 1009 | Tropical Depression | - |
| 1200 UTC 06 Aug | 16.4 | -39.6 | 35 | 1009 | Remnant Low | - |
| 1800 UTC 06 Aug | 16.5 | -40.9 | 35 | 1009 | Remnant Low | - |
| 0000 UTC 07 Aug | 16.7 | -42.5 | 30 | 1010 | Remnant Low | - |
| 0600 UTC 07 Aug | 16.9 | -44.3 | 30 | 1010 | Remnant Low | - |
| 1200 UTC 07 Aug | 17.2 | -46.3 | 30 | 1010 | Remnant Low | - |
| 1800 UTC 07 Aug | 17.6 | -48.5 | 30 | 1011 | Remnant Low | - |
| 0000 UTC 08 Aug | 18.0 | -50.7 | 30 | 1011 | Remnant Low | - |
| 0600 UTC 08 Aug | 18.4 | -52.9 | 30 | 1011 | Remnant Low | - |
Summary Plot

Recon-Derived Wind Swath

Recon-Derived MSLP Swath

| Time (UTC) | Lat | Lon | Wind (mph) | Pressure | Storm Type | Category |
|---|---|---|---|---|---|---|
| 1800 UTC 09 Aug | 13.7 | -43.0 | 35 | 1010 | Tropical Depression | - |
| 0000 UTC 10 Aug | 13.6 | -44.6 | 35 | 1009 | Tropical Depression | - |
| 0600 UTC 10 Aug | 13.5 | -46.3 | 35 | 1008 | Tropical Depression | - |
| 1200 UTC 10 Aug | 13.4 | -48.2 | 35 | 1009 | Tropical Depression | - |
| 1800 UTC 10 Aug | 13.4 | -50.5 | 35 | 1009 | Tropical Depression | - |
| 0000 UTC 11 Aug | 13.4 | -52.9 | 35 | 1009 | Tropical Depression | - |
| 0600 UTC 11 Aug | 13.4 | -55.4 | 35 | 1009 | Tropical Depression | - |
| 1200 UTC 11 Aug | 13.3 | -57.9 | 35 | 1011 | Remnant Low | - |
| 1800 UTC 11 Aug | 13.3 | -59.9 | 35 | 1011 | Remnant Low | - |
| 0000 UTC 12 Aug | 13.5 | -61.4 | 35 | 1011 | Remnant Low | - |
| 0600 UTC 12 Aug | 13.7 | -63.2 | 35 | 1011 | Remnant Low | - |
| 1200 UTC 12 Aug | 13.9 | -65.6 | 35 | 1011 | Remnant Low | - |
| 1800 UTC 12 Aug | 14.1 | -68.0 | 35 | 1010 | Remnant Low | - |
| 0000 UTC 13 Aug | 14.1 | -70.4 | 35 | 1009 | Remnant Low | - |
| 0600 UTC 13 Aug | 14.1 | -72.7 | 35 | 1009 | Remnant Low | - |
| 1200 UTC 13 Aug | 14.1 | -74.9 | 35 | 1008 | Remnant Low | - |
| 1800 UTC 13 Aug | 14.1 | -76.6 | 35 | 1008 | Remnant Low | - |
| 0000 UTC 14 Aug | 14.1 | -78.4 | 35 | 1008 | Remnant Low | - |
| 0600 UTC 14 Aug | 14.1 | -80.1 | 35 | 1009 | Remnant Low | - |
| 1200 UTC 14 Aug | 14.1 | -81.8 | 35 | 1009 | Remnant Low | - |
| 1800 UTC 14 Aug | 14.3 | -83.6 | 35 | 1009 | Remnant Low | - |
| 0000 UTC 15 Aug | 14.7 | -85.3 | 35 | 1010 | Remnant Low | - |
| 0600 UTC 15 Aug | 15.2 | -87.0 | 35 | 1010 | Remnant Low | - |
| 1200 UTC 15 Aug | 15.7 | -88.6 | 35 | 1011 | Remnant Low | - |
| 1800 UTC 15 Aug | 16.5 | -89.5 | 30 | 1011 | Remnant Low | - |
| 0000 UTC 16 Aug | 17.5 | -90.5 | 30 | 1011 | Remnant Low | - |
| 0600 UTC 16 Aug | 18.5 | -91.0 | 30 | 1011 | Remnant Low | - |
| 1200 UTC 16 Aug | 19.2 | -91.5 | 30 | 1011 | Remnant Low | - |
| 1800 UTC 16 Aug | 19.3 | -92.6 | 30 | 1011 | Remnant Low | - |
| 0000 UTC 17 Aug | 19.3 | -94.2 | 30 | 1011 | Remnant Low | - |
| 0600 UTC 17 Aug | 19.7 | -95.2 | 30 | 1011 | Remnant Low | - |
| 1200 UTC 17 Aug | 19.9 | -95.7 | 35 | 1009 | Tropical Depression | - |
| 1800 UTC 17 Aug | 20.3 | -95.9 | 45 | 1004 | Tropical Storm | - |
| 0000 UTC 18 Aug | 20.8 | -96.1 | 40 | 1006 | Tropical Storm | - |
| 0600 UTC 18 Aug | 21.4 | -96.8 | 35 | 1007 | Tropical Depression | - |
| 1200 UTC 18 Aug | 21.9 | -97.7 | 35 | 1008 | Tropical Depression | - |
| 1800 UTC 18 Aug | 22.5 | -98.7 | 30 | 1009 | Tropical Depression | - |
| 0000 UTC 19 Aug | 22.7 | -98.9 | 30 | 1009 | Remnant Low | - |
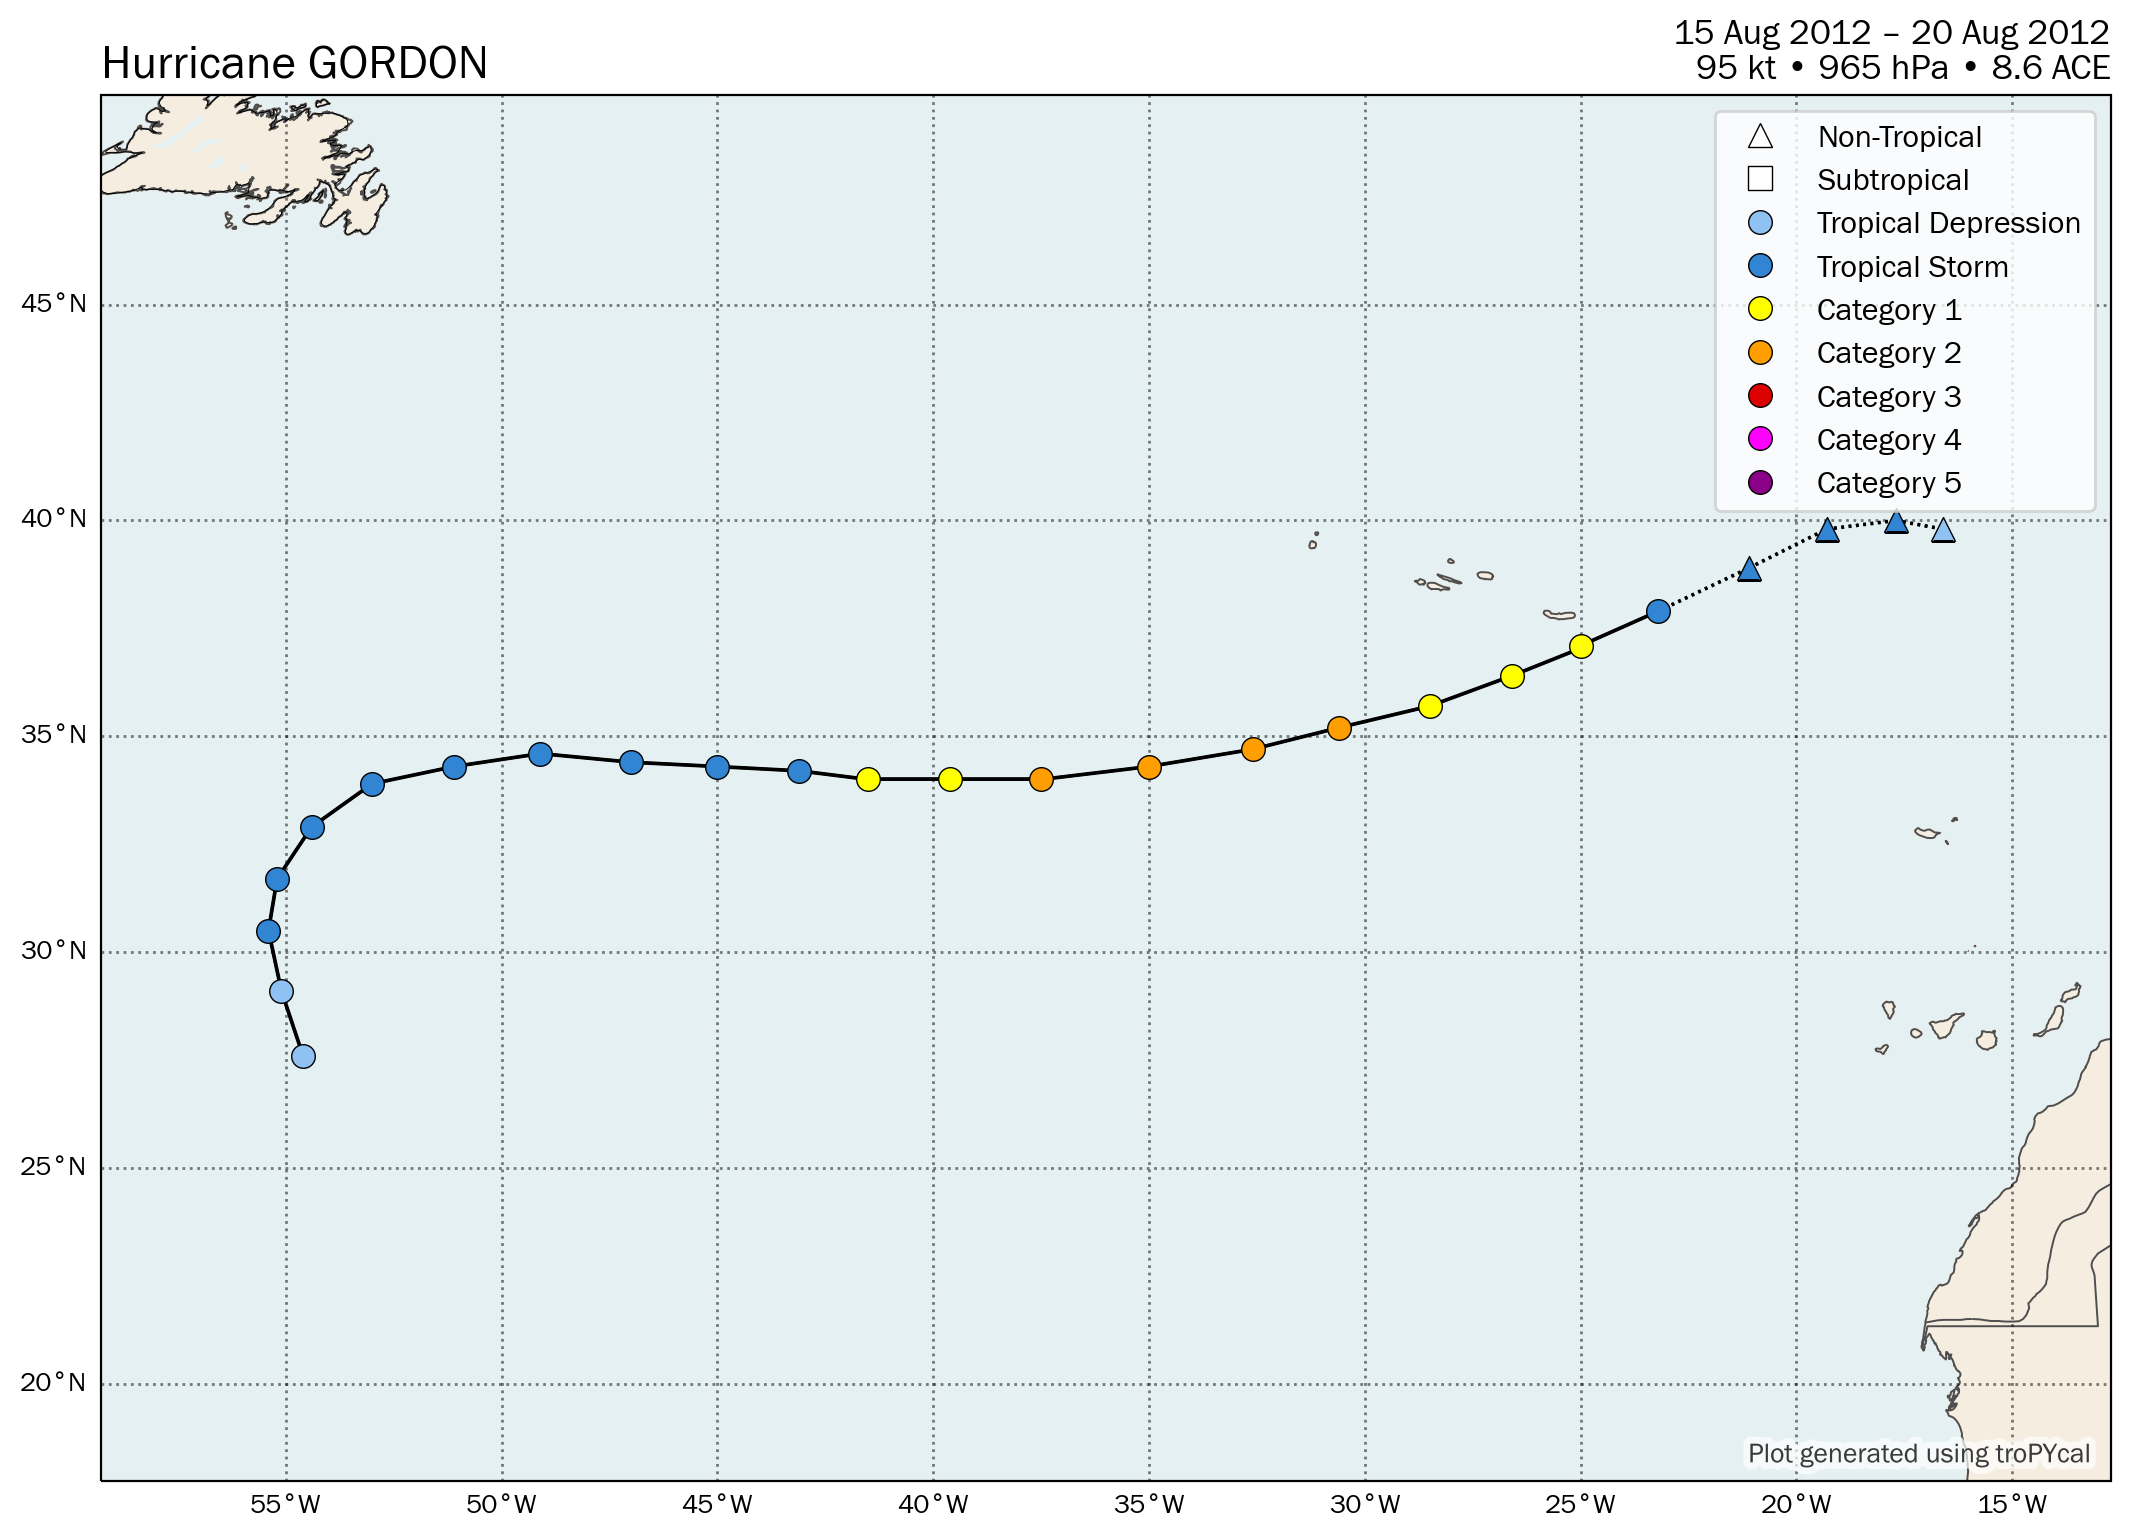
| Time (UTC) | Lat | Lon | Wind (mph) | Pressure | Storm Type | Category |
|---|---|---|---|---|---|---|
| 1200 UTC 15 Aug | 27.6 | -54.6 | 35 | 1013 | Tropical Depression | - |
| 1800 UTC 15 Aug | 29.1 | -55.1 | 35 | 1012 | Tropical Depression | - |
| 0000 UTC 16 Aug | 30.5 | -55.4 | 40 | 1010 | Tropical Storm | - |
| 0600 UTC 16 Aug | 31.7 | -55.2 | 45 | 1009 | Tropical Storm | - |
| 1200 UTC 16 Aug | 32.9 | -54.4 | 50 | 1006 | Tropical Storm | - |
| 1800 UTC 16 Aug | 33.9 | -53.0 | 65 | 998 | Tropical Storm | - |
| 0000 UTC 17 Aug | 34.3 | -51.1 | 70 | 995 | Tropical Storm | - |
| 0600 UTC 17 Aug | 34.6 | -49.1 | 65 | 998 | Tropical Storm | - |
| 1200 UTC 17 Aug | 34.4 | -47.0 | 65 | 997 | Tropical Storm | - |
| 1800 UTC 17 Aug | 34.3 | -45.0 | 65 | 993 | Tropical Storm | - |
| 0000 UTC 18 Aug | 34.2 | -43.1 | 70 | 990 | Tropical Storm | - |
| 0600 UTC 18 Aug | 34.0 | -41.5 | 75 | 987 | Hurricane | 1 |
| 1200 UTC 18 Aug | 34.0 | -39.6 | 85 | 979 | Hurricane | 1 |
| 1800 UTC 18 Aug | 34.0 | -37.5 | 105 | 969 | Hurricane | 2 |
| 0000 UTC 19 Aug | 34.3 | -35.0 | 110 | 965 | Hurricane | 2 |
| 0600 UTC 19 Aug | 34.7 | -32.6 | 105 | 969 | Hurricane | 2 |
| 1200 UTC 19 Aug | 35.2 | -30.6 | 105 | 969 | Hurricane | 2 |
| 1800 UTC 19 Aug | 35.7 | -28.5 | 90 | 977 | Hurricane | 1 |
| 0000 UTC 20 Aug | 36.4 | -26.6 | 80 | 981 | Hurricane | 1 |
| 0530 UTC 20 Aug | 37.0 | -25.1 | 75 | 984 | Hurricane | 1 |
| 0600 UTC 20 Aug | 37.1 | -25.0 | 75 | 984 | Hurricane | 1 |
| 1200 UTC 20 Aug | 37.9 | -23.2 | 70 | 990 | Tropical Storm | - |
| 1800 UTC 20 Aug | 38.9 | -21.1 | 50 | 996 | Remnant Low | - |
| 0000 UTC 21 Aug | 39.8 | -19.3 | 45 | 1000 | Remnant Low | - |
| 0600 UTC 21 Aug | 40.0 | -17.7 | 45 | 1002 | Remnant Low | - |
| 1200 UTC 21 Aug | 39.8 | -16.6 | 35 | 1004 | Remnant Low | - |
Storm-Relative Tornadoes

Tornado Map

Summary Map
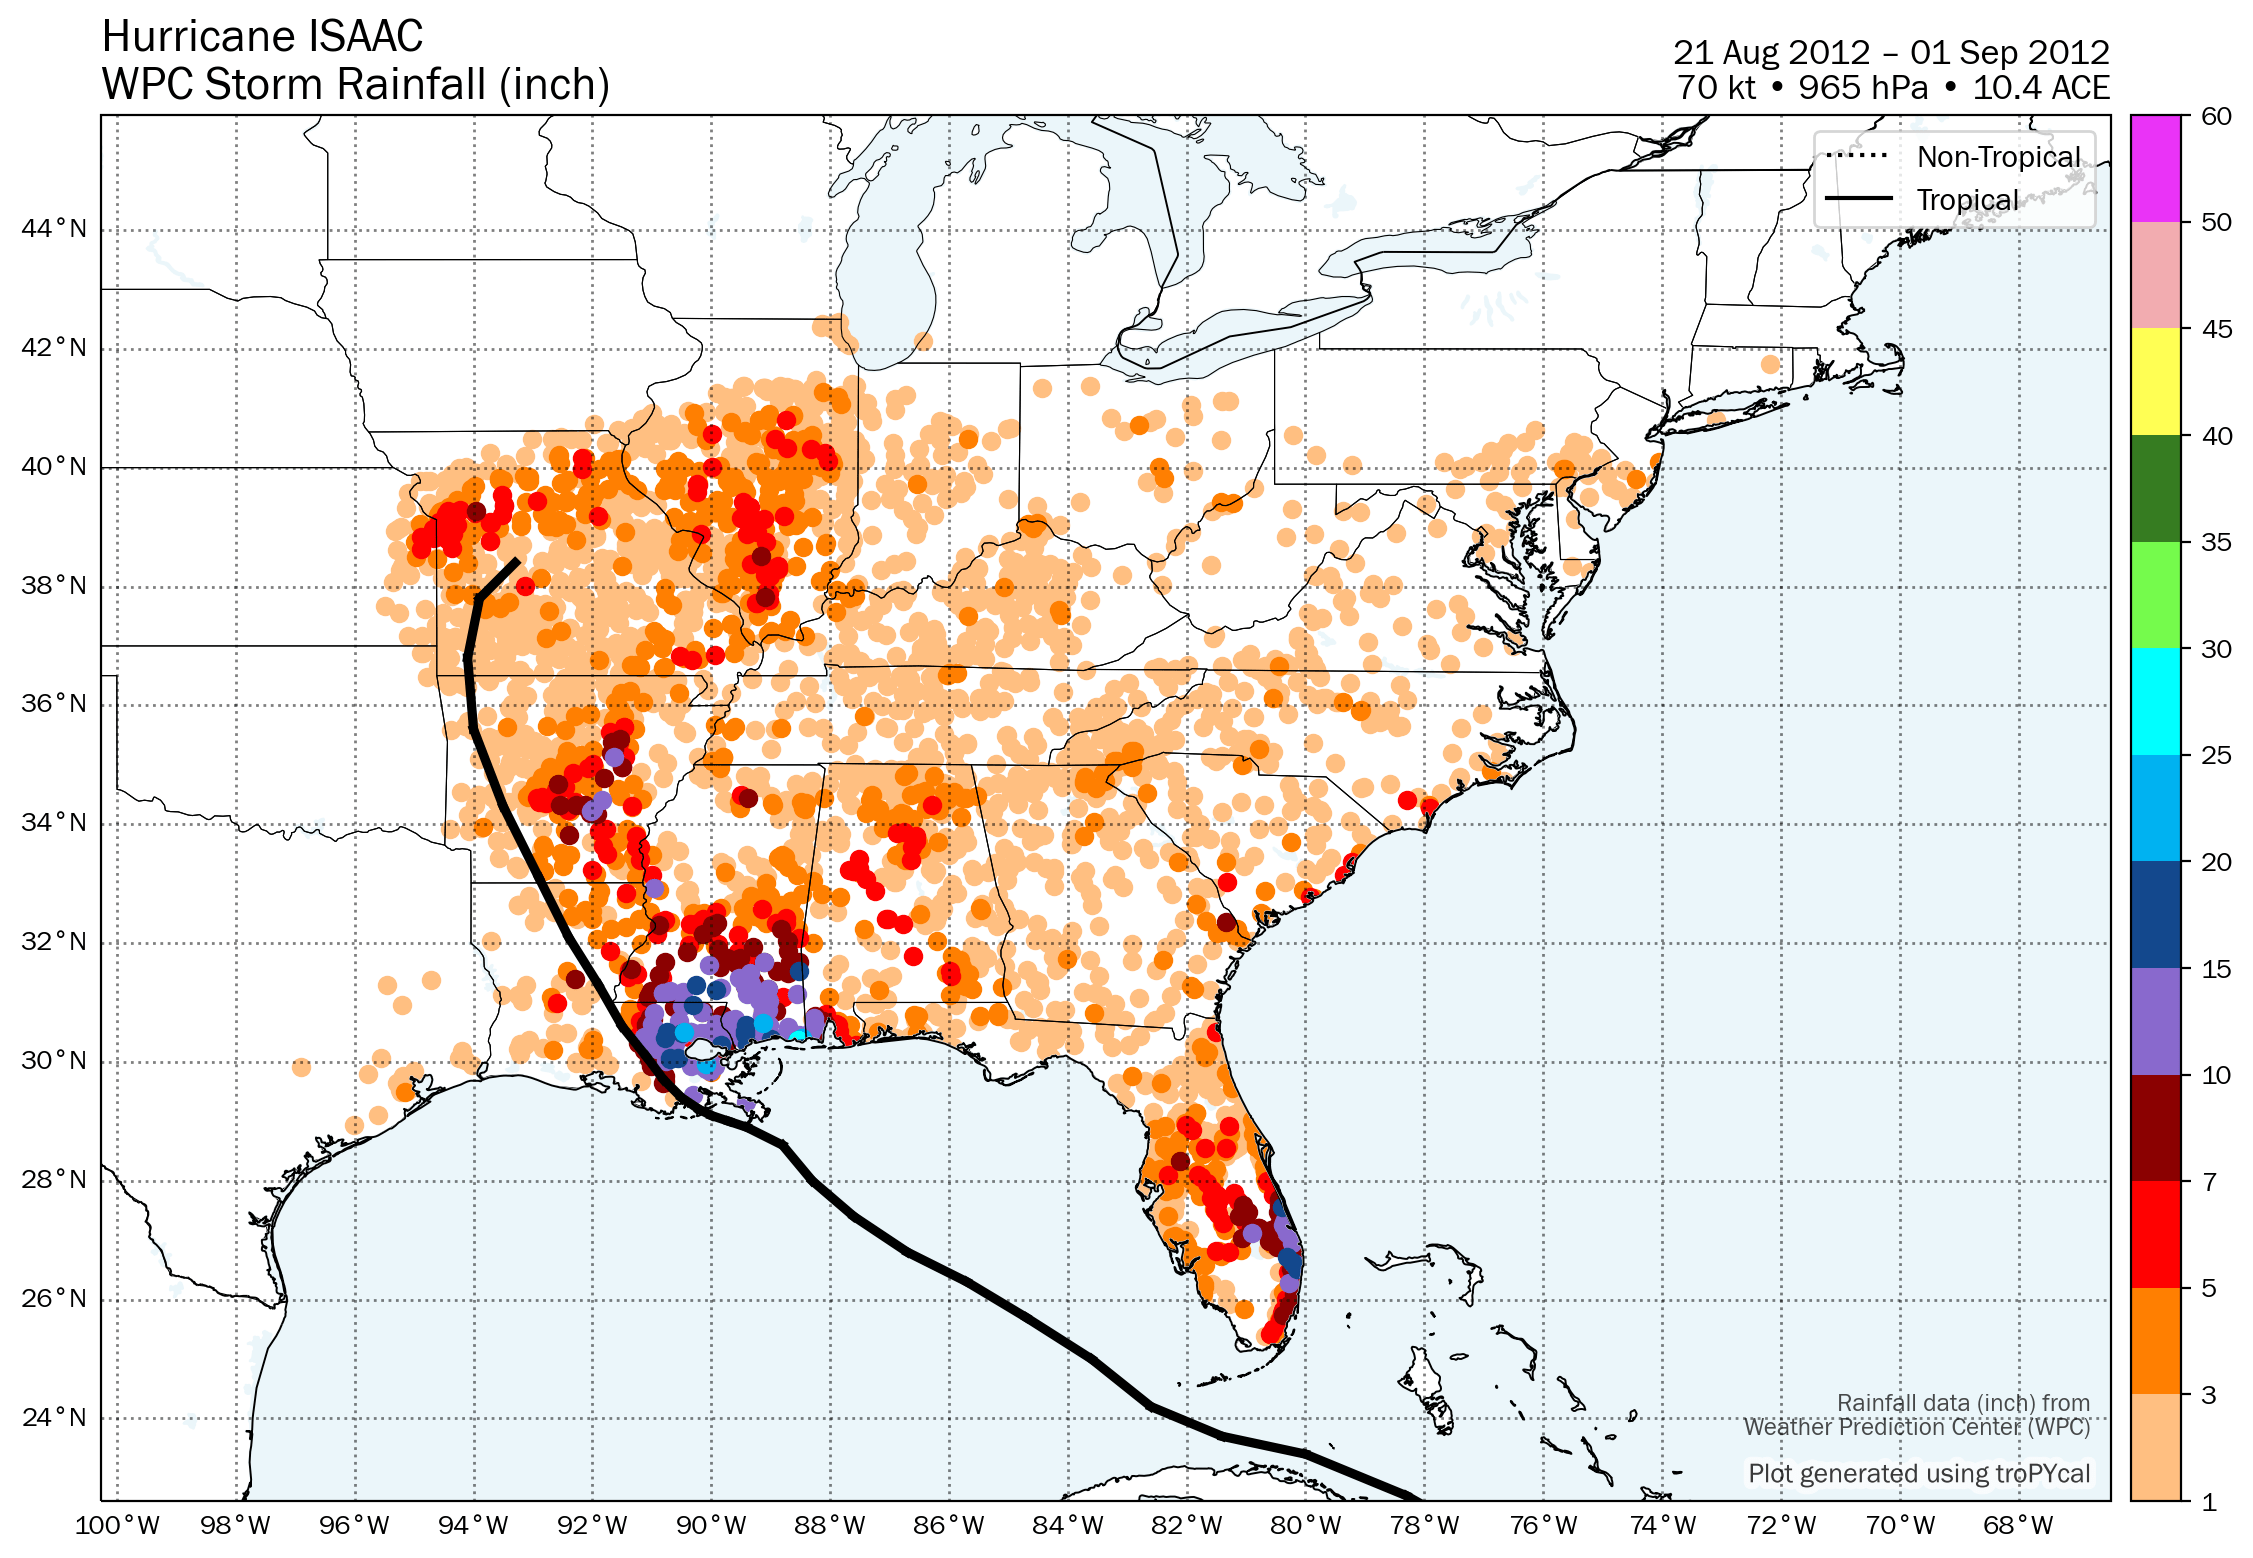
Gridded Rainfall

Summary Plot

Recon-Derived Hovmoller

Recon-Derived Wind Swath

Recon-Derived MSLP Swath

| Time (UTC) | Lat | Lon | Wind (mph) | Pressure | Storm Type | Category |
|---|---|---|---|---|---|---|
| 1200 UTC 20 Aug | 15.7 | -44.8 | 30 | 1010 | Disturbance | - |
| 1800 UTC 20 Aug | 15.6 | -46.8 | 35 | 1009 | Disturbance | - |
| 0000 UTC 21 Aug | 15.2 | -48.5 | 35 | 1008 | Disturbance | - |
| 0600 UTC 21 Aug | 14.9 | -50.1 | 35 | 1007 | Tropical Depression | - |
| 1200 UTC 21 Aug | 15.0 | -51.6 | 35 | 1006 | Tropical Depression | - |
| 1800 UTC 21 Aug | 15.2 | -53.1 | 40 | 1005 | Tropical Storm | - |
| 0000 UTC 22 Aug | 15.4 | -54.8 | 45 | 1004 | Tropical Storm | - |
| 0600 UTC 22 Aug | 15.7 | -56.6 | 50 | 1003 | Tropical Storm | - |
| 1200 UTC 22 Aug | 15.9 | -58.6 | 50 | 1004 | Tropical Storm | - |
| 1800 UTC 22 Aug | 16.1 | -60.4 | 50 | 1004 | Tropical Storm | - |
| 0000 UTC 23 Aug | 15.7 | -62.0 | 50 | 1004 | Tropical Storm | - |
| 0600 UTC 23 Aug | 15.0 | -63.4 | 50 | 1004 | Tropical Storm | - |
| 1200 UTC 23 Aug | 15.1 | -65.0 | 50 | 1003 | Tropical Storm | - |
| 1800 UTC 23 Aug | 15.6 | -66.4 | 50 | 1003 | Tropical Storm | - |
| 0000 UTC 24 Aug | 15.7 | -67.8 | 50 | 1002 | Tropical Storm | - |
| 0600 UTC 24 Aug | 15.4 | -69.1 | 50 | 998 | Tropical Storm | - |
| 1200 UTC 24 Aug | 15.7 | -70.4 | 60 | 995 | Tropical Storm | - |
| 1800 UTC 24 Aug | 16.6 | -71.2 | 65 | 993 | Tropical Storm | - |
| 0000 UTC 25 Aug | 17.3 | -71.8 | 65 | 992 | Tropical Storm | - |
| 0600 UTC 25 Aug | 18.3 | -72.7 | 65 | 991 | Tropical Storm | - |
| 1200 UTC 25 Aug | 19.6 | -73.9 | 60 | 997 | Tropical Storm | - |
| 1500 UTC 25 Aug | 20.1 | -74.5 | 60 | 997 | Tropical Storm | - |
| 1800 UTC 25 Aug | 20.8 | -75.2 | 60 | 997 | Tropical Storm | - |
| 0000 UTC 26 Aug | 21.8 | -76.7 | 60 | 997 | Tropical Storm | - |
| 0600 UTC 26 Aug | 22.7 | -78.3 | 65 | 995 | Tropical Storm | - |
| 1200 UTC 26 Aug | 23.4 | -80.0 | 65 | 995 | Tropical Storm | - |
| 1800 UTC 26 Aug | 23.7 | -81.4 | 60 | 992 | Tropical Storm | - |
| 0000 UTC 27 Aug | 24.2 | -82.6 | 60 | 990 | Tropical Storm | - |
| 0600 UTC 27 Aug | 25.0 | -83.6 | 60 | 989 | Tropical Storm | - |
| 1200 UTC 27 Aug | 25.7 | -84.7 | 65 | 987 | Tropical Storm | - |
| 1800 UTC 27 Aug | 26.3 | -85.7 | 70 | 982 | Tropical Storm | - |
| 0000 UTC 28 Aug | 26.8 | -86.7 | 70 | 979 | Tropical Storm | - |
| 0600 UTC 28 Aug | 27.4 | -87.6 | 70 | 978 | Tropical Storm | - |
| 1200 UTC 28 Aug | 28.0 | -88.3 | 75 | 975 | Hurricane | 1 |
| 1800 UTC 28 Aug | 28.6 | -88.8 | 80 | 972 | Hurricane | 1 |
| 0000 UTC 29 Aug | 28.9 | -89.4 | 80 | 967 | Hurricane | 1 |
| 0300 UTC 29 Aug | 29.0 | -89.7 | 80 | 965 | Hurricane | 1 |
| 0600 UTC 29 Aug | 29.1 | -90.0 | 80 | 966 | Hurricane | 1 |
| 0800 UTC 29 Aug | 29.2 | -90.2 | 80 | 966 | Hurricane | 1 |
| 1200 UTC 29 Aug | 29.4 | -90.5 | 75 | 968 | Hurricane | 1 |
| 1800 UTC 29 Aug | 29.7 | -90.8 | 70 | 973 | Tropical Storm | - |
| 0000 UTC 30 Aug | 30.1 | -91.1 | 65 | 977 | Tropical Storm | - |
| 0600 UTC 30 Aug | 30.6 | -91.5 | 65 | 982 | Tropical Storm | - |
| 1200 UTC 30 Aug | 31.3 | -91.9 | 50 | 987 | Tropical Storm | - |
| 1800 UTC 30 Aug | 32.1 | -92.4 | 40 | 993 | Tropical Storm | - |
| 0000 UTC 31 Aug | 33.1 | -92.9 | 35 | 998 | Tropical Depression | - |
| 0600 UTC 31 Aug | 34.3 | -93.5 | 30 | 1000 | Tropical Depression | - |
| 1200 UTC 31 Aug | 35.6 | -94.0 | 25 | 1001 | Tropical Depression | - |
| 1800 UTC 31 Aug | 36.8 | -94.1 | 25 | 1003 | Tropical Depression | - |
| 0000 UTC 01 Sep | 37.8 | -93.9 | 25 | 1004 | Tropical Depression | - |
| 0600 UTC 01 Sep | 38.4 | -93.3 | 25 | 1005 | Tropical Depression | - |
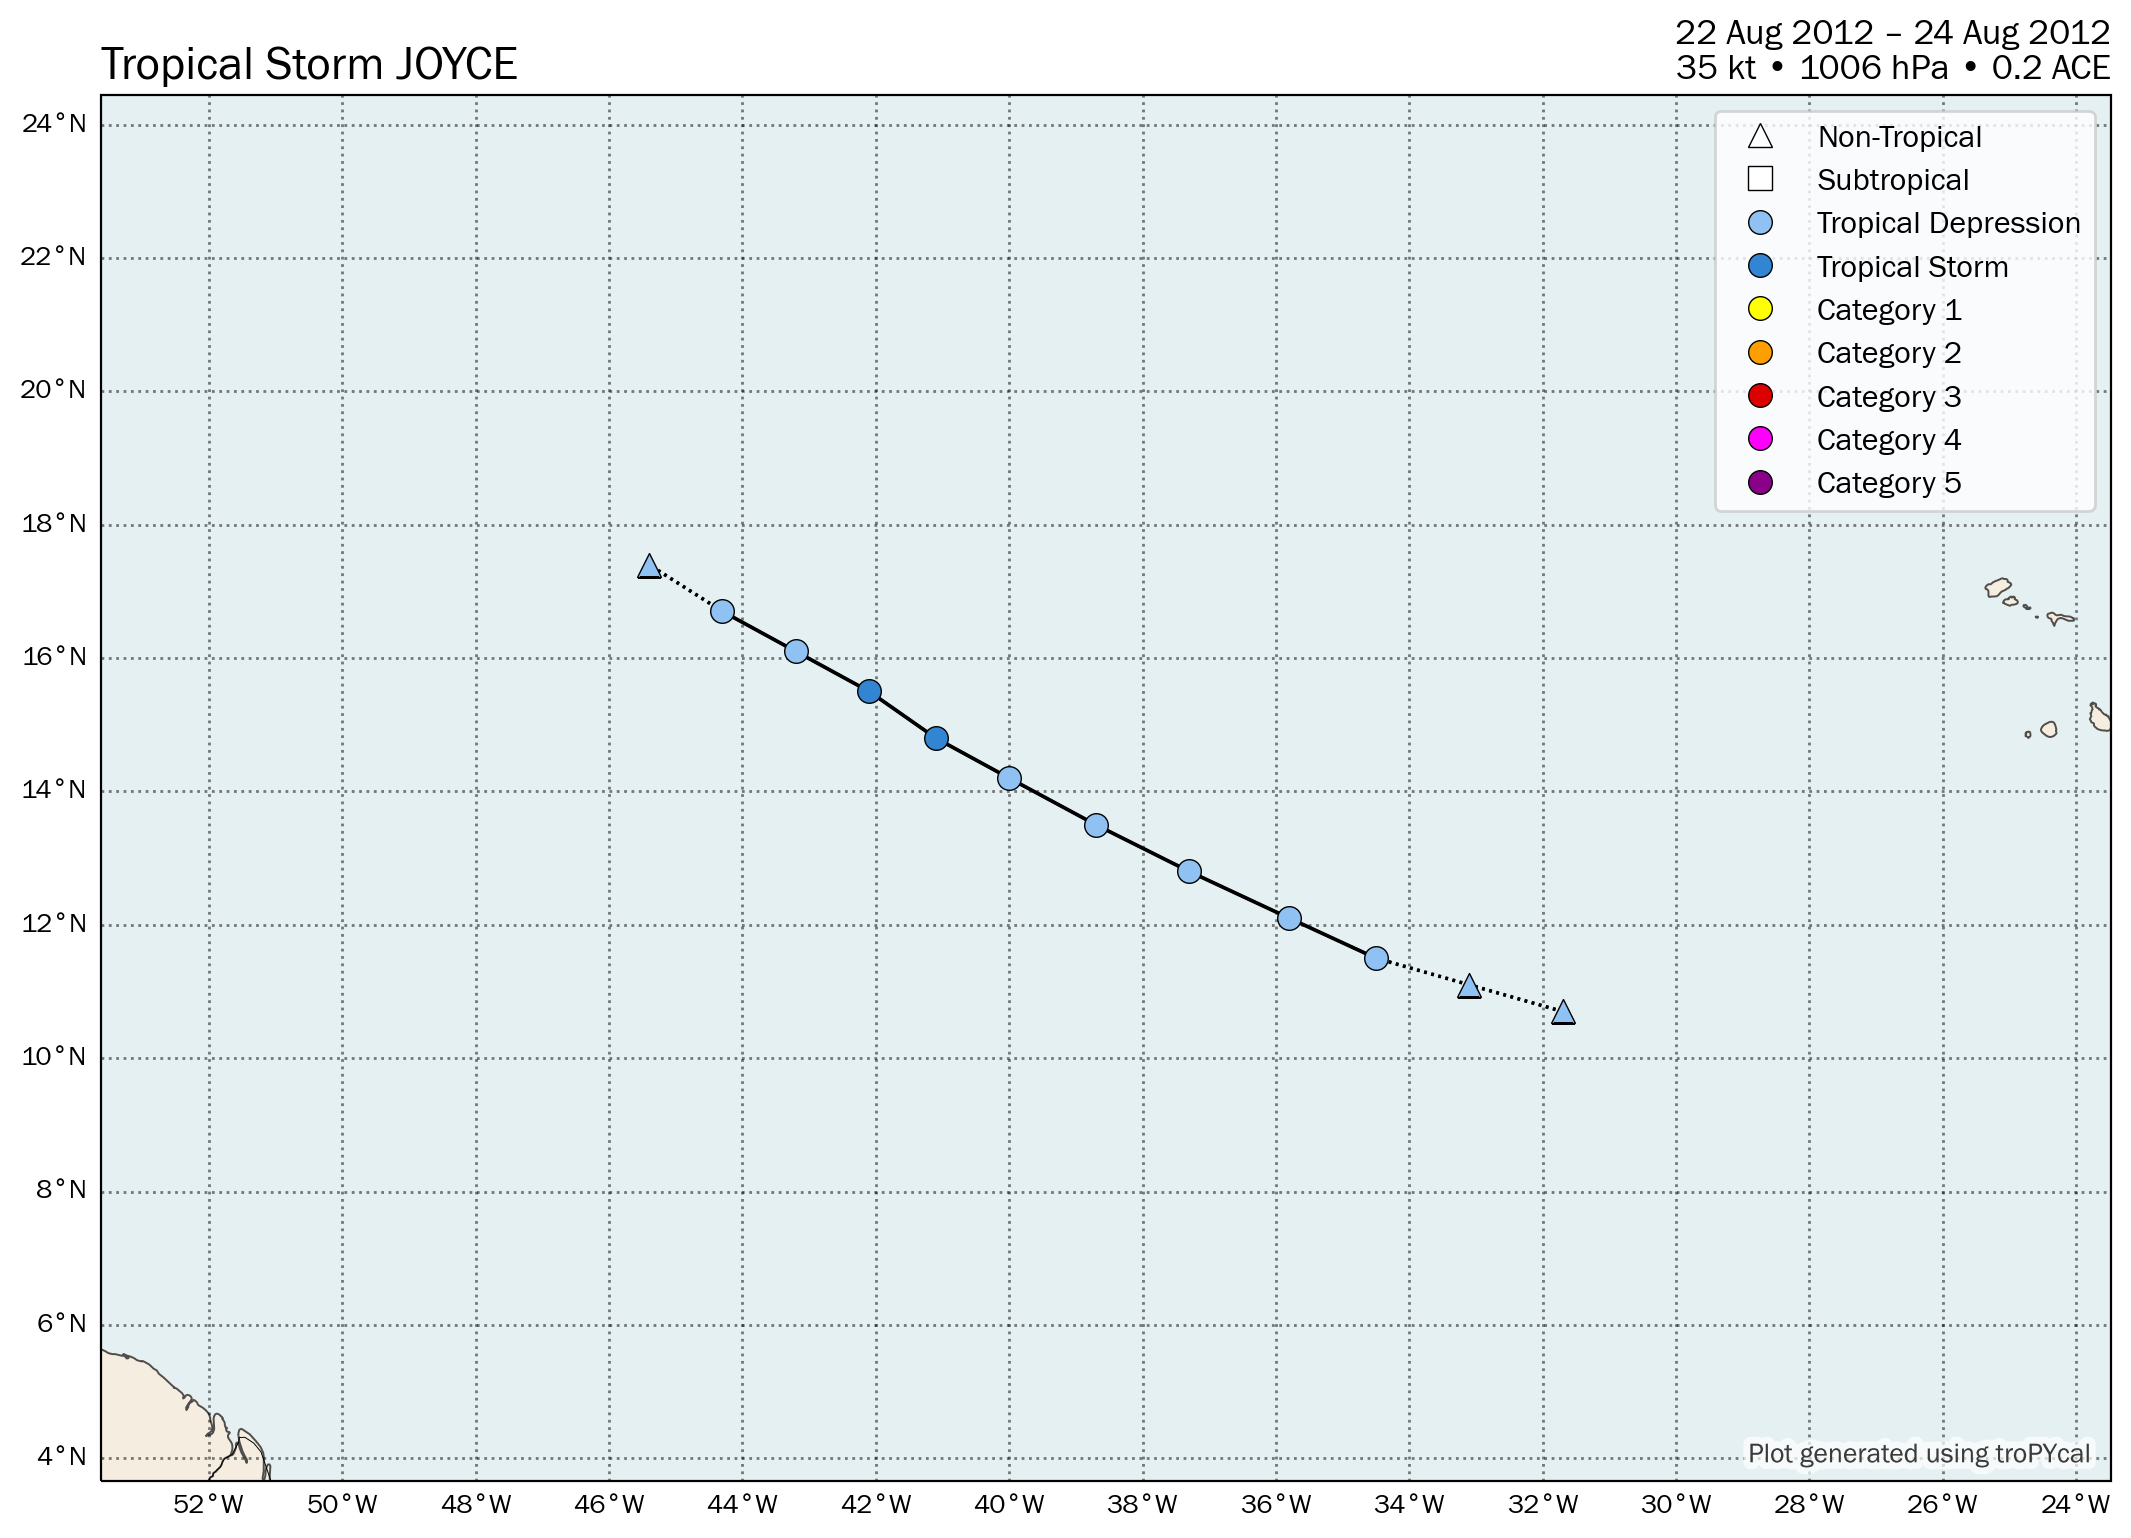
| Time (UTC) | Lat | Lon | Wind (mph) | Pressure | Storm Type | Category |
|---|---|---|---|---|---|---|
| 1800 UTC 21 Aug | 10.7 | -31.7 | 30 | 1011 | Disturbance | - |
| 0000 UTC 22 Aug | 11.1 | -33.1 | 30 | 1011 | Disturbance | - |
| 0600 UTC 22 Aug | 11.5 | -34.5 | 30 | 1011 | Tropical Depression | - |
| 1200 UTC 22 Aug | 12.1 | -35.8 | 35 | 1009 | Tropical Depression | - |
| 1800 UTC 22 Aug | 12.8 | -37.3 | 35 | 1009 | Tropical Depression | - |
| 0000 UTC 23 Aug | 13.5 | -38.7 | 35 | 1009 | Tropical Depression | - |
| 0600 UTC 23 Aug | 14.2 | -40.0 | 35 | 1009 | Tropical Depression | - |
| 1200 UTC 23 Aug | 14.8 | -41.1 | 40 | 1007 | Tropical Storm | - |
| 1800 UTC 23 Aug | 15.5 | -42.1 | 40 | 1006 | Tropical Storm | - |
| 0000 UTC 24 Aug | 16.1 | -43.2 | 35 | 1008 | Tropical Depression | - |
| 0600 UTC 24 Aug | 16.7 | -44.3 | 35 | 1008 | Tropical Depression | - |
| 1200 UTC 24 Aug | 17.4 | -45.4 | 35 | 1009 | Remnant Low | - |
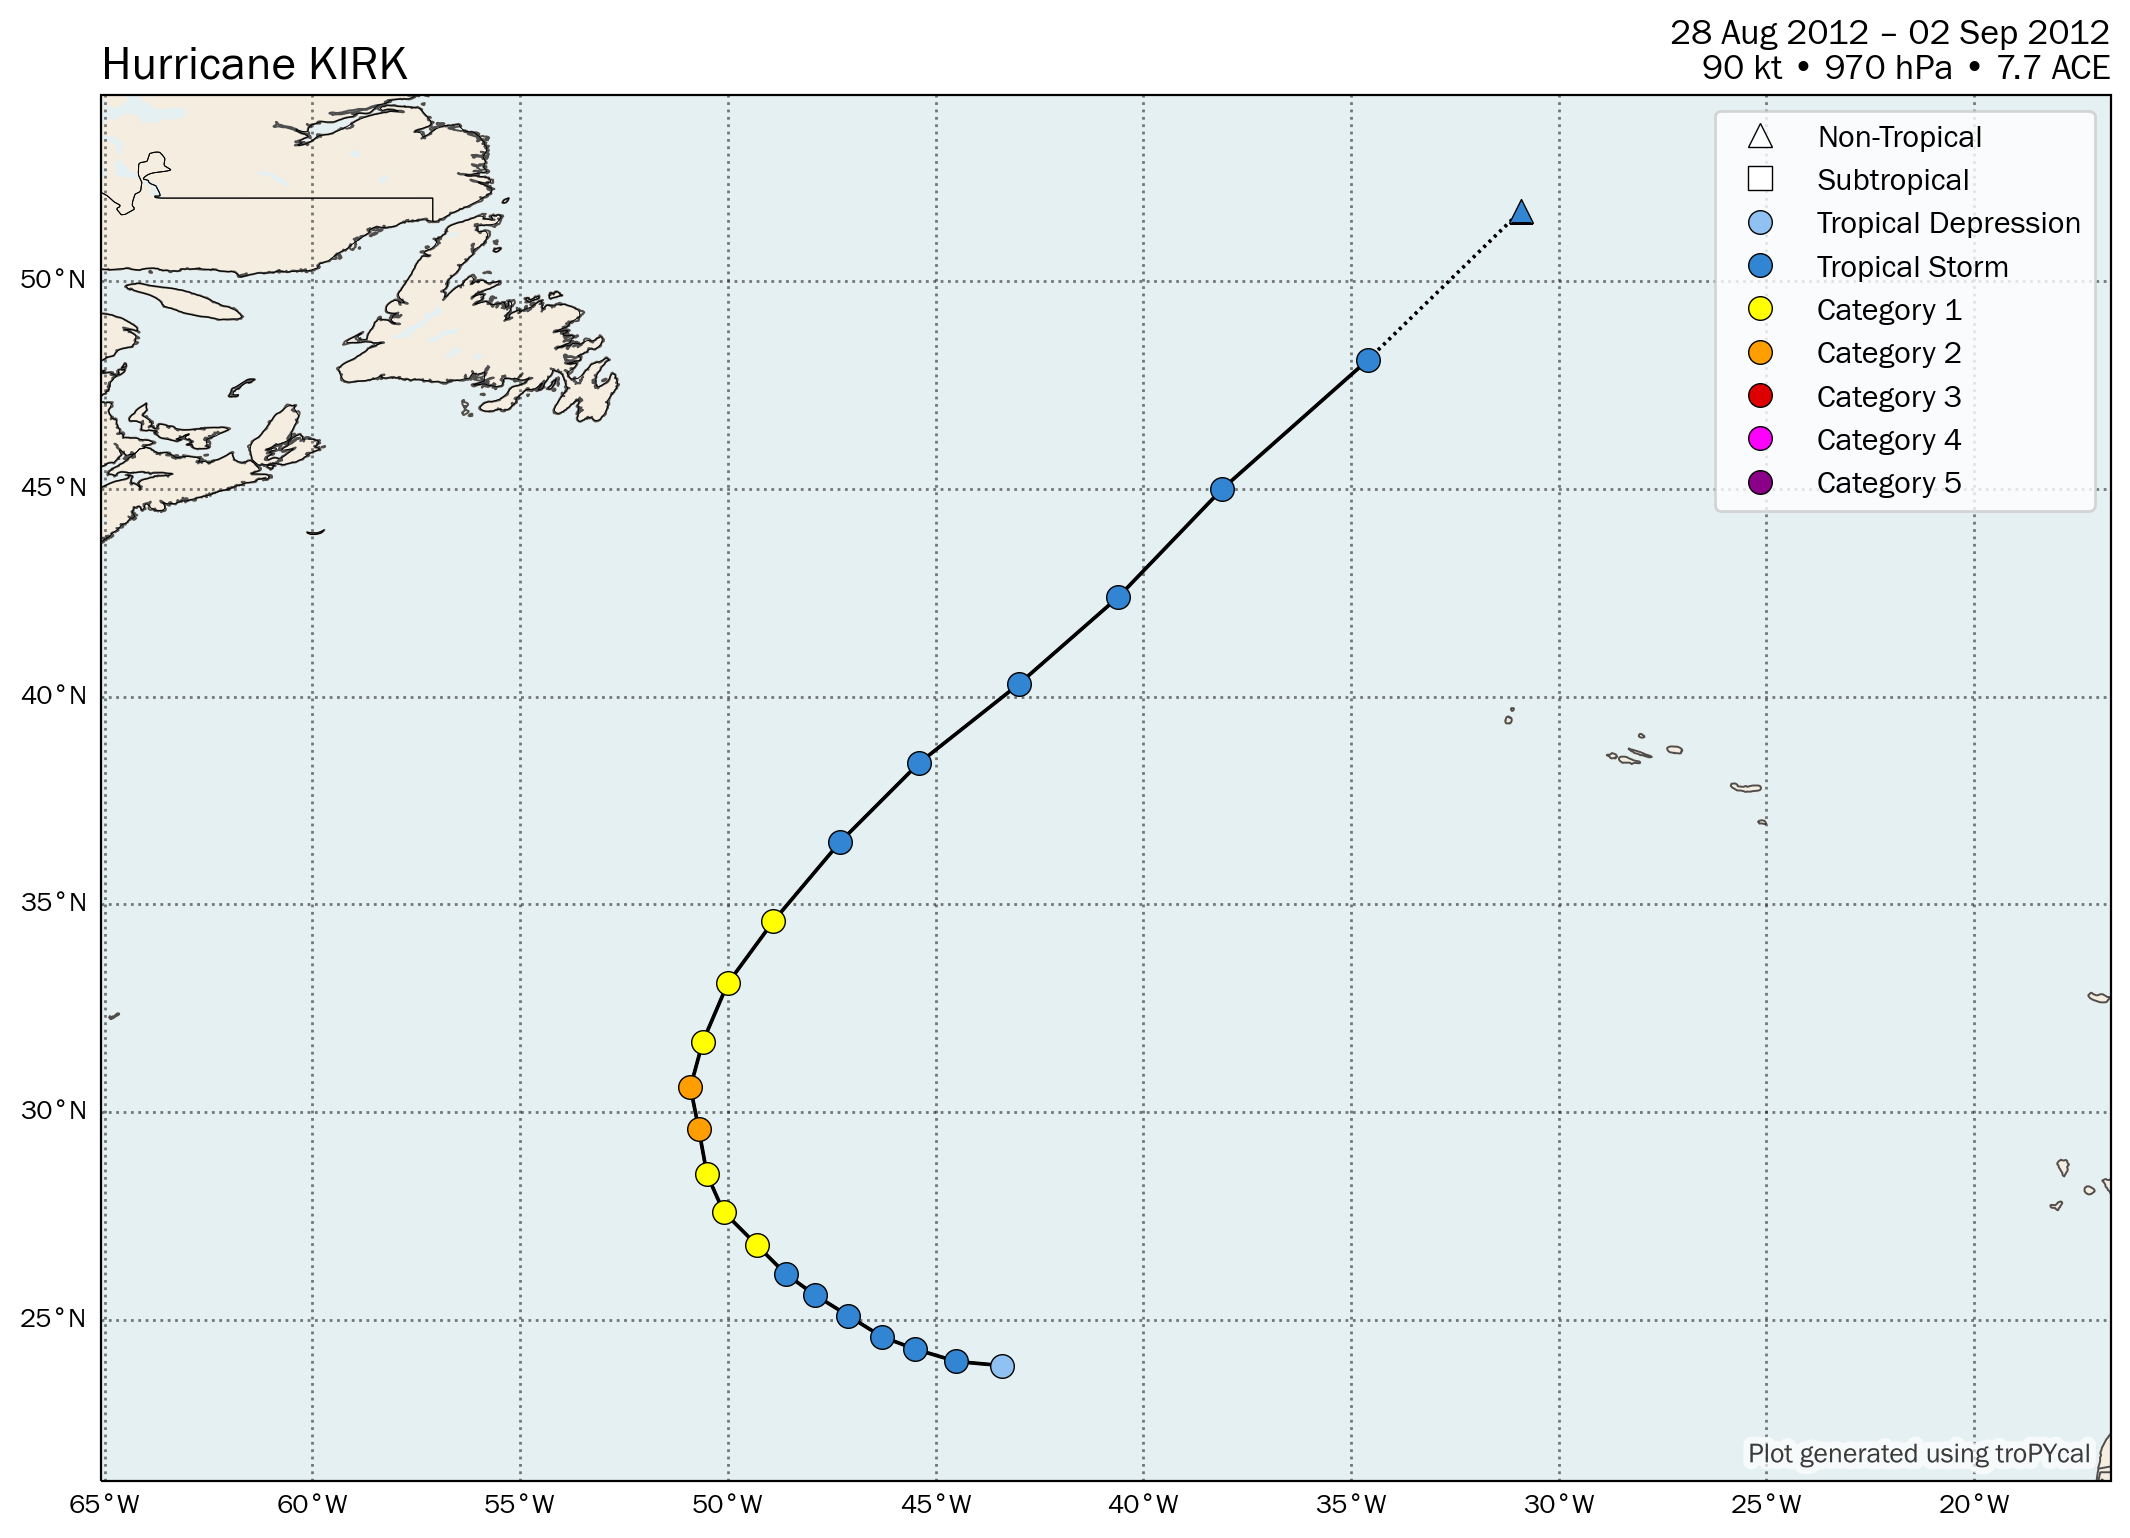
| Time (UTC) | Lat | Lon | Wind (mph) | Pressure | Storm Type | Category |
|---|---|---|---|---|---|---|
| 1800 UTC 28 Aug | 23.9 | -43.4 | 35 | 1007 | Tropical Depression | - |
| 0000 UTC 29 Aug | 24.0 | -44.5 | 45 | 1004 | Tropical Storm | - |
| 0600 UTC 29 Aug | 24.3 | -45.5 | 45 | 1003 | Tropical Storm | - |
| 1200 UTC 29 Aug | 24.6 | -46.3 | 50 | 1001 | Tropical Storm | - |
| 1800 UTC 29 Aug | 25.1 | -47.1 | 50 | 999 | Tropical Storm | - |
| 0000 UTC 30 Aug | 25.6 | -47.9 | 60 | 995 | Tropical Storm | - |
| 0600 UTC 30 Aug | 26.1 | -48.6 | 65 | 992 | Tropical Storm | - |
| 1200 UTC 30 Aug | 26.8 | -49.3 | 75 | 989 | Hurricane | 1 |
| 1800 UTC 30 Aug | 27.6 | -50.1 | 85 | 985 | Hurricane | 1 |
| 0000 UTC 31 Aug | 28.5 | -50.5 | 90 | 981 | Hurricane | 1 |
| 0600 UTC 31 Aug | 29.6 | -50.7 | 105 | 970 | Hurricane | 2 |
| 1200 UTC 31 Aug | 30.6 | -50.9 | 105 | 972 | Hurricane | 2 |
| 1800 UTC 31 Aug | 31.7 | -50.6 | 90 | 980 | Hurricane | 1 |
| 0000 UTC 01 Sep | 33.1 | -50.0 | 80 | 988 | Hurricane | 1 |
| 0600 UTC 01 Sep | 34.6 | -48.9 | 75 | 990 | Hurricane | 1 |
| 1200 UTC 01 Sep | 36.5 | -47.3 | 70 | 992 | Tropical Storm | - |
| 1800 UTC 01 Sep | 38.4 | -45.4 | 65 | 996 | Tropical Storm | - |
| 0000 UTC 02 Sep | 40.3 | -43.0 | 65 | 998 | Tropical Storm | - |
| 0600 UTC 02 Sep | 42.4 | -40.6 | 60 | 1001 | Tropical Storm | - |
| 1200 UTC 02 Sep | 45.0 | -38.1 | 60 | 1002 | Tropical Storm | - |
| 1800 UTC 02 Sep | 48.1 | -34.6 | 50 | 1002 | Tropical Storm | - |
| 0000 UTC 03 Sep | 51.7 | -30.9 | 50 | 1002 | Post-Tropical Cyclone | - |
Summary Plot

Recon-Derived Wind Swath

Recon-Derived MSLP Swath

| Time (UTC) | Lat | Lon | Wind (mph) | Pressure | Storm Type | Category |
|---|---|---|---|---|---|---|
| 1200 UTC 28 Aug | 12.9 | -27.4 | 25 | 1010 | Disturbance | - |
| 1800 UTC 28 Aug | 13.0 | -29.6 | 25 | 1010 | Disturbance | - |
| 0000 UTC 29 Aug | 13.1 | -31.7 | 30 | 1009 | Disturbance | - |
| 0600 UTC 29 Aug | 13.2 | -33.7 | 30 | 1009 | Disturbance | - |
| 1200 UTC 29 Aug | 13.3 | -35.6 | 30 | 1009 | Disturbance | - |
| 1800 UTC 29 Aug | 13.4 | -37.5 | 30 | 1008 | Disturbance | - |
| 0000 UTC 30 Aug | 13.5 | -39.2 | 35 | 1007 | Tropical Depression | - |
| 0600 UTC 30 Aug | 13.6 | -40.9 | 35 | 1006 | Tropical Depression | - |
| 1200 UTC 30 Aug | 13.8 | -42.6 | 40 | 1005 | Tropical Storm | - |
| 1800 UTC 30 Aug | 14.2 | -44.2 | 45 | 1004 | Tropical Storm | - |
| 0000 UTC 31 Aug | 14.7 | -45.8 | 50 | 1002 | Tropical Storm | - |
| 0600 UTC 31 Aug | 15.3 | -47.4 | 60 | 1001 | Tropical Storm | - |
| 1200 UTC 31 Aug | 16.0 | -49.0 | 65 | 999 | Tropical Storm | - |
| 1800 UTC 31 Aug | 16.5 | -50.6 | 65 | 999 | Tropical Storm | - |
| 0000 UTC 01 Sep | 17.1 | -52.2 | 70 | 998 | Tropical Storm | - |
| 0600 UTC 01 Sep | 17.6 | -53.8 | 70 | 996 | Tropical Storm | - |
| 1200 UTC 01 Sep | 18.1 | -55.3 | 70 | 995 | Tropical Storm | - |
| 1800 UTC 01 Sep | 18.8 | -56.8 | 70 | 994 | Tropical Storm | - |
| 0000 UTC 02 Sep | 19.6 | -58.1 | 70 | 994 | Tropical Storm | - |
| 0600 UTC 02 Sep | 20.4 | -59.4 | 65 | 995 | Tropical Storm | - |
| 1200 UTC 02 Sep | 21.2 | -60.7 | 60 | 997 | Tropical Storm | - |
| 1800 UTC 02 Sep | 22.1 | -61.4 | 60 | 997 | Tropical Storm | - |
| 0000 UTC 03 Sep | 22.9 | -61.7 | 60 | 997 | Tropical Storm | - |
| 0600 UTC 03 Sep | 23.4 | -62.2 | 60 | 996 | Tropical Storm | - |
| 1200 UTC 03 Sep | 23.5 | -62.6 | 60 | 993 | Tropical Storm | - |
| 1800 UTC 03 Sep | 23.8 | -62.8 | 65 | 990 | Tropical Storm | - |
| 0000 UTC 04 Sep | 24.2 | -62.6 | 70 | 989 | Tropical Storm | - |
| 0600 UTC 04 Sep | 24.5 | -62.5 | 70 | 988 | Tropical Storm | - |
| 1200 UTC 04 Sep | 24.8 | -62.5 | 70 | 988 | Tropical Storm | - |
| 1800 UTC 04 Sep | 25.0 | -62.6 | 70 | 988 | Tropical Storm | - |
| 0000 UTC 05 Sep | 25.2 | -62.8 | 70 | 988 | Tropical Storm | - |
| 0600 UTC 05 Sep | 25.4 | -62.8 | 75 | 985 | Hurricane | 1 |
| 1200 UTC 05 Sep | 25.6 | -62.8 | 80 | 982 | Hurricane | 1 |
| 1800 UTC 05 Sep | 25.8 | -62.7 | 80 | 982 | Hurricane | 1 |
| 0000 UTC 06 Sep | 26.0 | -62.6 | 75 | 984 | Hurricane | 1 |
| 0600 UTC 06 Sep | 26.2 | -62.5 | 75 | 984 | Hurricane | 1 |
| 1200 UTC 06 Sep | 26.3 | -62.4 | 75 | 983 | Hurricane | 1 |
| 1800 UTC 06 Sep | 26.4 | -62.3 | 75 | 982 | Hurricane | 1 |
| 0000 UTC 07 Sep | 26.5 | -62.2 | 75 | 982 | Hurricane | 1 |
| 0600 UTC 07 Sep | 26.6 | -62.2 | 75 | 982 | Hurricane | 1 |
| 1200 UTC 07 Sep | 26.8 | -62.2 | 70 | 981 | Tropical Storm | - |
| 1800 UTC 07 Sep | 27.1 | -62.2 | 70 | 981 | Tropical Storm | - |
| 0000 UTC 08 Sep | 27.4 | -62.3 | 70 | 983 | Tropical Storm | - |
| 0600 UTC 08 Sep | 27.8 | -62.4 | 65 | 985 | Tropical Storm | - |
| 1200 UTC 08 Sep | 28.3 | -62.5 | 65 | 987 | Tropical Storm | - |
| 1800 UTC 08 Sep | 29.0 | -62.5 | 65 | 988 | Tropical Storm | - |
| 0000 UTC 09 Sep | 29.7 | -62.6 | 65 | 988 | Tropical Storm | - |
| 0600 UTC 09 Sep | 30.5 | -62.6 | 65 | 988 | Tropical Storm | - |
| 1200 UTC 09 Sep | 31.5 | -62.5 | 65 | 988 | Tropical Storm | - |
| 1800 UTC 09 Sep | 32.6 | -62.3 | 65 | 988 | Tropical Storm | - |
| 0000 UTC 10 Sep | 33.8 | -62.0 | 65 | 988 | Tropical Storm | - |
| 0600 UTC 10 Sep | 35.1 | -61.6 | 70 | 985 | Tropical Storm | - |
| 1200 UTC 10 Sep | 36.4 | -60.8 | 75 | 980 | Hurricane | 1 |
| 1800 UTC 10 Sep | 38.5 | -59.8 | 75 | 975 | Hurricane | 1 |
| 0000 UTC 11 Sep | 41.1 | -58.6 | 75 | 970 | Hurricane | 1 |
| 0600 UTC 11 Sep | 44.0 | -57.3 | 75 | 968 | Hurricane | 1 |
| 0900 UTC 11 Sep | 45.8 | -56.1 | 75 | 968 | Post-Tropical Cyclone | 1 |
| 1200 UTC 11 Sep | 47.7 | -54.9 | 75 | 970 | Post-Tropical Cyclone | 1 |
| 1800 UTC 11 Sep | 51.6 | -51.9 | 70 | 972 | Post-Tropical Cyclone | - |
| 0000 UTC 12 Sep | 55.5 | -48.5 | 65 | 975 | Post-Tropical Cyclone | - |
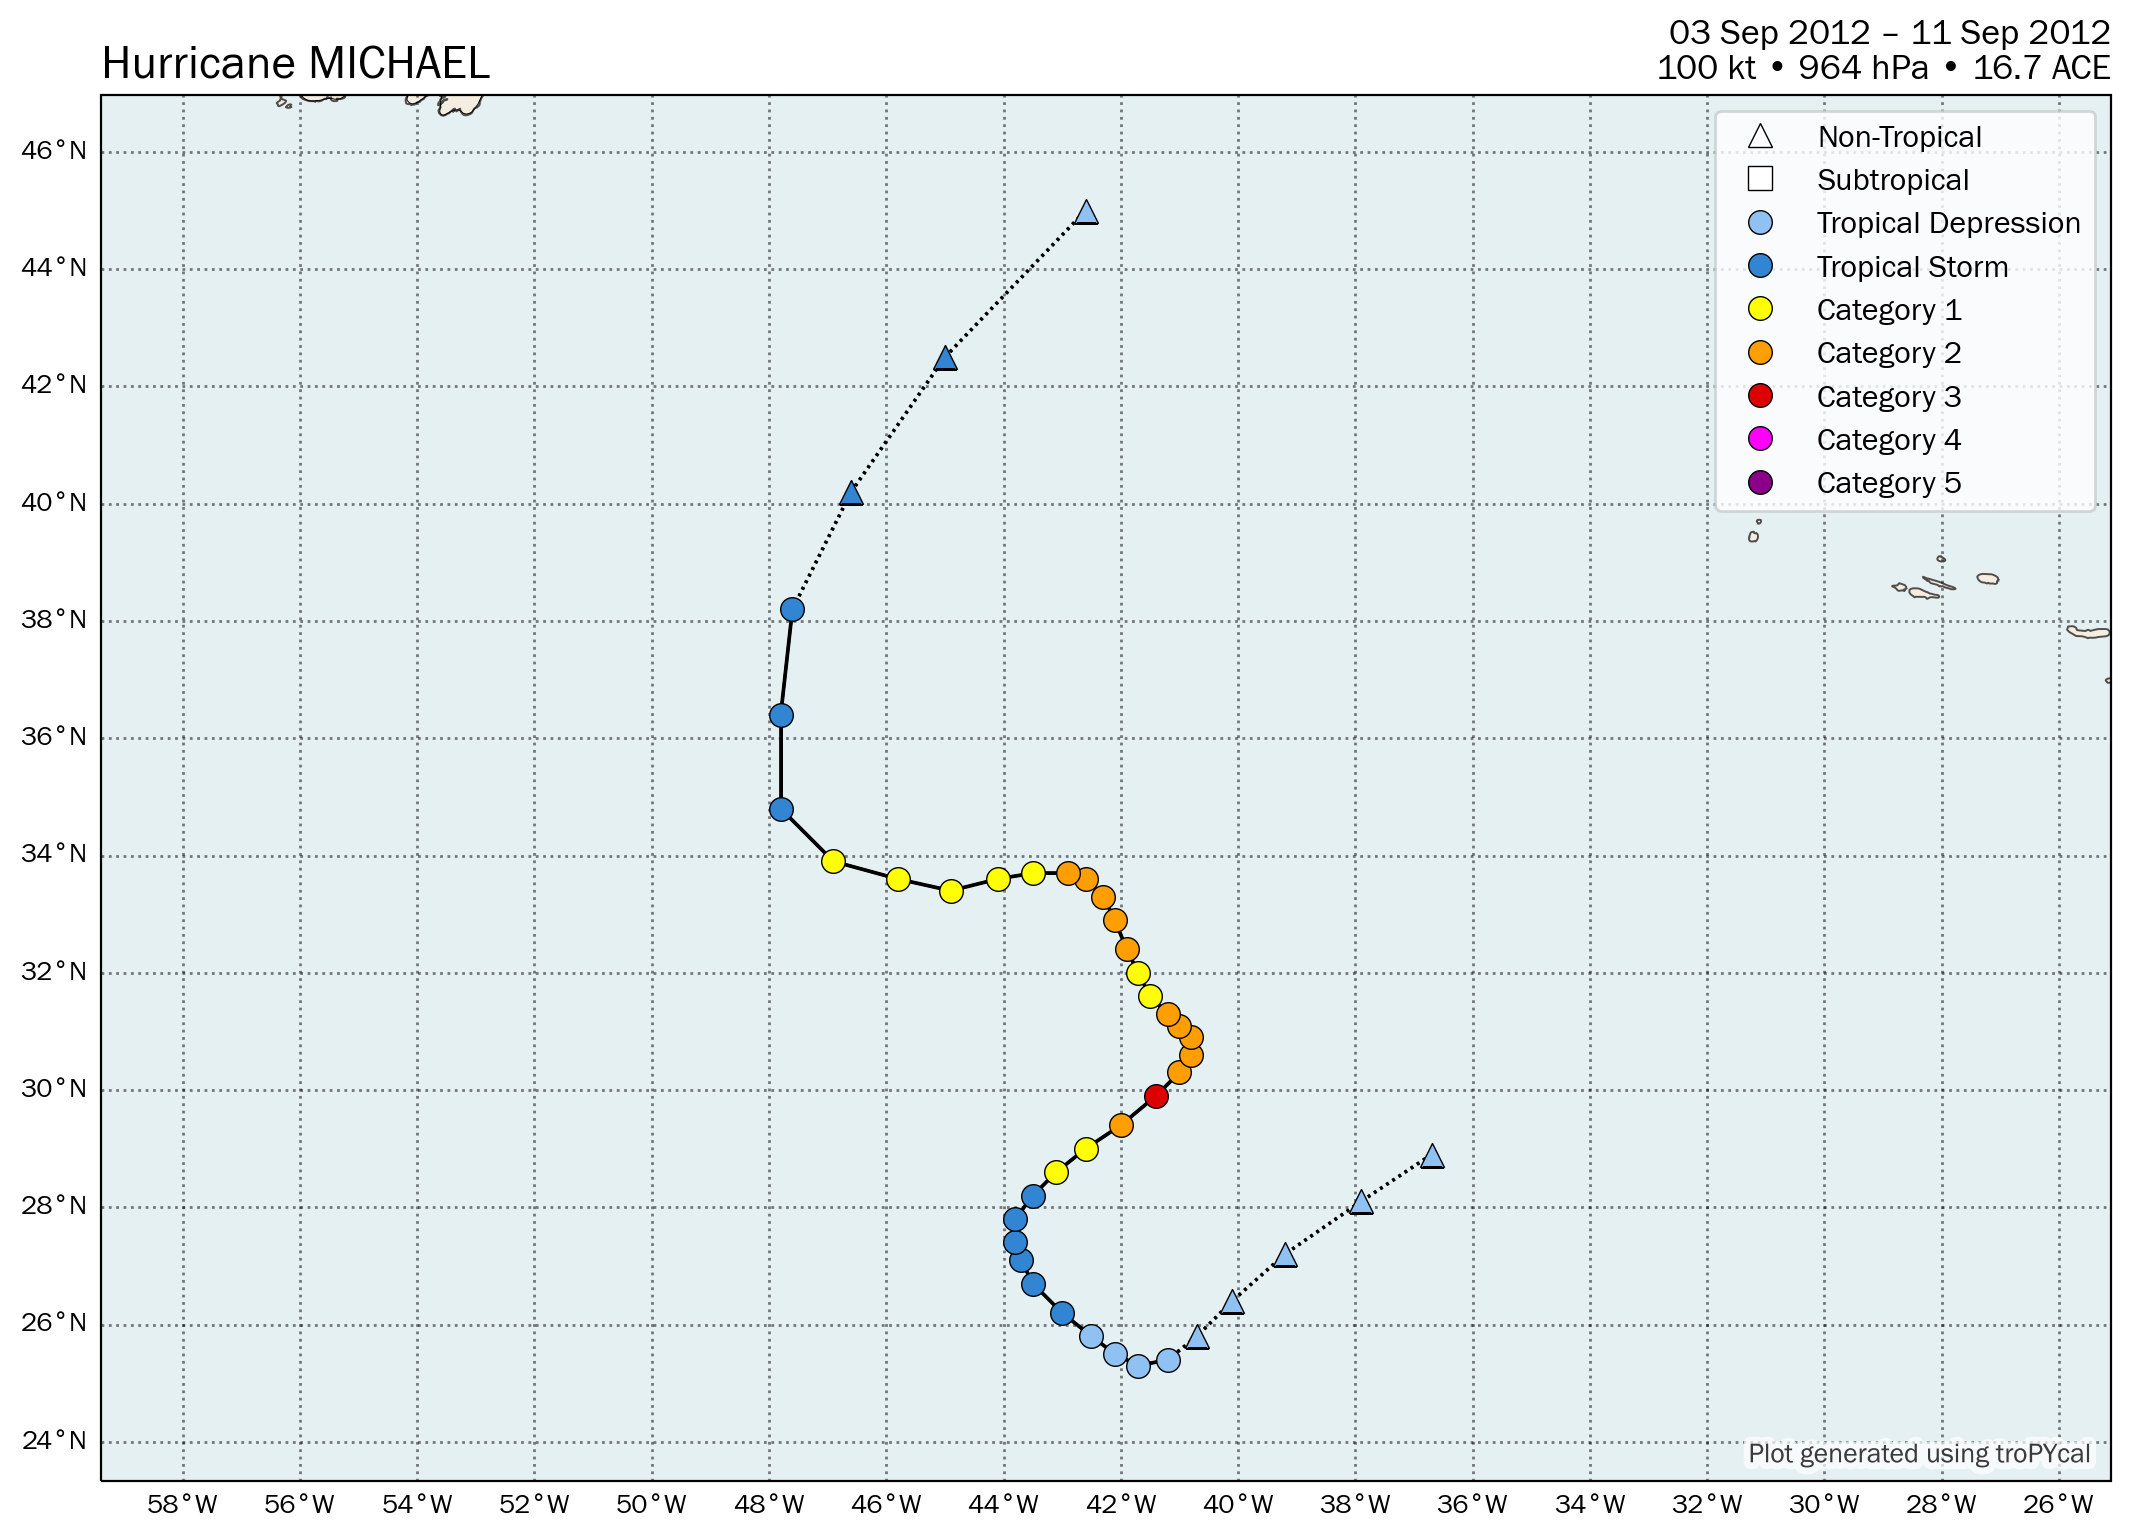
| Time (UTC) | Lat | Lon | Wind (mph) | Pressure | Storm Type | Category |
|---|---|---|---|---|---|---|
| 0000 UTC 02 Sep | 28.9 | -36.7 | 25 | 1015 | Disturbance | - |
| 0600 UTC 02 Sep | 28.1 | -37.9 | 30 | 1015 | Disturbance | - |
| 1200 UTC 02 Sep | 27.2 | -39.2 | 30 | 1015 | Disturbance | - |
| 1800 UTC 02 Sep | 26.4 | -40.1 | 30 | 1015 | Disturbance | - |
| 0000 UTC 03 Sep | 25.8 | -40.7 | 30 | 1015 | Disturbance | - |
| 0600 UTC 03 Sep | 25.4 | -41.2 | 30 | 1015 | Tropical Depression | - |
| 1200 UTC 03 Sep | 25.3 | -41.7 | 30 | 1014 | Tropical Depression | - |
| 1800 UTC 03 Sep | 25.5 | -42.1 | 35 | 1013 | Tropical Depression | - |
| 0000 UTC 04 Sep | 25.8 | -42.5 | 35 | 1011 | Tropical Depression | - |
| 0600 UTC 04 Sep | 26.2 | -43.0 | 40 | 1009 | Tropical Storm | - |
| 1200 UTC 04 Sep | 26.7 | -43.5 | 45 | 1007 | Tropical Storm | - |
| 1800 UTC 04 Sep | 27.1 | -43.7 | 50 | 1006 | Tropical Storm | - |
| 0000 UTC 05 Sep | 27.4 | -43.8 | 50 | 1005 | Tropical Storm | - |
| 0600 UTC 05 Sep | 27.8 | -43.8 | 50 | 1005 | Tropical Storm | - |
| 1200 UTC 05 Sep | 28.2 | -43.5 | 60 | 1001 | Tropical Storm | - |
| 1800 UTC 05 Sep | 28.6 | -43.1 | 75 | 992 | Hurricane | 1 |
| 0000 UTC 06 Sep | 29.0 | -42.6 | 90 | 981 | Hurricane | 1 |
| 0600 UTC 06 Sep | 29.4 | -42.0 | 110 | 968 | Hurricane | 2 |
| 1200 UTC 06 Sep | 29.9 | -41.4 | 115 | 964 | Hurricane | 3 |
| 1800 UTC 06 Sep | 30.3 | -41.0 | 110 | 968 | Hurricane | 2 |
| 0000 UTC 07 Sep | 30.6 | -40.8 | 105 | 970 | Hurricane | 2 |
| 0600 UTC 07 Sep | 30.9 | -40.8 | 105 | 970 | Hurricane | 2 |
| 1200 UTC 07 Sep | 31.1 | -41.0 | 105 | 970 | Hurricane | 2 |
| 1800 UTC 07 Sep | 31.3 | -41.2 | 100 | 973 | Hurricane | 2 |
| 0000 UTC 08 Sep | 31.6 | -41.5 | 90 | 977 | Hurricane | 1 |
| 0600 UTC 08 Sep | 32.0 | -41.7 | 90 | 978 | Hurricane | 1 |
| 1200 UTC 08 Sep | 32.4 | -41.9 | 100 | 975 | Hurricane | 2 |
| 1800 UTC 08 Sep | 32.9 | -42.1 | 105 | 972 | Hurricane | 2 |
| 0000 UTC 09 Sep | 33.3 | -42.3 | 105 | 973 | Hurricane | 2 |
| 0600 UTC 09 Sep | 33.6 | -42.6 | 100 | 976 | Hurricane | 2 |
| 1200 UTC 09 Sep | 33.7 | -42.9 | 100 | 976 | Hurricane | 2 |
| 1800 UTC 09 Sep | 33.7 | -43.5 | 90 | 979 | Hurricane | 1 |
| 0000 UTC 10 Sep | 33.6 | -44.1 | 85 | 982 | Hurricane | 1 |
| 0600 UTC 10 Sep | 33.4 | -44.9 | 80 | 985 | Hurricane | 1 |
| 1200 UTC 10 Sep | 33.6 | -45.8 | 80 | 986 | Hurricane | 1 |
| 1800 UTC 10 Sep | 33.9 | -46.9 | 75 | 988 | Hurricane | 1 |
| 0000 UTC 11 Sep | 34.8 | -47.8 | 70 | 991 | Tropical Storm | - |
| 0600 UTC 11 Sep | 36.4 | -47.8 | 65 | 994 | Tropical Storm | - |
| 1200 UTC 11 Sep | 38.2 | -47.6 | 50 | 997 | Tropical Storm | - |
| 1800 UTC 11 Sep | 40.2 | -46.6 | 45 | 1000 | Remnant Low | - |
| 0000 UTC 12 Sep | 42.5 | -45.0 | 40 | 1003 | Remnant Low | - |
| 0600 UTC 12 Sep | 45.0 | -42.6 | 35 | 1006 | Remnant Low | - |
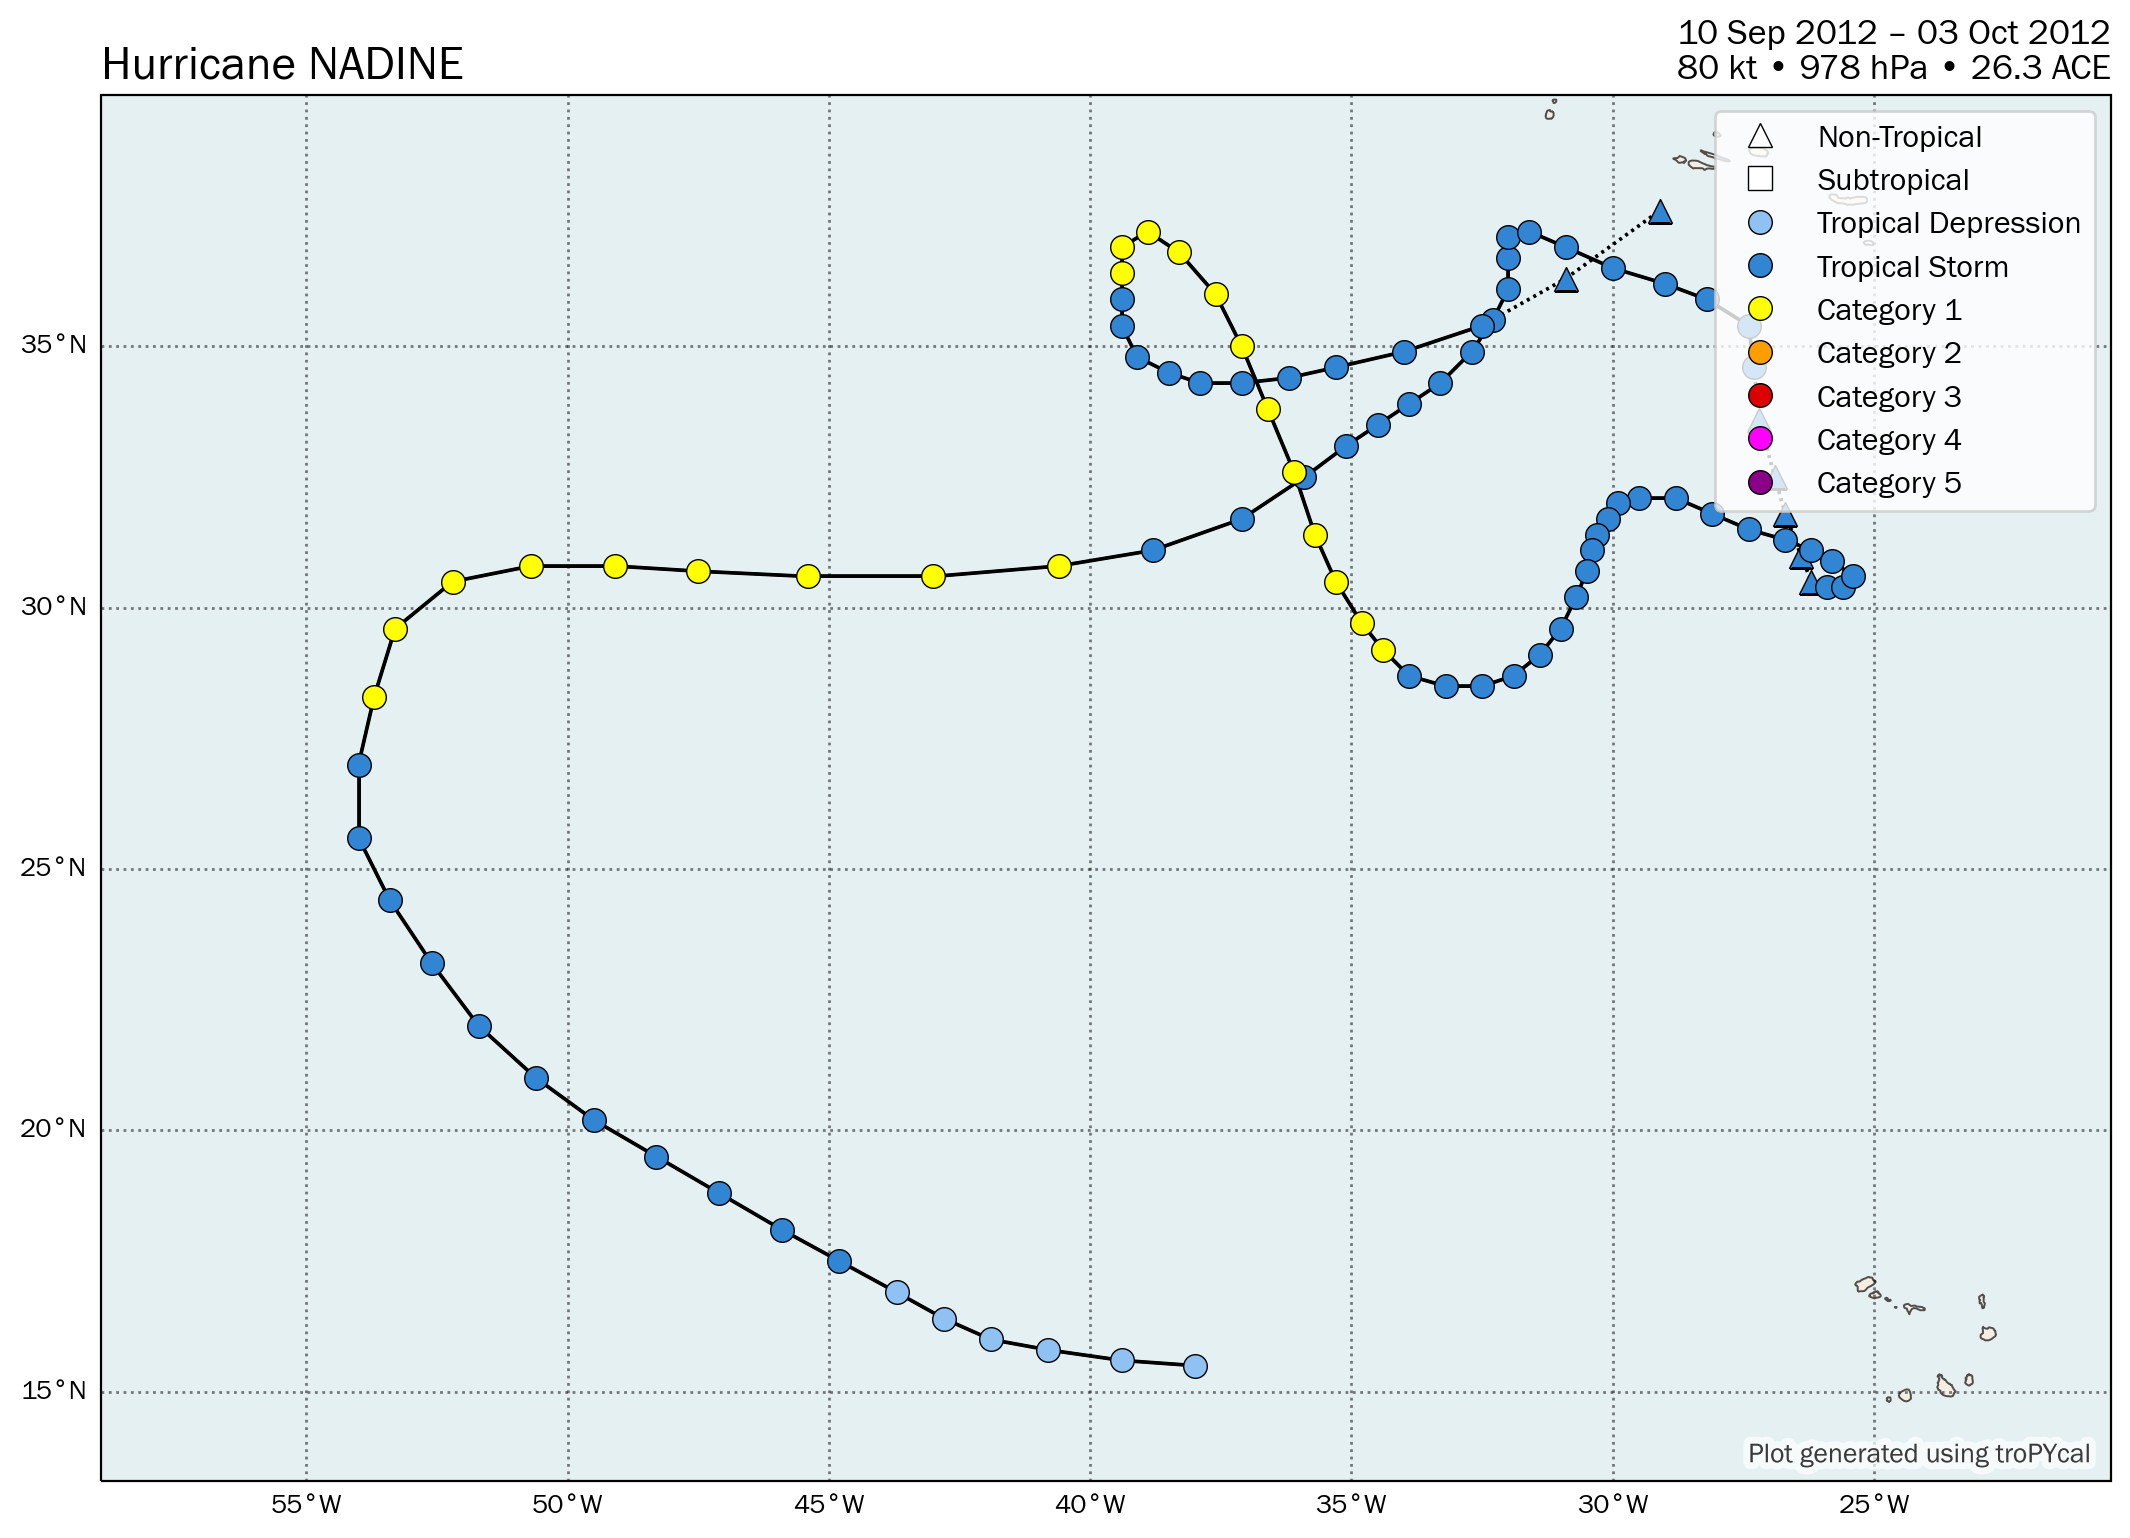
| Time (UTC) | Lat | Lon | Wind (mph) | Pressure | Storm Type | Category |
|---|---|---|---|---|---|---|
| 1200 UTC 10 Sep | 15.5 | -38.0 | 30 | 1008 | Tropical Depression | - |
| 1800 UTC 10 Sep | 15.6 | -39.4 | 30 | 1007 | Tropical Depression | - |
| 0000 UTC 11 Sep | 15.8 | -40.8 | 30 | 1007 | Tropical Depression | - |
| 0600 UTC 11 Sep | 16.0 | -41.9 | 30 | 1007 | Tropical Depression | - |
| 1200 UTC 11 Sep | 16.4 | -42.8 | 35 | 1006 | Tropical Depression | - |
| 1800 UTC 11 Sep | 16.9 | -43.7 | 35 | 1006 | Tropical Depression | - |
| 0000 UTC 12 Sep | 17.5 | -44.8 | 40 | 1004 | Tropical Storm | - |
| 0600 UTC 12 Sep | 18.1 | -45.9 | 50 | 1001 | Tropical Storm | - |
| 1200 UTC 12 Sep | 18.8 | -47.1 | 60 | 997 | Tropical Storm | - |
| 1800 UTC 12 Sep | 19.5 | -48.3 | 65 | 994 | Tropical Storm | - |
| 0000 UTC 13 Sep | 20.2 | -49.5 | 70 | 990 | Tropical Storm | - |
| 0600 UTC 13 Sep | 21.0 | -50.6 | 70 | 990 | Tropical Storm | - |
| 1200 UTC 13 Sep | 22.0 | -51.7 | 70 | 990 | Tropical Storm | - |
| 1800 UTC 13 Sep | 23.2 | -52.6 | 70 | 989 | Tropical Storm | - |
| 0000 UTC 14 Sep | 24.4 | -53.4 | 70 | 989 | Tropical Storm | - |
| 0600 UTC 14 Sep | 25.6 | -54.0 | 70 | 987 | Tropical Storm | - |
| 1200 UTC 14 Sep | 27.0 | -54.0 | 70 | 986 | Tropical Storm | - |
| 1800 UTC 14 Sep | 28.3 | -53.7 | 75 | 984 | Hurricane | 1 |
| 0000 UTC 15 Sep | 29.6 | -53.3 | 80 | 981 | Hurricane | 1 |
| 0600 UTC 15 Sep | 30.5 | -52.2 | 80 | 980 | Hurricane | 1 |
| 1200 UTC 15 Sep | 30.8 | -50.7 | 80 | 980 | Hurricane | 1 |
| 1800 UTC 15 Sep | 30.8 | -49.1 | 80 | 980 | Hurricane | 1 |
| 0000 UTC 16 Sep | 30.7 | -47.5 | 80 | 981 | Hurricane | 1 |
| 0600 UTC 16 Sep | 30.6 | -45.4 | 75 | 984 | Hurricane | 1 |
| 1200 UTC 16 Sep | 30.6 | -43.0 | 75 | 985 | Hurricane | 1 |
| 1800 UTC 16 Sep | 30.8 | -40.6 | 75 | 985 | Hurricane | 1 |
| 0000 UTC 17 Sep | 31.1 | -38.8 | 70 | 986 | Tropical Storm | - |
| 0600 UTC 17 Sep | 31.7 | -37.1 | 70 | 987 | Tropical Storm | - |
| 1200 UTC 17 Sep | 32.5 | -35.9 | 65 | 988 | Tropical Storm | - |
| 1800 UTC 17 Sep | 33.1 | -35.1 | 65 | 988 | Tropical Storm | - |
| 0000 UTC 18 Sep | 33.5 | -34.5 | 60 | 989 | Tropical Storm | - |
| 0600 UTC 18 Sep | 33.9 | -33.9 | 60 | 989 | Tropical Storm | - |
| 1200 UTC 18 Sep | 34.3 | -33.3 | 60 | 989 | Tropical Storm | - |
| 1800 UTC 18 Sep | 34.9 | -32.7 | 60 | 989 | Tropical Storm | - |
| 0000 UTC 19 Sep | 35.5 | -32.3 | 60 | 989 | Tropical Storm | - |
| 0600 UTC 19 Sep | 36.1 | -32.0 | 60 | 989 | Tropical Storm | - |
| 1200 UTC 19 Sep | 36.7 | -32.0 | 60 | 989 | Tropical Storm | - |
| 1800 UTC 19 Sep | 37.1 | -32.0 | 60 | 987 | Tropical Storm | - |
| 0000 UTC 20 Sep | 37.2 | -31.6 | 60 | 986 | Tropical Storm | - |
| 0600 UTC 20 Sep | 36.9 | -30.9 | 60 | 986 | Tropical Storm | - |
| 1200 UTC 20 Sep | 36.5 | -30.0 | 60 | 986 | Tropical Storm | - |
| 1800 UTC 20 Sep | 36.2 | -29.0 | 65 | 984 | Tropical Storm | - |
| 0000 UTC 21 Sep | 35.9 | -28.2 | 65 | 984 | Tropical Storm | - |
| 0600 UTC 21 Sep | 35.4 | -27.4 | 65 | 984 | Tropical Storm | - |
| 1200 UTC 21 Sep | 34.6 | -27.3 | 60 | 984 | Tropical Storm | - |
| 1800 UTC 21 Sep | 33.6 | -27.2 | 60 | 984 | Remnant Low | - |
| 0000 UTC 22 Sep | 32.5 | -26.9 | 50 | 985 | Remnant Low | - |
| 0600 UTC 22 Sep | 31.8 | -26.7 | 50 | 986 | Remnant Low | - |
| 1200 UTC 22 Sep | 31.0 | -26.4 | 50 | 987 | Remnant Low | - |
| 1800 UTC 22 Sep | 30.5 | -26.2 | 50 | 987 | Remnant Low | - |
| 0000 UTC 23 Sep | 30.4 | -25.9 | 50 | 987 | Tropical Storm | - |
| 0600 UTC 23 Sep | 30.4 | -25.6 | 60 | 987 | Tropical Storm | - |
| 1200 UTC 23 Sep | 30.6 | -25.4 | 60 | 987 | Tropical Storm | - |
| 1800 UTC 23 Sep | 30.9 | -25.8 | 60 | 988 | Tropical Storm | - |
| 0000 UTC 24 Sep | 31.1 | -26.2 | 50 | 990 | Tropical Storm | - |
| 0600 UTC 24 Sep | 31.3 | -26.7 | 50 | 992 | Tropical Storm | - |
| 1200 UTC 24 Sep | 31.5 | -27.4 | 50 | 995 | Tropical Storm | - |
| 1800 UTC 24 Sep | 31.8 | -28.1 | 50 | 996 | Tropical Storm | - |
| 0000 UTC 25 Sep | 32.1 | -28.8 | 45 | 996 | Tropical Storm | - |
| 0600 UTC 25 Sep | 32.1 | -29.5 | 45 | 996 | Tropical Storm | - |
| 1200 UTC 25 Sep | 32.0 | -29.9 | 45 | 997 | Tropical Storm | - |
| 1800 UTC 25 Sep | 31.7 | -30.1 | 45 | 997 | Tropical Storm | - |
| 0000 UTC 26 Sep | 31.4 | -30.3 | 45 | 998 | Tropical Storm | - |
| 0600 UTC 26 Sep | 31.1 | -30.4 | 45 | 998 | Tropical Storm | - |
| 1200 UTC 26 Sep | 30.7 | -30.5 | 50 | 995 | Tropical Storm | - |
| 1800 UTC 26 Sep | 30.2 | -30.7 | 60 | 993 | Tropical Storm | - |
| 0000 UTC 27 Sep | 29.6 | -31.0 | 60 | 993 | Tropical Storm | - |
| 0600 UTC 27 Sep | 29.1 | -31.4 | 60 | 993 | Tropical Storm | - |
| 1200 UTC 27 Sep | 28.7 | -31.9 | 60 | 993 | Tropical Storm | - |
| 1800 UTC 27 Sep | 28.5 | -32.5 | 65 | 993 | Tropical Storm | - |
| 0000 UTC 28 Sep | 28.5 | -33.2 | 65 | 993 | Tropical Storm | - |
| 0600 UTC 28 Sep | 28.7 | -33.9 | 70 | 991 | Tropical Storm | - |
| 1200 UTC 28 Sep | 29.2 | -34.4 | 75 | 988 | Hurricane | 1 |
| 1800 UTC 28 Sep | 29.7 | -34.8 | 75 | 988 | Hurricane | 1 |
| 0000 UTC 29 Sep | 30.5 | -35.3 | 75 | 988 | Hurricane | 1 |
| 0600 UTC 29 Sep | 31.4 | -35.7 | 75 | 988 | Hurricane | 1 |
| 1200 UTC 29 Sep | 32.6 | -36.1 | 75 | 988 | Hurricane | 1 |
| 1800 UTC 29 Sep | 33.8 | -36.6 | 80 | 986 | Hurricane | 1 |
| 0000 UTC 30 Sep | 35.0 | -37.1 | 85 | 983 | Hurricane | 1 |
| 0600 UTC 30 Sep | 36.0 | -37.6 | 85 | 982 | Hurricane | 1 |
| 1200 UTC 30 Sep | 36.8 | -38.3 | 90 | 978 | Hurricane | 1 |
| 1800 UTC 30 Sep | 37.2 | -38.9 | 90 | 978 | Hurricane | 1 |
| 0000 UTC 01 Oct | 36.9 | -39.4 | 85 | 980 | Hurricane | 1 |
| 0600 UTC 01 Oct | 36.4 | -39.4 | 75 | 988 | Hurricane | 1 |
| 1200 UTC 01 Oct | 35.9 | -39.4 | 70 | 991 | Tropical Storm | - |
| 1800 UTC 01 Oct | 35.4 | -39.4 | 65 | 995 | Tropical Storm | - |
| 0000 UTC 02 Oct | 34.8 | -39.1 | 65 | 995 | Tropical Storm | - |
| 0600 UTC 02 Oct | 34.5 | -38.5 | 65 | 995 | Tropical Storm | - |
| 1200 UTC 02 Oct | 34.3 | -37.9 | 65 | 995 | Tropical Storm | - |
| 1800 UTC 02 Oct | 34.3 | -37.1 | 65 | 995 | Tropical Storm | - |
| 0000 UTC 03 Oct | 34.4 | -36.2 | 60 | 998 | Tropical Storm | - |
| 0600 UTC 03 Oct | 34.6 | -35.3 | 50 | 1000 | Tropical Storm | - |
| 1200 UTC 03 Oct | 34.9 | -34.0 | 50 | 1000 | Tropical Storm | - |
| 1800 UTC 03 Oct | 35.4 | -32.5 | 45 | 1000 | Tropical Storm | - |
| 0000 UTC 04 Oct | 36.3 | -30.9 | 45 | 998 | Remnant Low | - |
| 0600 UTC 04 Oct | 37.6 | -29.1 | 45 | 996 | Remnant Low | - |
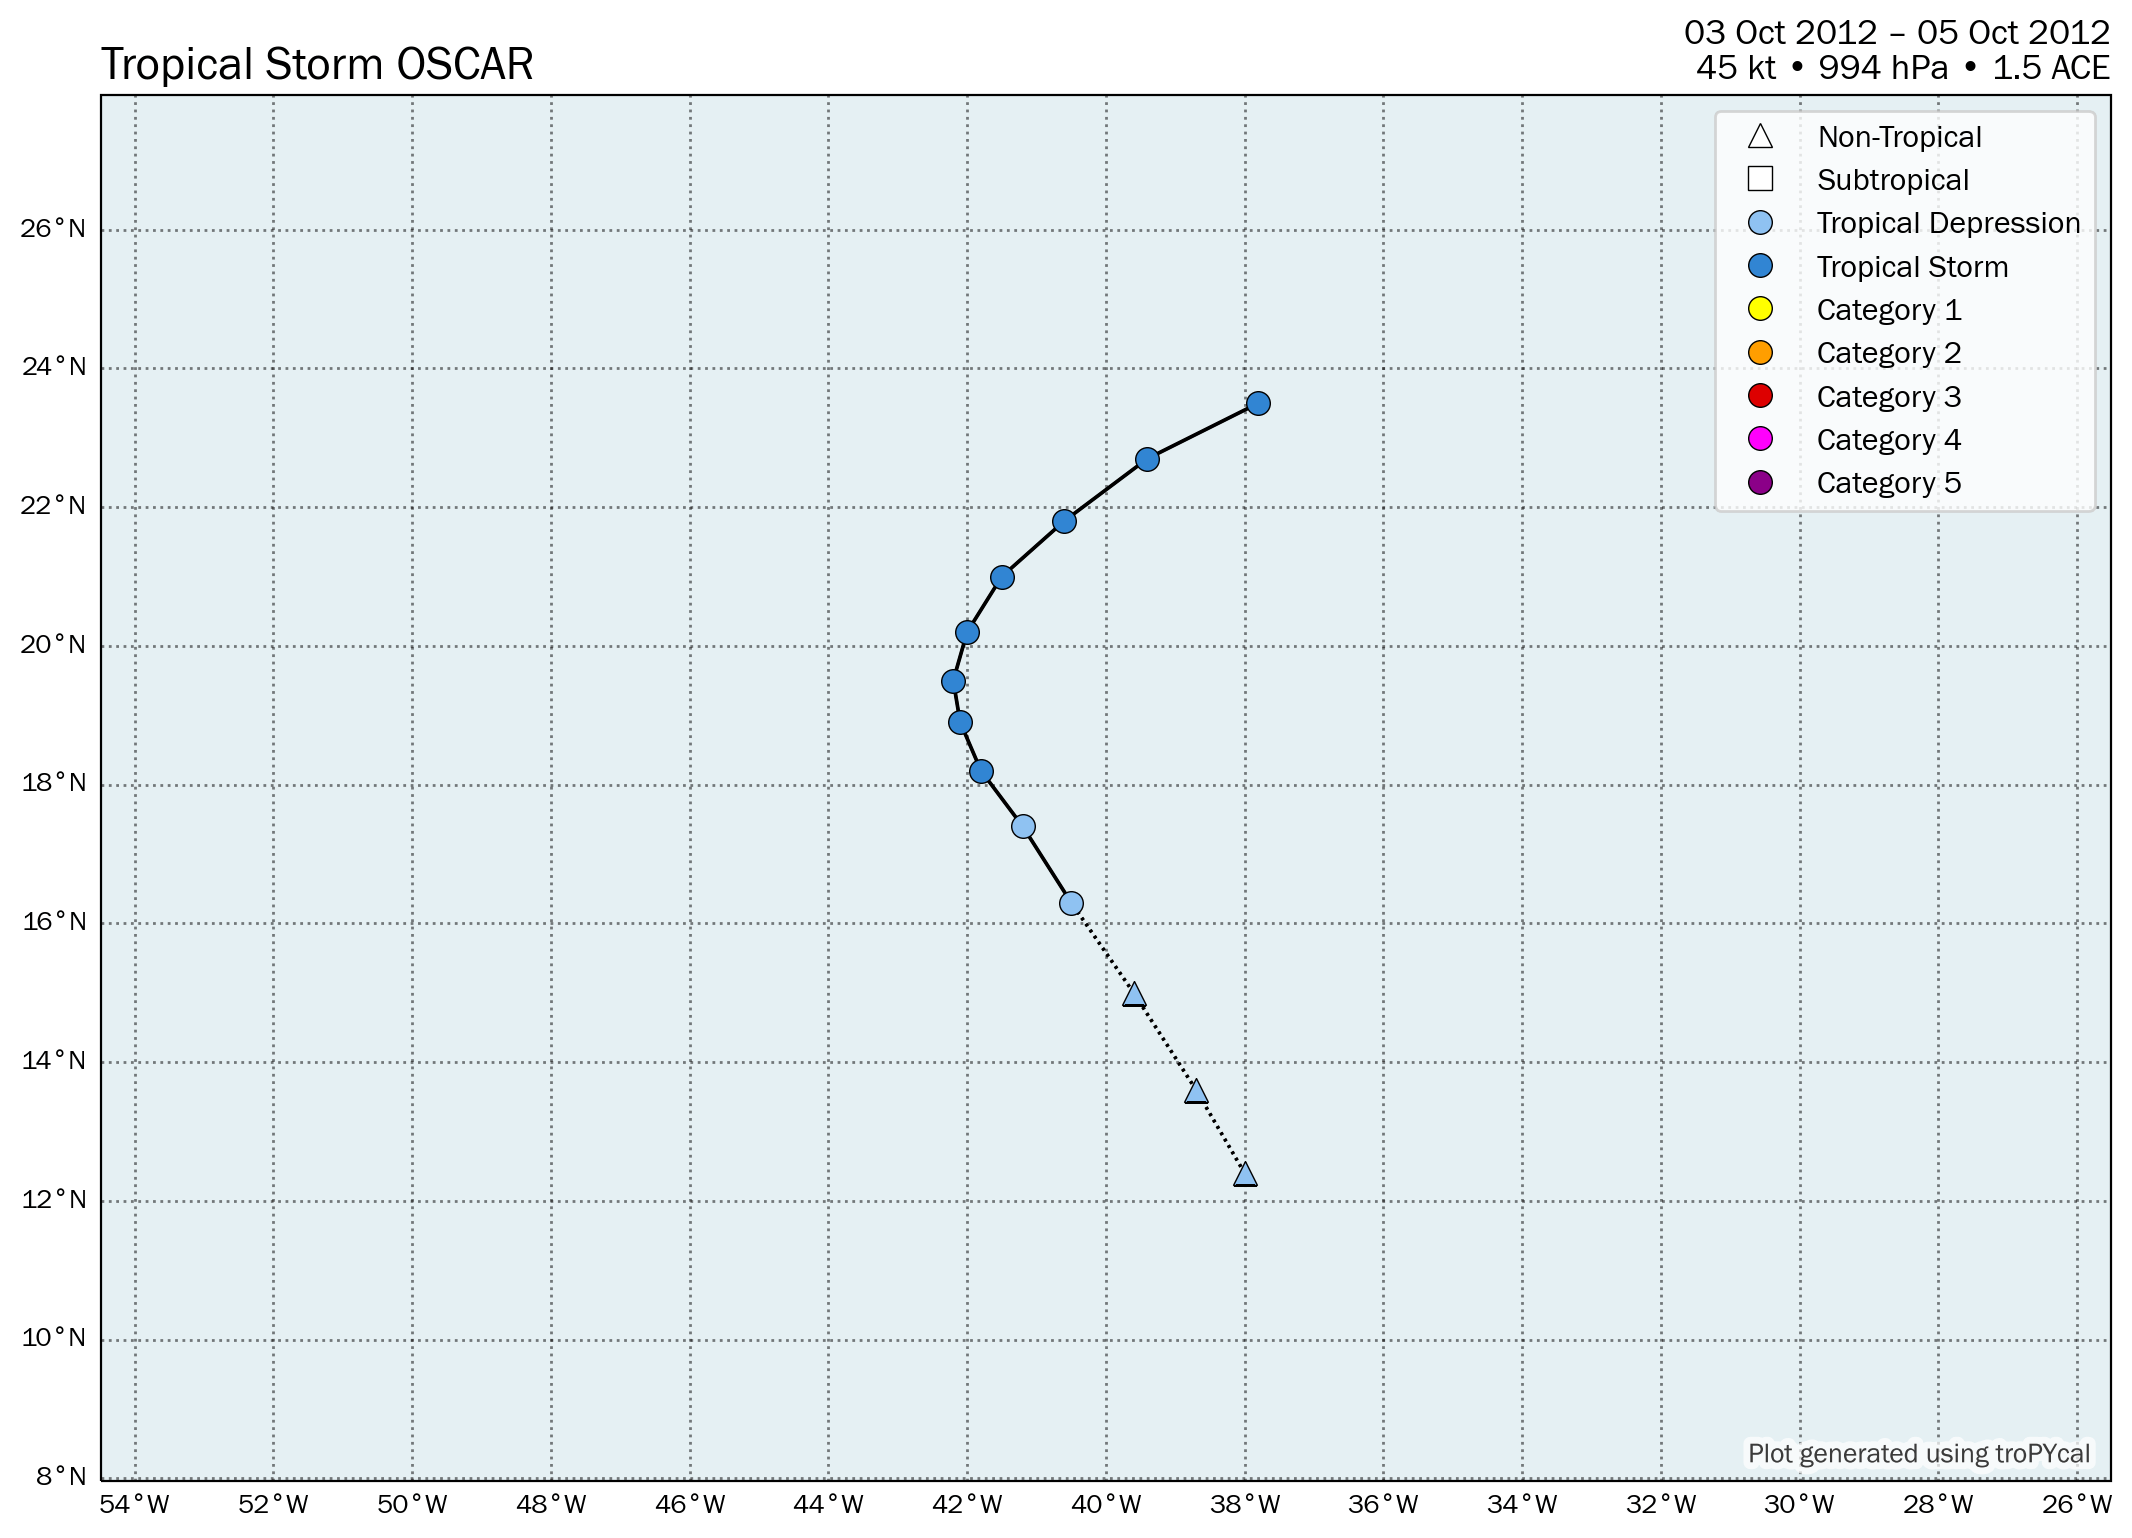
| Time (UTC) | Lat | Lon | Wind (mph) | Pressure | Storm Type | Category |
|---|---|---|---|---|---|---|
| 1200 UTC 02 Oct | 12.4 | -38.0 | 30 | 1008 | Disturbance | - |
| 1800 UTC 02 Oct | 13.6 | -38.7 | 30 | 1008 | Disturbance | - |
| 0000 UTC 03 Oct | 15.0 | -39.6 | 35 | 1007 | Disturbance | - |
| 0600 UTC 03 Oct | 16.3 | -40.5 | 35 | 1006 | Tropical Depression | - |
| 1200 UTC 03 Oct | 17.4 | -41.2 | 35 | 1006 | Tropical Depression | - |
| 1800 UTC 03 Oct | 18.2 | -41.8 | 40 | 1005 | Tropical Storm | - |
| 0000 UTC 04 Oct | 18.9 | -42.1 | 45 | 1002 | Tropical Storm | - |
| 0600 UTC 04 Oct | 19.5 | -42.2 | 45 | 1001 | Tropical Storm | - |
| 1200 UTC 04 Oct | 20.2 | -42.0 | 50 | 998 | Tropical Storm | - |
| 1800 UTC 04 Oct | 21.0 | -41.5 | 50 | 996 | Tropical Storm | - |
| 0000 UTC 05 Oct | 21.8 | -40.6 | 50 | 995 | Tropical Storm | - |
| 0600 UTC 05 Oct | 22.7 | -39.4 | 50 | 994 | Tropical Storm | - |
| 1200 UTC 05 Oct | 23.5 | -37.8 | 50 | 994 | Tropical Storm | - |
Summary Plot

Recon-Derived Wind Swath

Recon-Derived MSLP Swath

| Time (UTC) | Lat | Lon | Wind (mph) | Pressure | Storm Type | Category |
|---|---|---|---|---|---|---|
| 1800 UTC 10 Oct | 25.5 | -72.5 | 30 | 1012 | Disturbance | - |
| 0000 UTC 11 Oct | 25.4 | -72.4 | 35 | 1010 | Tropical Depression | - |
| 0600 UTC 11 Oct | 25.4 | -72.2 | 40 | 1009 | Tropical Storm | - |
| 1200 UTC 11 Oct | 25.5 | -72.2 | 40 | 1008 | Tropical Storm | - |
| 1800 UTC 11 Oct | 25.6 | -72.3 | 40 | 1007 | Tropical Storm | - |
| 0000 UTC 12 Oct | 25.5 | -72.4 | 45 | 1005 | Tropical Storm | - |
| 0600 UTC 12 Oct | 25.4 | -72.3 | 45 | 1005 | Tropical Storm | - |
| 1200 UTC 12 Oct | 25.3 | -72.2 | 45 | 1006 | Tropical Storm | - |
| 1800 UTC 12 Oct | 25.4 | -72.1 | 40 | 1007 | Tropical Storm | - |
| 0000 UTC 13 Oct | 25.4 | -71.9 | 40 | 1007 | Tropical Storm | - |
| 0600 UTC 13 Oct | 25.3 | -71.7 | 35 | 1008 | Tropical Depression | - |
Summary Plot

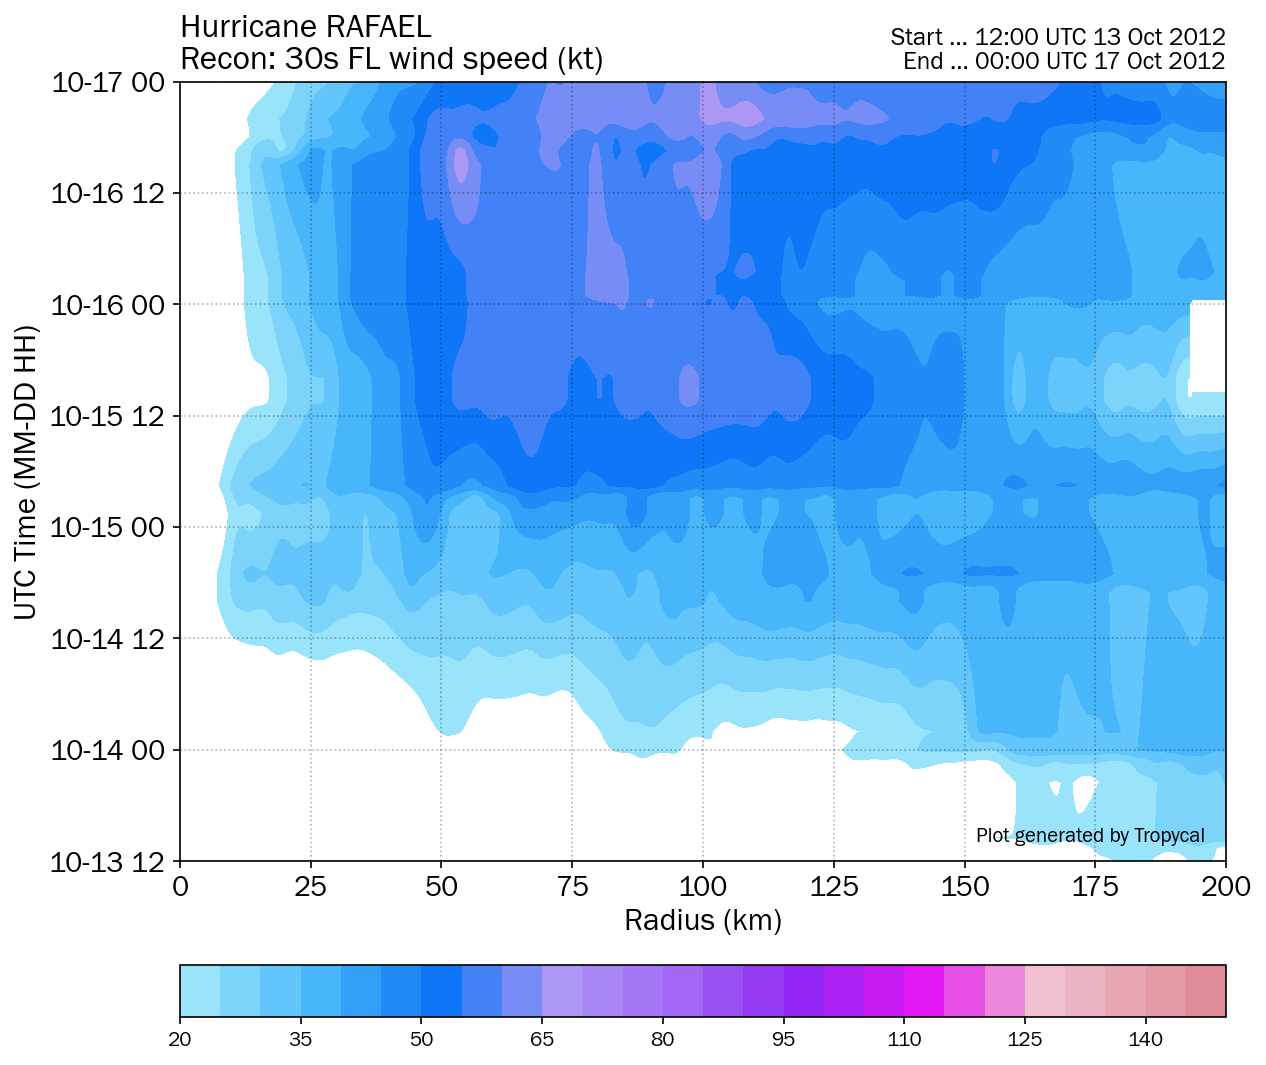
Recon-Derived Hovmoller
Recon-Derived Wind Swath

Recon-Derived MSLP Swath

| Time (UTC) | Lat | Lon | Wind (mph) | Pressure | Storm Type | Category |
|---|---|---|---|---|---|---|
| 1800 UTC 12 Oct | 14.7 | -62.7 | 40 | 1006 | Tropical Storm | - |
| 0000 UTC 13 Oct | 15.0 | -63.2 | 40 | 1007 | Tropical Storm | - |
| 0600 UTC 13 Oct | 15.3 | -63.7 | 40 | 1006 | Tropical Storm | - |
| 1200 UTC 13 Oct | 15.6 | -63.8 | 40 | 1006 | Tropical Storm | - |
| 1800 UTC 13 Oct | 16.7 | -63.6 | 45 | 1004 | Tropical Storm | - |
| 0000 UTC 14 Oct | 17.9 | -63.5 | 50 | 1004 | Tropical Storm | - |
| 0600 UTC 14 Oct | 18.9 | -63.6 | 50 | 1003 | Tropical Storm | - |
| 1200 UTC 14 Oct | 19.7 | -63.9 | 60 | 999 | Tropical Storm | - |
| 1800 UTC 14 Oct | 20.4 | -64.3 | 65 | 994 | Tropical Storm | - |
| 0000 UTC 15 Oct | 21.3 | -64.7 | 70 | 989 | Tropical Storm | - |
| 0600 UTC 15 Oct | 22.0 | -65.2 | 75 | 986 | Hurricane | 1 |
| 1200 UTC 15 Oct | 22.6 | -65.6 | 80 | 983 | Hurricane | 1 |
| 1800 UTC 15 Oct | 23.6 | -65.8 | 85 | 979 | Hurricane | 1 |
| 0000 UTC 16 Oct | 24.6 | -65.6 | 90 | 974 | Hurricane | 1 |
| 0600 UTC 16 Oct | 25.9 | -65.3 | 90 | 972 | Hurricane | 1 |
| 1200 UTC 16 Oct | 27.6 | -64.9 | 90 | 969 | Hurricane | 1 |
| 1800 UTC 16 Oct | 29.5 | -64.2 | 85 | 970 | Hurricane | 1 |
| 0000 UTC 17 Oct | 31.6 | -63.1 | 85 | 970 | Hurricane | 1 |
| 0600 UTC 17 Oct | 34.0 | -61.7 | 80 | 972 | Hurricane | 1 |
| 1200 UTC 17 Oct | 36.5 | -60.1 | 75 | 972 | Hurricane | 1 |
| 1800 UTC 17 Oct | 38.8 | -58.0 | 75 | 972 | Post-Tropical Cyclone | 1 |
| 0000 UTC 18 Oct | 41.3 | -55.0 | 75 | 972 | Post-Tropical Cyclone | 1 |
| 0600 UTC 18 Oct | 43.4 | -50.7 | 70 | 972 | Post-Tropical Cyclone | - |
| 1200 UTC 18 Oct | 45.2 | -46.0 | 65 | 972 | Post-Tropical Cyclone | - |
| 1800 UTC 18 Oct | 47.0 | -41.0 | 65 | 973 | Post-Tropical Cyclone | - |
| 0000 UTC 19 Oct | 49.2 | -36.2 | 60 | 975 | Post-Tropical Cyclone | - |
| 0600 UTC 19 Oct | 51.0 | -32.5 | 60 | 973 | Post-Tropical Cyclone | - |
| 1200 UTC 19 Oct | 53.0 | -29.5 | 60 | 970 | Post-Tropical Cyclone | - |
| 1800 UTC 19 Oct | 55.0 | -30.0 | 60 | 968 | Post-Tropical Cyclone | - |
| 0000 UTC 20 Oct | 56.5 | -33.0 | 60 | 966 | Post-Tropical Cyclone | - |
| 0600 UTC 20 Oct | 56.0 | -37.0 | 60 | 966 | Post-Tropical Cyclone | - |
| 1200 UTC 20 Oct | 53.1 | -36.4 | 60 | 967 | Post-Tropical Cyclone | - |
| 1800 UTC 20 Oct | 50.8 | -34.3 | 60 | 970 | Post-Tropical Cyclone | - |
| 0000 UTC 21 Oct | 49.7 | -32.2 | 50 | 975 | Post-Tropical Cyclone | - |
| 0600 UTC 21 Oct | 49.2 | -31.1 | 45 | 978 | Post-Tropical Cyclone | - |
| 1200 UTC 21 Oct | 48.2 | -30.6 | 45 | 979 | Post-Tropical Cyclone | - |
| 1800 UTC 21 Oct | 47.0 | -30.8 | 45 | 982 | Post-Tropical Cyclone | - |
| 0000 UTC 22 Oct | 45.5 | -31.1 | 45 | 983 | Post-Tropical Cyclone | - |
| 0600 UTC 22 Oct | 43.9 | -29.8 | 45 | 985 | Post-Tropical Cyclone | - |
| 1200 UTC 22 Oct | 41.9 | -28.3 | 45 | 987 | Post-Tropical Cyclone | - |
| 1800 UTC 22 Oct | 40.0 | -27.0 | 45 | 989 | Post-Tropical Cyclone | - |
| 0000 UTC 23 Oct | 39.2 | -25.5 | 45 | 992 | Post-Tropical Cyclone | - |
| 0600 UTC 23 Oct | 39.5 | -24.5 | 45 | 992 | Post-Tropical Cyclone | - |
| 1200 UTC 23 Oct | 39.8 | -23.6 | 45 | 992 | Post-Tropical Cyclone | - |
| 1800 UTC 23 Oct | 40.5 | -22.1 | 45 | 992 | Post-Tropical Cyclone | - |
| 0000 UTC 24 Oct | 41.2 | -20.1 | 45 | 993 | Post-Tropical Cyclone | - |
| 0600 UTC 24 Oct | 41.6 | -18.8 | 45 | 995 | Post-Tropical Cyclone | - |
| 1200 UTC 24 Oct | 42.1 | -17.5 | 35 | 995 | Post-Tropical Cyclone | - |
| 1800 UTC 24 Oct | 41.9 | -16.0 | 35 | 995 | Post-Tropical Cyclone | - |
| 0000 UTC 25 Oct | 41.6 | -14.6 | 35 | 995 | Post-Tropical Cyclone | - |
| 0600 UTC 25 Oct | 41.3 | -13.3 | 35 | 995 | Post-Tropical Cyclone | - |
| 1200 UTC 25 Oct | 41.0 | -12.0 | 35 | 996 | Post-Tropical Cyclone | - |
| 1800 UTC 25 Oct | 40.9 | -11.2 | 35 | 997 | Post-Tropical Cyclone | - |
| 0000 UTC 26 Oct | 40.7 | -10.4 | 35 | 998 | Post-Tropical Cyclone | - |
| 0600 UTC 26 Oct | 40.3 | -9.1 | 35 | 999 | Post-Tropical Cyclone | - |
| 1200 UTC 26 Oct | 40.0 | -7.5 | 30 | 1002 | Post-Tropical Cyclone | - |
Summary Map
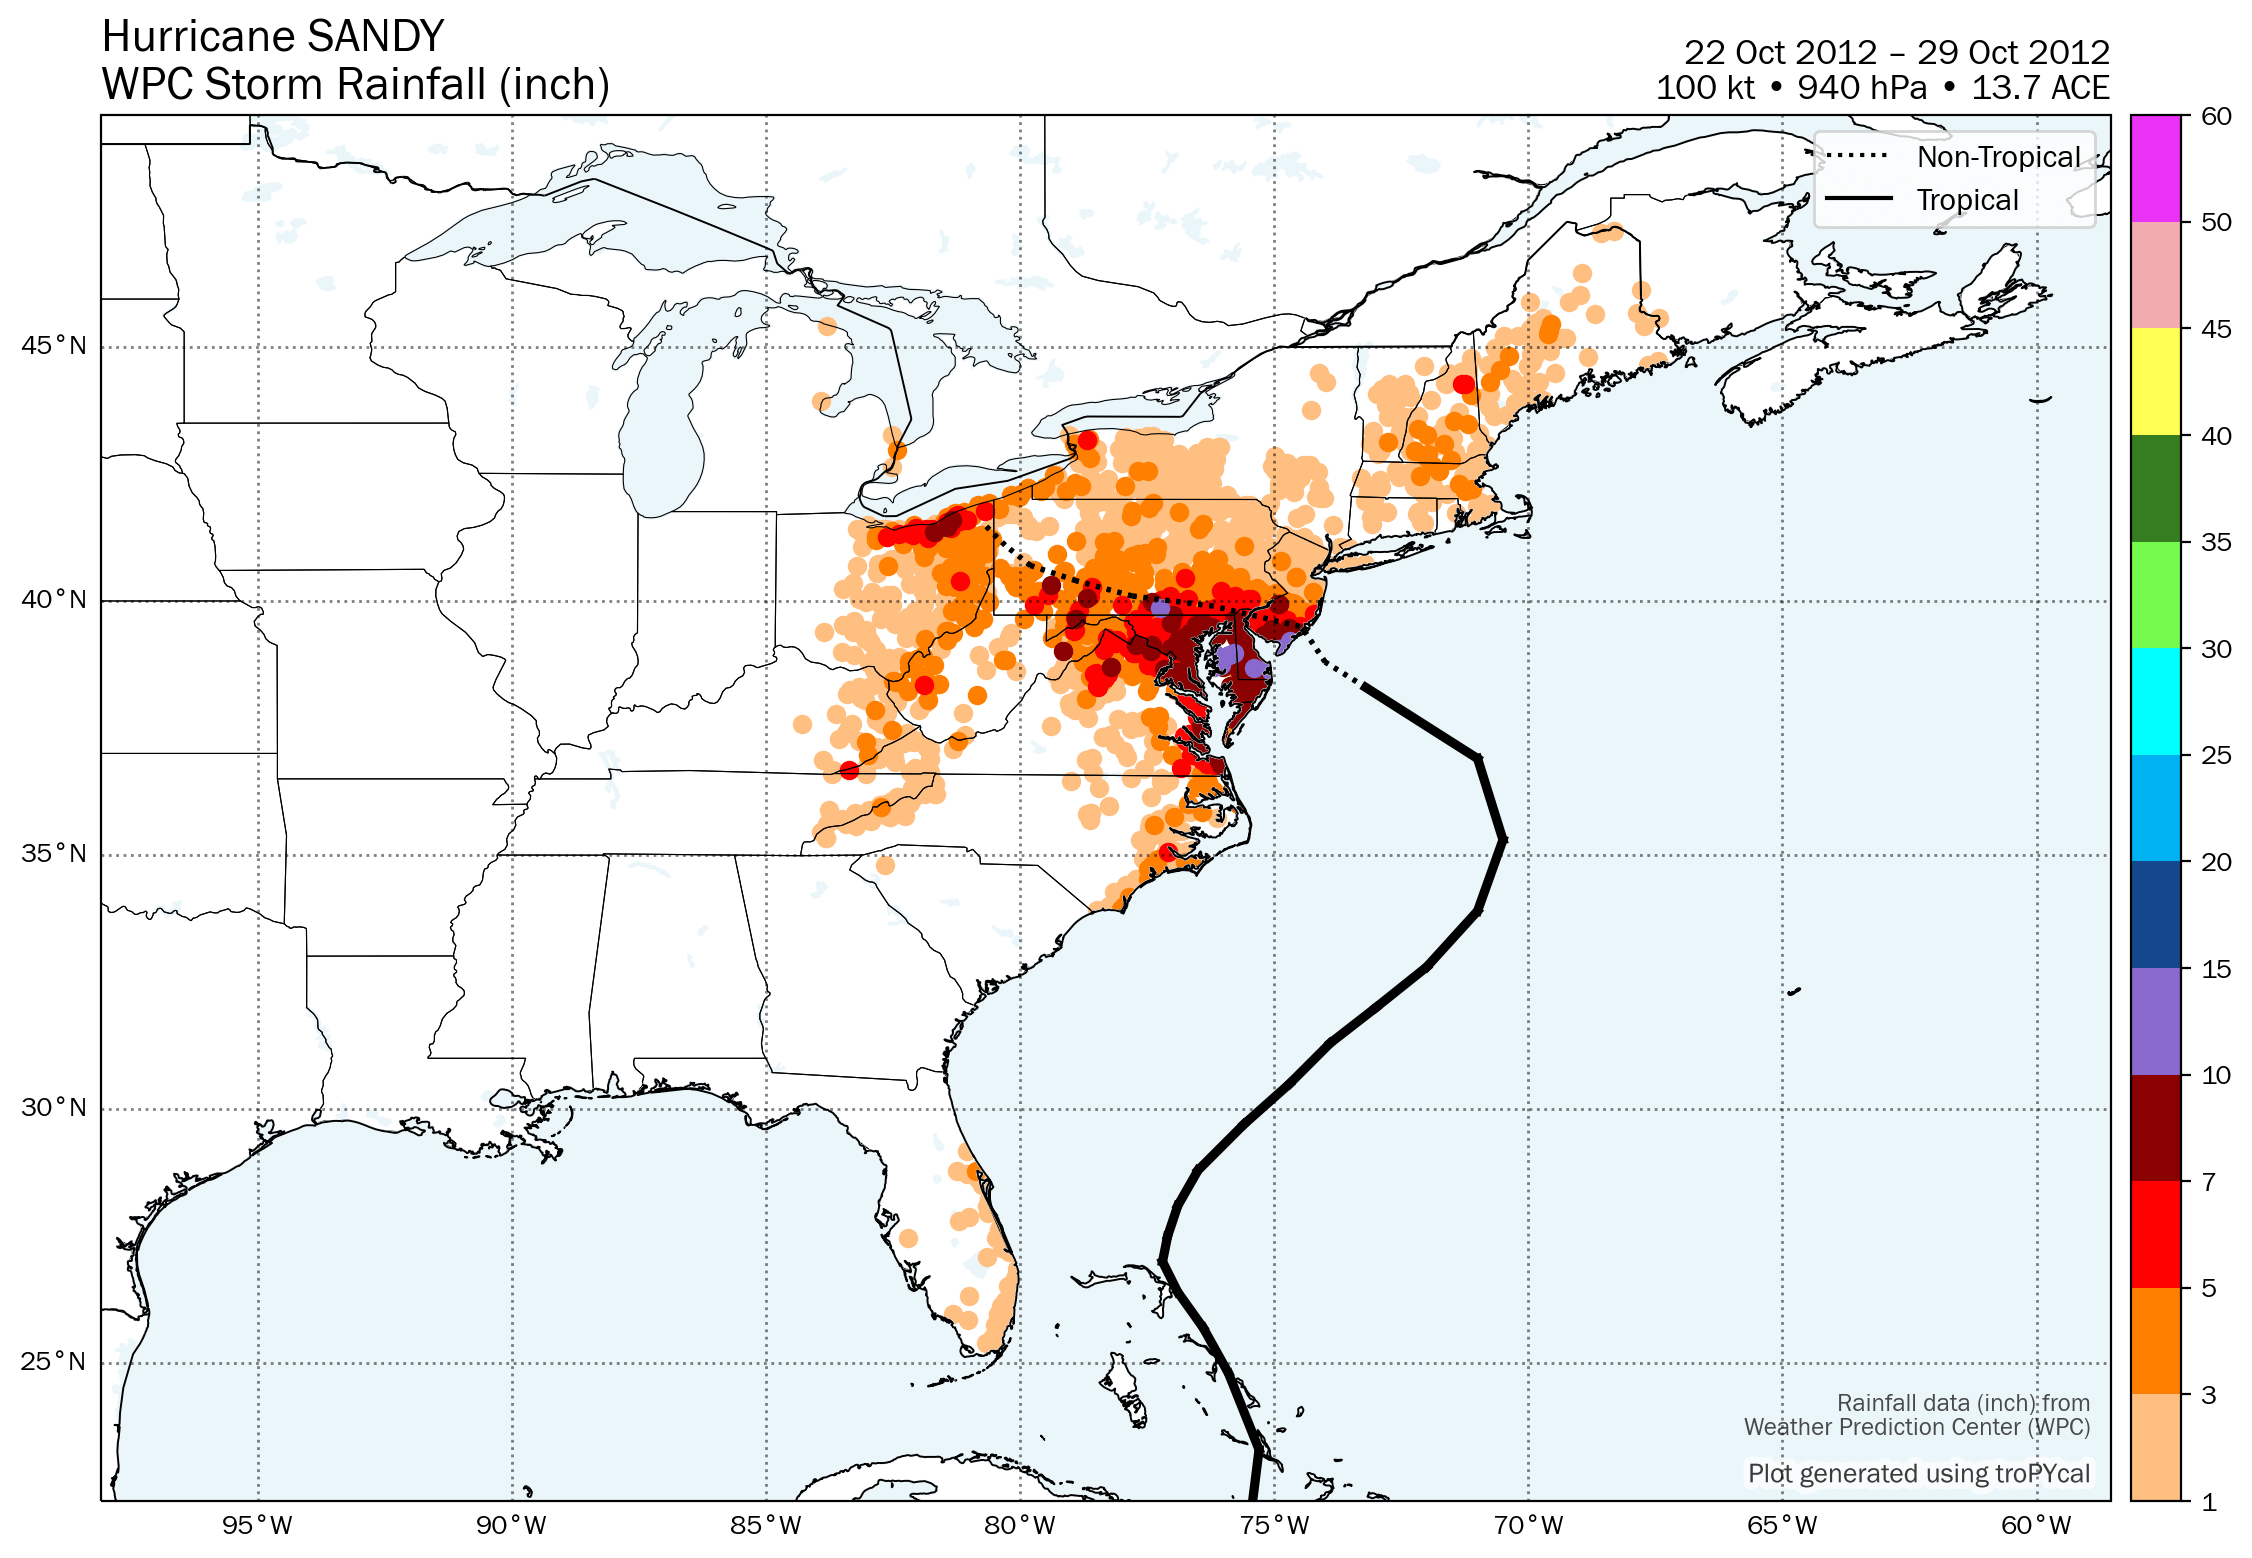
Gridded Rainfall

Summary Plot

Recon-Derived Hovmoller

Recon-Derived Wind Swath

Recon-Derived MSLP Swath

| Time (UTC) | Lat | Lon | Wind (mph) | Pressure | Storm Type | Category |
|---|---|---|---|---|---|---|
| 1800 UTC 21 Oct | 14.3 | -77.4 | 30 | 1006 | Disturbance | - |
| 0000 UTC 22 Oct | 13.9 | -77.8 | 30 | 1005 | Disturbance | - |
| 0600 UTC 22 Oct | 13.5 | -78.2 | 30 | 1003 | Disturbance | - |
| 1200 UTC 22 Oct | 13.1 | -78.6 | 35 | 1002 | Tropical Depression | - |
| 1800 UTC 22 Oct | 12.7 | -78.7 | 40 | 1000 | Tropical Storm | - |
| 0000 UTC 23 Oct | 12.6 | -78.4 | 45 | 998 | Tropical Storm | - |
| 0600 UTC 23 Oct | 12.9 | -78.1 | 45 | 998 | Tropical Storm | - |
| 1200 UTC 23 Oct | 13.4 | -77.9 | 45 | 995 | Tropical Storm | - |
| 1800 UTC 23 Oct | 14.0 | -77.6 | 50 | 993 | Tropical Storm | - |
| 0000 UTC 24 Oct | 14.7 | -77.3 | 65 | 990 | Tropical Storm | - |
| 0600 UTC 24 Oct | 15.6 | -77.1 | 70 | 987 | Tropical Storm | - |
| 1200 UTC 24 Oct | 16.6 | -76.9 | 75 | 981 | Hurricane | 1 |
| 1800 UTC 24 Oct | 17.7 | -76.7 | 85 | 972 | Hurricane | 1 |
| 1900 UTC 24 Oct | 17.9 | -76.6 | 85 | 971 | Hurricane | 1 |
| 0000 UTC 25 Oct | 18.9 | -76.4 | 100 | 964 | Hurricane | 2 |
| 0525 UTC 25 Oct | 20.0 | -76.0 | 115 | 954 | Hurricane | 3 |
| 0600 UTC 25 Oct | 20.1 | -76.0 | 115 | 954 | Hurricane | 3 |
| 0900 UTC 25 Oct | 20.9 | -75.7 | 110 | 960 | Hurricane | 2 |
| 1200 UTC 25 Oct | 21.7 | -75.5 | 110 | 966 | Hurricane | 2 |
| 1800 UTC 25 Oct | 23.3 | -75.3 | 105 | 963 | Hurricane | 2 |
| 0000 UTC 26 Oct | 24.8 | -75.9 | 85 | 965 | Hurricane | 1 |
| 0600 UTC 26 Oct | 25.7 | -76.4 | 80 | 968 | Hurricane | 1 |
| 1200 UTC 26 Oct | 26.4 | -76.9 | 75 | 970 | Hurricane | 1 |
| 1800 UTC 26 Oct | 27.0 | -77.2 | 75 | 971 | Hurricane | 1 |
| 0000 UTC 27 Oct | 27.5 | -77.1 | 70 | 969 | Tropical Storm | - |
| 0600 UTC 27 Oct | 28.1 | -76.9 | 70 | 968 | Tropical Storm | - |
| 1200 UTC 27 Oct | 28.8 | -76.5 | 80 | 956 | Hurricane | 1 |
| 1800 UTC 27 Oct | 29.7 | -75.6 | 80 | 960 | Hurricane | 1 |
| 0000 UTC 28 Oct | 30.5 | -74.7 | 75 | 960 | Hurricane | 1 |
| 0600 UTC 28 Oct | 31.3 | -73.9 | 75 | 959 | Hurricane | 1 |
| 1200 UTC 28 Oct | 32.0 | -73.0 | 75 | 954 | Hurricane | 1 |
| 1800 UTC 28 Oct | 32.8 | -72.0 | 75 | 952 | Hurricane | 1 |
| 0000 UTC 29 Oct | 33.9 | -71.0 | 80 | 950 | Hurricane | 1 |
| 0600 UTC 29 Oct | 35.3 | -70.5 | 90 | 947 | Hurricane | 1 |
| 1200 UTC 29 Oct | 36.9 | -71.0 | 100 | 945 | Hurricane | 2 |
| 1800 UTC 29 Oct | 38.3 | -73.2 | 90 | 940 | Hurricane | 1 |
| 2100 UTC 29 Oct | 38.8 | -74.0 | 85 | 943 | Post-Tropical Cyclone | 1 |
| 2330 UTC 29 Oct | 39.4 | -74.4 | 80 | 945 | Post-Tropical Cyclone | 1 |
| 0000 UTC 30 Oct | 39.5 | -74.5 | 80 | 946 | Post-Tropical Cyclone | 1 |
| 0600 UTC 30 Oct | 39.9 | -76.2 | 65 | 960 | Post-Tropical Cyclone | - |
| 1200 UTC 30 Oct | 40.1 | -77.8 | 60 | 978 | Post-Tropical Cyclone | - |
| 1800 UTC 30 Oct | 40.4 | -78.9 | 45 | 986 | Post-Tropical Cyclone | - |
| 0000 UTC 31 Oct | 40.7 | -79.8 | 40 | 992 | Post-Tropical Cyclone | - |
| 0600 UTC 31 Oct | 41.1 | -80.3 | 40 | 993 | Post-Tropical Cyclone | - |
| 1200 UTC 31 Oct | 41.5 | -80.7 | 35 | 995 | Post-Tropical Cyclone | - |
| Time (UTC) | Lat | Lon | Wind (mph) | Pressure | Storm Type | Category |
|---|---|---|---|---|---|---|
| 1800 UTC 21 Oct | 20.1 | -50.8 | 30 | 1011 | Disturbance | - |
| 0000 UTC 22 Oct | 20.4 | -51.2 | 30 | 1011 | Disturbance | - |
| 0600 UTC 22 Oct | 20.8 | -51.5 | 30 | 1010 | Disturbance | - |
| 1200 UTC 22 Oct | 21.3 | -51.7 | 35 | 1009 | Disturbance | - |
| 1800 UTC 22 Oct | 21.9 | -51.8 | 35 | 1006 | Tropical Depression | - |
| 0000 UTC 23 Oct | 22.5 | -51.8 | 35 | 1006 | Tropical Depression | - |
| 0600 UTC 23 Oct | 23.6 | -51.6 | 35 | 1006 | Tropical Depression | - |
| 1200 UTC 23 Oct | 24.7 | -51.3 | 35 | 1006 | Tropical Depression | - |
| 1800 UTC 23 Oct | 25.7 | -50.6 | 35 | 1005 | Tropical Depression | - |
| 0000 UTC 24 Oct | 26.5 | -49.6 | 40 | 1004 | Tropical Storm | - |
| 0600 UTC 24 Oct | 27.2 | -48.5 | 45 | 1003 | Tropical Storm | - |
| 1200 UTC 24 Oct | 27.9 | -46.8 | 50 | 1000 | Tropical Storm | - |
| 1800 UTC 24 Oct | 28.7 | -44.7 | 50 | 1000 | Tropical Storm | - |
| 0000 UTC 25 Oct | 29.5 | -42.4 | 50 | 1000 | Tropical Storm | - |
| 0600 UTC 25 Oct | 30.1 | -40.0 | 50 | 1000 | Tropical Storm | - |
| 1200 UTC 25 Oct | 30.6 | -37.6 | 40 | 1000 | Tropical Storm | - |
| 1800 UTC 25 Oct | 31.0 | -35.1 | 40 | 1001 | Post-Tropical Cyclone | - |
| 0000 UTC 26 Oct | 31.3 | -32.6 | 40 | 1001 | Post-Tropical Cyclone | - |
| 0600 UTC 26 Oct | 31.2 | -30.5 | 35 | 1004 | Post-Tropical Cyclone | - |
| 1200 UTC 26 Oct | 30.9 | -28.6 | 30 | 1006 | Post-Tropical Cyclone | - |